I thought I’d take a moment from my R&R to write about all the hullabaloo surrounding the calving of the large iceberg off the Larsen C ice shelf in Antarctica. First, a few of the headlines:
LA Times: After Antarctica sheds a trillion-ton block of ice, the world asks: Now what?
The Grauniad: Iceberg twice size of Luxembourg breaks off Antarctic ice shelf
Each of these stories has dire warnings in it about warming and climate change, I found this quote from NYT to be most telling:
Talk to scientists who have worked in the Arctic, Antarctic or the world’s glacial zones for decades, and what they keep coming back to is that they have witnessed
monumental physical changes in these once-frozen regions within their professional lifetimes.
So what? There weren’t any “Arctic or Antarctic scientists” a mere half-decade ago, and bases weren’t even established until World War II followed by a hectic post-war expansion:
Bases were established during February (1944) near the abandoned Norwegian whaling station on Deception Island, where the Union Flag was hoisted in place of Argentine flags, and at Port Lockroy (on February 11) on the coast of Graham Land. A further base was founded at Hope Bay on February 13, 1945, after a failed attempt to unload stores on February 7, 1944. These bases were the first ever to be constructed on the mainland Antarctica.[10]
The Operation provoked a massive expansion in international activity after the war. Chile organized its First Chilean Antarctic Expedition in 1947–48. Among other accomplishments, it brought the Chilean president Gabriel González Videla to personally inaugurate one of its bases, thereby becoming the first head of state to set foot on the continent.[11] Signy Research Station (UK) was established in 1947, Australia’s Mawson Station in 1954, Dumont d’Urville Station was the first French station in 1956. In the same year McMurdo Station was built by the United States and the Mirny Station was established by the Soviet Union.
And, our record of observing Antarctica by satellite only extends back to 1979, as shown by this graph from NASA up to March 2017:

So basically, we’ve got about the length of a scientific career’s worth of observing actual data from Antarctica, and from NYT, we get history lessons:
The ice shelf has been floating in the frigid waters on the eastern side of the Antarctic Peninsula for at least 10,000 years.
OK, so what was there before? No Antarctic ice shelf due to a warmer climate then?

How many icebergs the size of Delaware or Luxemborg (neither of which existed 10k years ago) broke off in that time that we never observed? They don’t know.
Just because we can see changes happening on the most remote region of our planet in exquisite detail for the first time in the history of mankind doesn’t necessarily mean those changes are unprecedented. The media has this odd viewpoint that Earth’s processes act over human lifetimes, but in reality they act over millennia.
I can’t get too worked up about this, even though the usual suspects are. Back to R&R, Ta – Anthony
P.S. Be sure to read the quote in my bold below, from Swansea’s Dr Martin O’Leary.

The 1 trillion tonne iceberg
Larsen C Ice Shelf rift finally breaks through
SWANSEA UNIVERSITY
July 12, 2017 – A one trillion tonne iceberg – one of the biggest ever recorded — has calved away from the Larsen C Ice Shelf in Antarctica, after a rift in the ice, monitored by the Swansea University-led MIDAS project, finally completed its path through the ice.
The calving occurred sometime between Monday 10th July and Wednesday 12th July, when a 5,800 square km section of Larsen C finally broke away.
The final breakthrough was detected in data from NASA’s Aqua MODIS satellite instrument, which images in the thermal infrared at a resolution of 1km.
- The iceberg, which is likely to be named A68, weighs more than a trillion tonnes.
- Its volume is twice that of Lake Erie, one of the Great Lakes.
The iceberg weighs more than a trillion tonnes (1,000,000,000,000 metric tonnes), but it was already floating before it calved away so has no immediate impact on sea level. The calving of this iceberg leaves the Larsen C Ice Shelf reduced in area by more than 12%, and the landscape of the Antarctic Peninsula changed forever.
The development of the rift over the last year was monitored using data from the European Space Agency Sentinel-1 satellites — part of the European Copernicus Space Component. Sentinel-1 is a radar imaging system capable of acquiring images regardless of cloud cover, and throughout the current winter period of polar darkness. The detachment of the iceberg was first revealed in a thermal infrared image from NASA’s MODIS instrument, which is also able to acquire data in the Antarctic winter when cloud cover permits.

Although the remaining ice shelf will continue naturally to regrow, Swansea researchers have previously shown that the new configuration is potentially less stable than it was prior to the rift. There is a risk that Larsen C may eventually follow the example of its neighbour, Larsen B, which disintegrated in 2002 following a similar rift-induced calving event in 1995.
Professor Adrian Luckman of Swansea University, lead investigator of the MIDAS project, said:
“We have been anticipating this event for months, and have been surprised how long it took for the rift to break through the final few kilometres of ice. We will continue to monitor both the impact of this calving event on the Larsen C Ice Shelf, and the fate of this huge iceberg.
The iceberg is one of the largest recorded and its future progress is difficult to predict. It may remain in one piece but is more likely to break into fragments. Some of the ice may remain in the area for decades, while parts of the iceberg may drift north into warmer waters.
The recent development in satellite systems such as Sentinel-1 and MODIS has vastly improved our ability to monitor events such as this.”
The Larsen C Ice Shelf, which has a thickness of between 200 and 600 metres, floats on the ocean at the edge of The Antarctic Peninsula, holding back the flow of glaciers that feed into it.
Researchers from the MIDAS Project have been monitoring the rift in Larsen C for many years, following the collapse of the Larsen A ice shelf in 1995 and the sudden break-up of the Larsen B shelf in 2002. They reported rapid advances of the rift in January, May and June, which increased its length to over 200 km and left the iceberg hanging on by a thread of ice just 4.5 km (2.8 miles) wide.
The team monitored the earlier development of the rift using a technique called satellite radar interferometry (SRI) applied to ESA Sentinel-1 images. While the rift is only visible in radar images when it is more than 50m wide, by combining pairs of images, SRI allows the impact of very small changes in ice shelf geometry to be detected, and the rift tip to be monitored precisely.
Dr Martin O’Leary, a Swansea University glaciologist and member of the MIDAS project team, said of the recent calving:
“Although this is a natural event, and we’re not aware of any link to human-induced climate change, this puts the ice shelf in a very vulnerable position. This is the furthest back that the ice front has been in recorded history. We’re going to be watching very carefully for signs that the rest of the shelf is becoming unstable.”
Professor Adrian Luckman of Swansea University added:
“In the ensuing months and years, the ice shelf could either gradually regrow, or may suffer further calving events which may eventually lead to collapse – opinions in the scientific community are divided. Our models say it will be less stable, but any future collapse remains years or decades away.”
Whilst this new iceberg will not immediately raise sea levels, if the shelf loses much more of its area, it could result in glaciers that flow off the land behind speeding up their passage towards the ocean. This non-floating ice would have an eventual impact on sea levels, but only at a very modest rate.
###
Massive iceberg breaks off from Antarctica
NASA/GODDARD SPACE FLIGHT CENTER
An iceberg about the size of the state of Delaware split off from Antarctica’s Larsen C ice shelf sometime between July 10 and July 12. The calving of the massive new iceberg was captured by the Moderate Resolution Imaging Spectroradiometer on NASA’s Aqua satellite, and confirmed by the Visible Infrared Imaging Radiometer Suite instrument on the joint NASA/NOAA Suomi National Polar-orbiting Partnership (Suomi-NPP) satellite. The final breakage was first reported by Project Midas, an Antarctic research project based in the United Kingdom.
Larsen C, a floating platform of glacial ice on the east side of the Antarctic Peninsula, is the fourth largest ice shelf ringing Earth’s southernmost continent. In 2014, a crack that had been slowly growing into the ice shelf for decades suddenly started to spread northwards, creating the nascent iceberg. Now that the close to 2,240 square-mile (5,800 square kilometers) chunk of ice has broken away, the Larsen C shelf area has shrunk by approximately 10 percent.
“The interesting thing is what happens next, how the remaining ice shelf responds,” said Kelly Brunt, a glaciologist with NASA’s Goddard Space Flight Center in Greenbelt, Maryland, and the University of Maryland in College Park. “Will the ice shelf weaken? Or possibly collapse, like its neighbors Larsen A and B? Will the glaciers behind the ice shelf accelerate and have a direct contribution to sea level rise? Or is this just a normal calving event?”
Ice shelves fringe 75 percent of the Antarctic ice sheet. One way to assess the health of ice sheets is to look at their balance: when an ice sheet is in balance, the ice gained through snowfall equals the ice lost through melting and iceberg calving. Even relatively large calving events, where tabular ice chunks the size of Manhattan or bigger calve from the seaward front of the shelf, can be considered normal if the ice sheet is in overall balance. But sometimes ice sheets destabilize, either through the loss of a particularly big iceberg or through disintegration of an ice shelf, such as that of the Larsen A Ice Shelf in 1995 and the Larsen B Ice Shelf in 2002. When floating ice shelves disintegrate, they reduce the resistance to glacial flow and thus allow the grounded glaciers they were buttressing to significantly dump more ice into the ocean, raising sea levels.
Scientists have monitored the progression of the rift throughout the last year was using data from the European Space Agency Sentinel-1 satellites and thermal imagery from NASA’s Landsat 8 spacecraft. Over the next months and years, researchers will monitor the response of Larsen C, and the glaciers that flow into it, through the use of satellite imagery, airborne surveys, automated geophysical instruments and associated field work.
In the case of this rift, scientists were worried about the possible loss of a pinning point that helped keep Larsen C stable. In a shallow part of the sea floor underneath the ice shelf, a bedrock protrusion, named the Bawden Ice Rise, has served as an anchor point for the floating shelf for many decades. Ultimately, the rift stopped short of separating from the protrusion.
“The remaining 90 percent of the ice shelf continues to be held in place by two pinning points: the Bawden Ice Rise to the north of the rift and the Gipps Ice Rise to the south,” said Chris Shuman, a glaciologist with Goddard and the University of Maryland at Baltimore County. “So I just don’t see any near-term signs that this calving event is going to lead to the collapse of the Larsen C ice shelf. But we will be watching closely for signs of further changes across the area.”
The first available images of Larsen C are airborne photographs from the 1960s and an image from a US satellite captured in 1963. The rift that has produced the new iceberg was already identifiable in those pictures, along with a dozen other fractures. The crack remained dormant for decades, stuck in a section of the ice shelf called a suture zone, an area where glaciers flowing into the ice shelf come together. Suture zones are complex and more heterogeneous than the rest of the ice shelf, containing ice with different properties and mechanical strengths, and therefore play an important role in controlling the rate at which rifts grow. In 2014, however, this particular crack started to rapidly grow and traverse the suture zones, leaving scientists perplexed.
“We don’t currently know what changed in 2014 that allowed this rift to push through the suture zone and propagate into the main body of the ice shelf,” said Dan McGrath, a glaciologist at Colorado State University who has been studying the Larsen C ice shelf since 2008.
McGrath said the growth of the crack, given our current understanding, is not directly linked to climate change.
“The Antarctic Peninsula has been one of the fastest warming places on the planet throughout the latter half of the 20th century. This warming has driven really profound environmental changes, including the collapse of Larsen A and B,” McGrath said. “But with the rift on Larsen C, we haven’t made a direct connection with the warming climate. Still, there are definitely mechanisms by which this rift could be linked to climate change, most notably through warmer ocean waters eating away at the base of the shelf.”
While the crack was growing, scientists had a hard time predicting when the nascent iceberg would break away. It’s difficult because there are not enough measurements available on either the forces acting on the rift or the composition of the ice shelf. Further, other poorly observed external factors, such as temperatures, winds, waves and ocean currents, might play an important role in rift growth. Still, this event has provided an important opportunity for researchers to study how ice shelves fracture, with important implications for other ice shelves.


The U.S. National Ice Center will monitor the trajectory of the new iceberg, which is likely to be named A-68. The currents around Antarctica generally dictate the path that the icebergs follow. In this case, the new berg is likely to follow a similar path to the icebergs produced by the collapse of Larsen B: north along the coast of the Peninsula, then northeast into the South Atlantic.
“It’s very unlikely it will cause any trouble for navigation,” Brunt said.
###
Thanks Anthony. Agreed.
These days, the only icebergs you should worry about come with little umbrellas.
Can this iceberg save the world?
At the very least, it will be good for Southern Ocean fish stocks.
http://russgeorge.net/2017/07/06/can-the-giant-antarctic-iceberg-save-the-world/
And what exactly would happen if the Ice didn’t break off and eventually float away to warmer waters and melt?
The ice would spread to South America and Global circum navigation would only happen through the Panama Canal.
Bright sides:
The crack has stopped!
The Ice is still there!
The new Berg hasn’t traveled more than 300′!
Sea levels didn’t rise because of it!
Sea levals won’t rise because of it!
Bryan A- I think maybe the the ice should have calved in smaller bergs but cooler temps and snowfall kept that from happening. The glaciers will most likely speed up from the increased snowpack of the recent 5 year period. The ice which is floating at the end of the glacier does not slow down it’s flow, so how could calving do anything but expose a new area to the surf?
What do they mean, “it will have no IMMEDIATE IMPACT on sea levels”/ It will NEVER have any impact on sea levels! Idiots!
Until the berg travels a certain distance from the sheet, the surf will have no effect on the remainder shelf
I saw this remarkably good article on this topic from the BBC, no sign of the usual cries of impending doom:
http://www.bbc.com/news/science-environment-40321674
Most people have ‘chilled’ on this one as the realisation finally sinks in following the misplaced hysterics of Larsen A and B that ice shelves do that. That is to say they are transient features. That isn’t going to stop the usual crazies in the MSM from gibbering like idiots though. Encouraging that the beeb have decided to drop the hysterics for once though and perhaps it’s a sign of them beginning to hedge their bets.
They have been hedging their bets for some time now. I watched a BBC programme say two years back on a French town which was suffering badly from the wind farm near it, which powered another village. The Beeb was actually open to the idea that these were real agonies rather than Big Coal/Carbon funded imaginary agonies.
Maybe no cry of impending doom, but I find this of interest from the article. In 1956, it was reported that a US Navy icebreaker had encountered an object of roughly 32,000 sq km. That is bigger than Belgium. Unfortunately, there were no satellites at the time to follow up and verify the observation. In other words, because it doesn’t fit the AGW theme, the word of an icebreaker captain isn’t to be taken seriously.
Yes, on BBC News, Amos played down “global warming” as a cause, despite being given every opportunity to say it was.
Here is a newspaper saying that the NAVY ICEBREAKER saw the massive Iceberg, thus it did exist and was massive.
Somehow the planet didn’t notice it enough to spawn something really bad.
https://realclimatescience.com/2017/07/1956-iceberg-was-the-size-of-massachusetts-and-connecticut-combined/#comment-55456
Yes, on BBC
Even the BBC World Service, usually Global Warming Central, only broadcast a scientist who said it was just business as usual. They’re so obsessed with finding Trump guilty of something, maybe they’ve taken their eye off the climate ball.
I heard that on BBC World News, as well. I think they asked an ‘expert’ who wasn’t going to be pushed into saying anything she didn’t agree with. Very refreshing. You don’t remember her name, by chance?
The article is by BBC Science Correspondent Jonathan Amos who tends to be considerably less hyperbolic than his BBC colleagues Harrabin and McGrath. It is worth quoting one passage.
Extreme environmentalists believe that the earth was static and perfect prior to the arrival of man.
Any change must be caused by man and is by definition bad.
What you say it true. I suppose the next thing is that they’ll say everything about the Earth, especially the climate, was perfect until Adam and Eve hopped into their Ford F-350 diesel pickup and fled the Garden of Eden. Oh wait, that sounds a bit religious and the only religion the environazis believe in is Marxism.
Somewhere out there are two people named Adam and Eve who own an F-350 diesel. I just want you to be aware of that.
I thought gawd drove them out in his Fury?
one of the biggest ever recorded….face palm
Even their animation shows it moving….
And not the largest one, either.
No….they are supposed to keep growing until they take over the world…… /snark
What is really amazing is that it got as big as it did….
1. Great title, Anthony.
2. Re:
“Climate change” (defined in the common parlance as: “a human CO2/other emissions-caused, significant, shift in the climate zones of the earth”) has not been proven (nor has even significant-shift “climate change” from ANY cause been proven so far), so, talking about “links” to it is like talking about whether the White Rabbit’s hole leads to Wonderland or not.
3. Good to hear from you from “somewhere in the Pacific,” Anthony, but, don’t do it again! Enjoy that vacation. 🙂
I would say that it will probably have an effect on it’s own local climate. So, really, it is climate change not caused by climate change! Wrap your noggin around that!
A lot of fuss about nothing.
Top up your G&T Anthony, the ice is arriving for it momentarily 🙂
No its not, the ice is all melting…according to Prof Wadams & 97% of all ex-spurts (:-))
I posted this quote previously:
Trying to spin it into anything else than business as usual is just displaying ignorance. In the climate wars that’s standard operating practice. I haven’t been able to find a cite but I remember that Bill Clinton joked that Al Gore would use the fact that the sun comes up in the morning as proof of global warming.
Well than I guess that is just par for the course regarding Greenpeace! In a clearly biased online article on news.com.au, in the lead paragraphs Greenpeace spewed their usual pithy stuff saying once again this should be taken as the “Canary in Coalmine” for Antarctica, justification to cap emissions NOW to prevent the usual litany of bad things befalling mankind.
Sadly the “business as usual” quotes, were cleverly shuffled toward the end of the article where they were most likely not read.
AussieBear.
Isn’t the ice shelf in fact a glacier that has slid out onto the sea? As such, isn’t it expected that it will continue to expand more or less continuously, and thus be EXPECTED to calve off on occasion? Sounds like making a headline over the sun coming up in the morning to me.
The following has some issues, but otherwise is informative.
https://nsidc.org/cryosphere/quickfacts/iceshelves.html
shoosh, MDN, you are not supposed to say that, because the climate zealots depend on our ignorance for their livelihoods.
The only thing that surprises me is that we don’t see more such breakages. The sea ice is always growing, if fed from land glaciers, and they can’t grow forever. There are tides and winds and currents always at odds with the fixed ice. It’s pretty amazing they last as long as they do.
“The largest amplitudes occur beneath the Ronne-Filchner Ice Shelf, where the tide amplitude reaches 30 centimeters. In that location, the difference between high and low tide would be 60 centimeters (about 2 feet). These values represent the average tidal changes over a large area. At individual locations, the tide variation may be even more extreme. Even though Antarctic ice shelves can be up to about 1.6 kilometers (1 mile) thick in places, tides can lift these shelves as much as 4.5 meters (about 15 feet).”
So, twice a day these ice shelves are flexed by the tides, up and down, the inflection point being that point at which the ice is grounded.
https://earthobservatory.nasa.gov/IOTD/view.php?id=6110
But amid all the trumpets of doom is a remarkably restrained report from the BBC, notable for NOT predicting the end of the world. Note the author, which probably explains the unusually calm tone: I guess the hysterical (no, I don’t mean funny) Matt McGrath must be on holiday.
Giant iceberg splits from Antarctic – http://www.bbc.co.uk/news/science-environment-40321674
Just a hunch but beginning to suspect that the beeb are actually smart enough to know that they are currently orbiting the bowl along with CNN and the rest of the fake news media – while Trump continues to pump the flush handle. The general public are growing ever more hostile to them and calls for an end to the license fee funding are mounting fast. Seems to me that the zeitgeist is shifting in favour of a return to a more impartial and less hysterical reporting style. Well, we can hope anyway.
I listened to BBC International on shortwave for many years and it always saddened and angered me that they had such a leftist bent in so much of their reporting, and it got much worse in late ’90s.
In a totally unrelated aside, I keep seeing your screen name and wonder, do you leave the “Bo” off the front to not confuse people? Just kidding.
That this is happening at the height of summer is proof enough for me that this connected to global warming. Think of the poor polar bears!
YES!, It’s a plot by the penguins to invade the Arctic and reclaim it from the Ursine Oppressors.
Just another case of Climate Change forced immigration. The poor refugees…
(need I add the sarc)
NH Summer…
Probably about twenty years ago there was a calving which extended from Wanganui to Wellington(New Zealand) in Length and would not have fitted through the Cook Straight in width. So what is new?
Anthony, most people would just send a post card.
Its the Electronic Age, he did.
Postcards are supposed to have a girl in a grass skirt!
“Postcards are supposed to have a girl in a grass skirt!”
Here you go –
OK! Now we are cooking with gas!
Isn’t the young lady in 1saveenergy’s postcard a bit lightly dressed for Antarctica?
The International Geophysical Year (IGY) 1957-1958 kicked off modern polar science…

The 5,800 sq km calved iceberg is about 12% of the Larsen C ice shelf (50,000 sq km).
The Antarctic ice sheets cover 14,000,000 sq km. 5,800 sq km is 0.04% of 14,000,000 sq km… Instead of using Delaware, Manhattan or multiples of Rhode Island and Luxembourg to “illustrate the size of the iceberg.” Why can’t they just use the map of Antarctica clearly demonstrates the size of the iceberg?
And this iceberg is only half as big as the “world record”…
http://www.cnn.com/2017/07/12/world/larsen-c-antarctica/index.html
Or to put another way, it is miniscule in comparison with the totallity of Antarctica.
Yep… Hence the reference to multiples of Luxembourg and Rhode Island.
I’ll get mildly interested when they start talking about multiples of Texas.
I may have missed it, but I don’t recall this being in the CNN article yesterday…
I even commented that I was surprised how reasonable the article was. CNN’s editors must have realized that they forgot to employ the standard tactic of getting a “scientist” not involved in the study/paper/project to babble some alarmist nonsense.
Time to hit the snooze button.
There was apparently one in 1956 from the Ross Glacier that was MUCH bigger.
And evidence of even larger ones back in the 1920’s
These are Glaciers.. RIVERS of ice..
Of course they eventually “flow” into the oceans.
link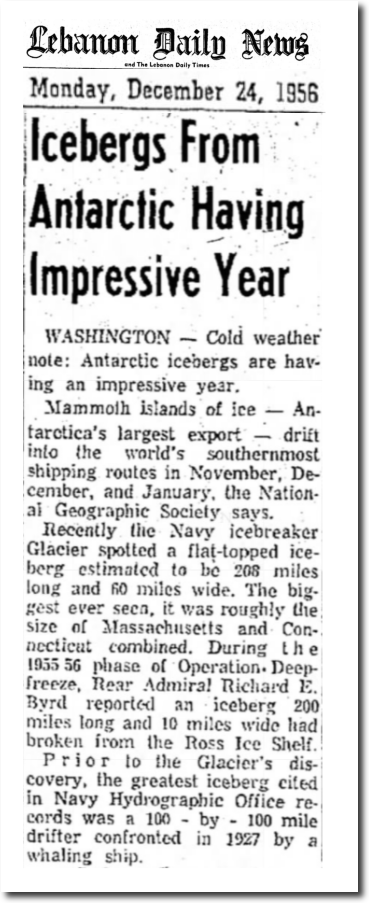
If you tell a reporter that crack’s been slowly widening since 1960, you’ll get a blank stare, but try it anyway. It’s loads of fun to confound them.
I did hear one news report that it would add 200 feet to ocean levels and started laughing. That wasn’t repeated.
Is this former glacier, now a berg, going to follow the circum-navigation route around Antarctica now? Or is it going to break up into little bergs instead? Just askin’.
Wow that’s a bit of a stretch. If it came from a continental source rather than a floating one that mass of ice would account for 2.8 mm or 0.1″ of sea level rise.
” it would add 200 feet to ocean level”
I think that was referring to the WHOLE of the Antarctic.
Not much likely to happen in that regard.
These dolts are forgetting that rivers FLOW into the sea !!!
Glaciers just do it rather more slowly.
“Is this former glacier, now a berg, going to follow the circum-navigation route around Antarctica now? Or is it going to break up into little bergs instead?” – the answer is “yes” ;->
When I was down there a year and a half ago, there was still a pretty big piece of B15 caught in the Weddell Gyre (IIRC, called B15K2). I would guess, based on its location, a similar future: breaking up into smaller (but still huge) tabular bergs, one by one being sent out the Antarctic Sound (iceberg-alley) into the South Atlantic, a process that could take not just years but possibly decades.
Pretty sure you meant “half-century” ago…
“Twice the size of Luxembourg!”
… playing on the lack of geographic knowledge of most folks in the U.S., I drove across the quaint Duchy in under 30 minutes last year, including stops at the Belgium and German borders. This is not “as big as Montana” type of stuff.
It’s like catching a fish and declaring it to be longer than 100 mm.
That is in the link to the Guardian. Being a British paper they should know that things like this are measured in the size of Wales!
https://en.wikipedia.org/wiki/List_of_unusual_units_of_measurement#Wales
Nothing compared to Antarctica Scott Island’s 1956 iceberg measured by USS Glacier on November 12, 1956 at 335 km X 97 km or 31,000 km2…
But our media always obfuscate that one…
You state that there were no antartic scientists 50 years ago. The polar research ship RRS Discovery entered the Antartic ice floes in January 1902. That makes it just over a 115 years of Antarctic scientific research. She continued with polar research and exploration until 1931. Get your facts right.
Ref The Voyages of the Discovery by Ann Savours. ISBN 0-86369-811-5
Antarctic scientist is the oldest profession.
Antarctic scientist is the (c)oldest profession.
Hmm… they are some tough breeds down there though. Miss the last return flight and you might have to remove your own appendix.
It’s the missing brains they should be worried about.
I don’t know if this was directed at my comment; but I posted:
I never stated “that there were no antartic scientists 50 years ago.”
The IGY…
https://en.wikipedia.org/wiki/International_Geophysical_Year
Most of the long-record Antarctic temperature records begin during or just after the IGY.
The IGY was to modern polar science, what Hansen’s Al Gore-inspired congressional testimony was to modern climate “science”… The kick off point to a new era… Good in the case of the IGY… Bad in the case of Gorebal Warming.
The U.S. put out a beautiful stamp to commemorate the 57-58 IGY. It is a
bit of stand-out graphics compared to the wall paper stamps that came out
that year:
Also, that was the only year I got to see the Northern Lights from our
little area in northeast Ohio.
Scott and Shackleton set up a research base in McMurdo in 1902
I was 10 years old and living in Buenos Aires when Dr. Maurice Ewing brought the Columbia U. research schooner Vema into port. I was lucky enough to meet him and get a tour of that marvelous three-masted ship. He had some good stories about his and his ship’s participation in the I.G.Y.
A legend in geophysics!
http://wiki.seg.org/wiki/Maurice_Ewing_Medal
He didn’t state that no scientists ever studied the Antarctic, but that that no one had Antarcitica as their primary field of study. The ship entered and left, usually returning with different scientists. These scientists stay, studying Antarctica as a full-time profession, something that no one did until 50 years ago.
Or more to the point that easily obtained research grants allowing a broader range of Polar research under the umbrella of Global Warming/Climate Change became more readily available.
The ship spent from 1902
2 years there fast to the ice , a shore base was established which still exists and is a national monument
So one data point in 1902 and another in 1957. Enough for a trend even…
Just to be clear, that’s 21 million Titanics. How many Manhattans I’m not sure. Melting it though, could suck a whole bunch of hiroshimas worth of energy out of the ocean. These are all important scientific values!
I wonder how many olympic sized swimming pools it is.
2 Manhattans is usually my limit. Depends somewhat on the meal that went before it.
As long as you’re not 3 sheets to the wind you’re ok.
Depends on what kind of Manhattan you’re talking about. I prefer Rob Roys, myself.
I don’t think “a whole bunch” is proper scientific terminology. Even for “unconventional scientific units”.
At Carnegie-Mellon Univ, we experiment with the unit, the melon. It was about the size, or length, or weight of a melon (your choice, but maybe not watermelons) (unless you saw the experimental film “Oh, Dem Watermelons in freshman orientation)
The key feature of melons was that they could only be described to 1.5 significant units (1 to 19). Okay, maybe up to 31 or so.
Good for approximations, good for mental math, and also good eating.
I don’t know how many olympic pools, but because I visualize these things better if I figure the size of an equivalent cube, I found that the trillion tonnes of ice would make an ice cube roughly 10 kilometers on a side.
Now I need to find a reeeeeeally big bottle of rye whiskey.
here is a list of really important standards for you.
https://www.theregister.co.uk/Design/page/reg-standards-converter.html
Hi Anthony, good article, hope you are on the mend. The media dare not unduly blame AGW for this, it was well known for years that this event would happen due to geological activity melting the ice under the ice sheet undermining it significantly. The fact that this has happened in the Antarctic winter would make anyone with intelligence realise that CO2 was not to blame.
Circumpolar current will take the iceberg on a journey. There is 4 year temperature (2-3 degrees C warmer) /atmospheric pressure double cycle (circumpolar wave) surrounding the pole. Melting of huge lump of ice will cool both sea surface as well as atmosphere above; depending on its velocity and the current location of the waves’s peaks and troughs some disruption to the local climate patterns is likely.
http://www.parks.tas.gov.au/fahan_mi_shipwrecks/infohut/images/acw2.jpg
The should tow it to cape town. REAL fresh water shortage there
I was thinking if it were towed to South Padre Island we could pump the melt water to various depleted aquifers in Texas and the midwest. Seriously.
Or to Bermuda:
http://bernews.com/2017/06/new-measures-in-place-to-conserve-water/
I’m having a sceptical attack here. On the scale of the circumpolar current the berg will be a tiny hardly visible flake. Is that really going to impact local climates?
“I’m having a sceptical attack here.”
and rightly so, since I have no particular knowledge of might or might not happen.
Considering that 90% of the volume is under the surface, when it melts it turns into fresh water which is much lighter than cold saline ocean, and they do not mix well. To exaggerate a bit ‘it might spread to about like a giant oil slick about 20 or more times of the present area size’.
I’m just making a speculative comment hoping to entice a more educated opinion on the matter.
Local weather, maybe, for a few years – in the Falklands and Tierra del Fuego (plus the ocean areas in the vicinity). My WAG on significant weather effects is probably two to three hundred kilometers from the edges.
Observer, sort of thing I was having in mind, but I didn’t express myself terribly well.
The berg is probably just about 32F right through the submerged part. The temperature of the waters surrounding Antarctica is very nearly the same. It will take a looooong time to melt, during which airborne moisture will condense and freeze and fall on Antartica and there will be virtually no effect on temperatures anywhere.
I see someone below has pipped me to the post, but I was expecting much hysteria on reading about this and so decided to do some quick algebra to see how long it might take to melt, or at least, how much energy it would require to melt it. I may well have miscalculated too so please critique:
The ice is glibly quoted as being a trillion tonnes.
So mass, m = That’s 1e15 kg.
The specific heat capacity of ice c = 2.108 kJ/kg K.
If we assume it’s roughly at -10C, to melt it has to get it’s temp raised to 0C, so delta T = 10K.
The amount of heat energy Q = mct = 2.11e16 kJ. (A)
We then have to melt the ice. The latent heat (L) of fusion of ice is 334 kJ/kg.
Q = Lm = 3.34e17 kJ (B)
Having melted it, we can work out how much heat warming the water from 0 to 3 C would take, again using Q =mct where t is now 3K = 1.26E16 kJ. (C)
So total energy is (A)+(B)+(C) = 3.68E17 kJ.
That sounds like a lot, so lets think about how we melt it.
I assumed all the energy would come from the sun. I was interested in the amount of heat that melting this berg would take out of the climate system and it seemed logical to consider that against what the sun puts in.
So I decided to look up how much energy from the sun reaches the earths surface at Antarctic latitudes and use that value to figure out how many years it would take to melt.
I found a nice global map of annual mean insolation that indicated a typical average annual roaring 40s insolation would be around 200 W/m2. Antarctica is more like 80, but I chose to use 200 in the calculations. I should add I assume average annual insolation means that 200W/m2 can be assumed to be incident on that m2 for 24 hours of the day, every day of the year. Hence it’s a lot lower than the ~1360 W/m2 I was more familiar with (which is also Top of Atmosphere, not surface, and based on the Earth being a disk, not a sphere).
Using the definition of a Watt as a Joule per second, we get 6.31E6 kJ per year for each m2 of surface or 17,280 kJ/m2 per day.
The surface area of the berg is stated as 5,800km2. So it would take just over 3,600 days (or a bit over 10 years) to melt and then warm its resultant water to 3C. At the 80 W/m2 that is realistic for Antarctica, it would be more like 25 years.
If you could somehow concentrate all the incident energy that the Earth receives from the sun, you could melt it in 48 minutes, but that’s the sort of creative accounting that people invested in renewables use!
Dixon,
Good write-up. The only thing I would add is that surface melting will be accelerated as baroclinic storms come along & rain falls on the berg. Flowing water across the whole surface will melt ice faster than sunshine on a chilly day.
Thanks JKRob – yes good point, lots of heat transfer from water – whether rain, or sea.
That’s a possible explanation for accounts of shipwrecked sailors, adrift at sea, who were saved from dehydration by encountering an “oasis” of fresh water in the middle of the ocean. Those may well have been slicks of recent iceberg melt.
Dixon thanks for the calculation.
Now we know where icebergs come from. What would we do without such expert scientists?
“Just because we can see changes happening on the most remote region of our planet in exquisite detail for the first time in the history of mankind doesn’t necessarily mean those changes are unprecedented.”
This kind of thing always brings me to the analogy of giving a hypochondriac a combined CT/PET/MRI diagnostic radiology suite to play with. The prognosis is always going to be poor.
Compare this event to past events that did not receive the media doomsday hype.
The Larsen C iceberg that just calved is
” close to 2,240 square-mile (5,800 square kilometers) chunk of ice has broken away, the Larsen C shelf area has shrunk by approximately 10 percent.”
The less hyped October 1987 B-9 event along the Ross Sea Ice Shelf calved a similar sized berg followed by rapid increase in the ice shelf growth.
From Keys (1998) Continued northward expansion of the Ross Ice Shelf, Antarctica
“The B-9 event “removed ~5100 km2 of ice, about 100 years of advance in that sector, but reduced the ice-shelf area by only 1%.
Since 1987 the entire ice front has continued to advance, more than regaining the area lost during the B-9 event. The western front is now well north of any position recorded during the last 150 years, and it has not experienced major calving for at least 90 years.”