UAH Global Temperature Update for June, 2017: +0.21 deg. C
by Roy W. Spencer, Ph. D.
Lowest global temperature anomaly in last 2 years (since July, 2015)
The Version 6.0 global average lower tropospheric temperature (LT) anomaly for June, 2017 was +0.21 deg. C, down from the May, 2017 value of +0.44 deg. C (click for full size version):

Global area-averaged lower tropospheric temperature anomalies (departures from 30-year calendar monthly means, 1981-2010). The 13-month centered average is meant to give an indication of the lower frequency variations in the data; the choice of 13 months is somewhat arbitrary… an odd number of months allows centered plotting on months with no time lag between the two plotted time series. The inclusion of two of the same calendar months on the ends of the 13 month averaging period causes no issues with interpretation because the seasonal temperature cycle has been removed as has the distinction between calendar months.
The global, hemispheric, and tropical LT anomalies from the 30-year (1981-2010) average for the last 18 months are:
YEAR MO GLOBE NHEM. SHEM. TROPICS
2016 01 +0.55 +0.73 +0.38 +0.84
2016 02 +0.86 +1.19 +0.52 +0.99
2016 03 +0.76 +0.99 +0.54 +1.10
2016 04 +0.72 +0.86 +0.58 +0.93
2016 05 +0.53 +0.61 +0.45 +0.71
2016 06 +0.32 +0.47 +0.17 +0.38
2016 07 +0.37 +0.43 +0.30 +0.48
2016 08 +0.43 +0.53 +0.32 +0.50
2016 09 +0.45 +0.50 +0.39 +0.38
2016 10 +0.42 +0.42 +0.41 +0.46
2016 11 +0.46 +0.43 +0.49 +0.36
2016 12 +0.26 +0.26 +0.27 +0.23
2017 01 +0.33 +0.32 +0.33 +0.09
2017 02 +0.39 +0.58 +0.19 +0.07
2017 03 +0.23 +0.37 +0.09 +0.06
2017 04 +0.27 +0.29 +0.26 +0.22
2017 05 +0.44 +0.39 +0.49 +0.41
2017 06 +0.21 +0.32 +0.09 +0.39
NOTE: We have added the Metop-B satellite to the processing stream, with data since mid-2013. The Metop-B satellite has its orbit actively maintained, so the AMSU data from it does not require corrections from orbit decay or diurnal drift. As a result of adding this satellite, most of the monthly anomalies since mid-2013 have changed, by typically a few hundredths of a degree C. The 1979-2017 linear trend remains at +0.12 C/decade.
The UAH LT global anomaly image for June, 2017 should be available in the next few days here.
The new Version 6 files should also be updated in the coming days, and are located here:
Lower Troposphere: http://vortex.nsstc.uah.edu/data/msu/v6.0/tlt/uahncdc_lt_6.0.txt
Mid-Troposphere:http://vortex.nsstc.uah.edu/data/msu/v6.0/tmt/uahncdc_mt_6.0.txt
Tropopause:http://vortex.nsstc.uah.edu/data/msu/v6.0/ttp/uahncdc_tp_6.0.txt
Lower Stratosphere: http://vortex.nsstc.uah.edu/data/msu/v6.0/tls/uahncdc_ls_6.0.txt
but what does RSS say?
Nice try. This article is about what RWS says.
The RSS folk released this FAQ about the change. The issue came up because different satellites were returning conflicting measurements. Obviously something was wrong. Because satellites work from models (they do not directly measure temperature from space!) they had to check the models against two new satellites that don’t need adjustment between diurnal cycles. This is their FAQ. I expect we will see an adjustment from UAH about this soon as the newer satellites are incorporated.
http://www.remss.com/blog/faq-about-v40-tlt-update
jai mitchell July 4, 2017 at 12:39 pm
Because satellites work from models (they do not directly measure temperature from space!)
—-
Nothing directly measures temperature — mercury thermometers measure changes in volume, electric thermometers measure changes in resistance, etc,
I don’t think you really understand what you are commenting on.
Are you aware that, in the past, Mears said the RSS data was rubbish. Why would you trust or believe anything that he says?
Before or after the “special adjustments” ?
RSS before and after:
http://www.climate4you.com/images/MSU%20RSS%20GlobalMonthlyTempSince1979%20With37monthRunningAverage%20With201505Reference.gif
That’s not the version that appears on this page:
http://www.climate4you.com/GlobalTemperatures.htm#Recent%20global%20satellite%20temperature
RSS has succumbed to fudging the satellite temperature data to make it compatible with the IPCC CO2 mantra. RSS finally decided to follow others who have been fudging the surface instrument temperature data. Remember the following news?
Mervyn July 4, 2017 at 7:24 am
RSS has succumbed to fudging the satellite temperature data to make it compatible with the IPCC CO2 mantra. RSS finally decided to follow others who have been fudging the surface instrument temperature data.
Same ‘fudges’ as UAH, added the same new satellites, adjusted for the same orbit drift etc., unlike UAH though they produced the same product while UAH came up with a new product covering a different altitude range.
??????????
Griffy???
You do not have RSS bookmarked yet?
Here.
http://images.remss.com/msu/msu_time_series.html
*sigh*
Glued to it, Tony… rhetorical question…
Especially as they correct the UAH figures…
https://www.theguardian.com/environment/climate-consensus-97-per-cent/2017/jul/03/bad-news-for-climate-contrarians-the-best-data-we-have-just-got-hotter
What is shameful is RSS’ joining the Borg collective.
To the river! Join the herd!
Griff, RSS 3.3 and RSS 4.0 both show the lowest estimated TLT anomaly since July 2015, just like the UAH TLT v6.
but RSS is adjusted! and in line with surface temp measurements…
“but RSS is manipulated! and in line with manipulated surface temp measurements…” There, fixed it for you.
“but RSS is adjusted! and in line with surface temp measurements…”
That’s not true. RSS, even after adjustments, still shows 1998 as the second hottest year on its chart, second only to 2016. The surface temperature charts downgraded 1998 to an also-ran.
Mears has a ways to go to bastardize the RSS chart as much as has been done to the surface temperature charts.
Me, I’ll stick with the UAH chart.
The RSS was adjusted TO bring it inline with the previously Adjusted Surface Record
It’s been adjusted to bring it in line with the thoroughly cooked ground data.
The temperatures adjusted by models? Whatever the models say, which as even you must understand, means as adjusted by something which we can not verify.
Of course your comment shows you don’t udnerstand what that means, but you can’t have everything.
“but what does RSS say?”
RSS/Mears says people who frequent WUWT are denialists.
I think Mears using that description says a whole lot about where he stands on the issue. He’s definitely in the alarmist camp.
So what he says is suspect.
What is interesting is the addition of the Metop-B satellite. It does not need correction for diurnal drift. Note that it only changed the results by a few hundredths of a degree. RSS correction is supposedly to correct for diurnal drift and their result increased by 140%.
Not much else needs to be said. Obviously, RSS got it wrong and most likely know they got it wrong. No need to quote their results any longer. Trump should discontinue their funding ASAP.
Last month RSS said we could trust them.
This month RSS says they were off by 140% last month and we can trust them.
You can’t make this stuff up.
Babe Ruth hit 50 HR’s in his best year. You can trust me.
I mean Babe Ruth hit 55 HR’s in his best year. You can trust me.
I’ll get back to you in another month, and you can trust me then too.
Hmmm. And how much did UAH change going to 6.0? Guess you can’t trust them either.
Richard M July 4, 2017 at 11:35 am
What is interesting is the addition of the Metop-B satellite. It does not need correction for diurnal drift. Note that it only changed the results by a few hundredths of a degree. RSS correction is supposedly to correct for diurnal drift and their result increased by 140%.
UAH’s correction was also to correct for diurnal drift (of the same satellites as RSS), they also added the same two satellites as RSS, NOAA-19 and METOP-B.
Not much else needs to be said. Obviously, RSS got it wrong and most likely know they got it wrong.
Both UAH and RSS needed to make changes because of the drift of the satellite orbits.
Griff,
This is real data from a reliable source that also captured the El Nino temperatures.
Your comment confirms that you will ignore real data for whatever reason and therefore, have no credibility on this site on the subject of global temperatures.
It’s because he is, in his own words, “glued to RSS”…so he either has no desire, or lacks the ability, to consider ALL of the available data objectively in a scientific manner.
Ask Gavin.
RSS adjustments. Gavin would be PROUD 😉
He’s quite obviously both proud and satisfied. Mears/Wentz have done well:
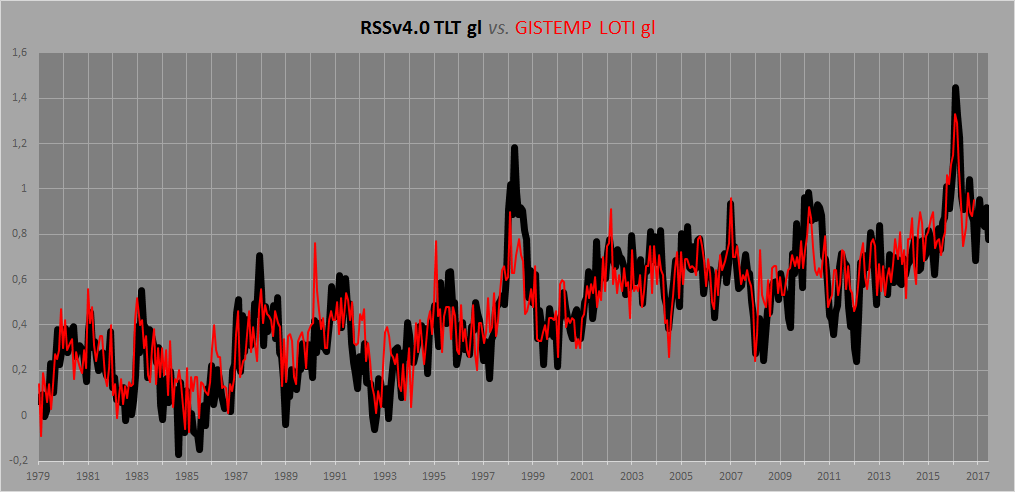
Here (from here) is a plot of RSS V3.3 and V4, UAH V5.6 and V6, with the combined mean subtracted to show relative changes, and 12 month smoothing. Basically, UAH5.6 has become RSS V4 and vice versa.
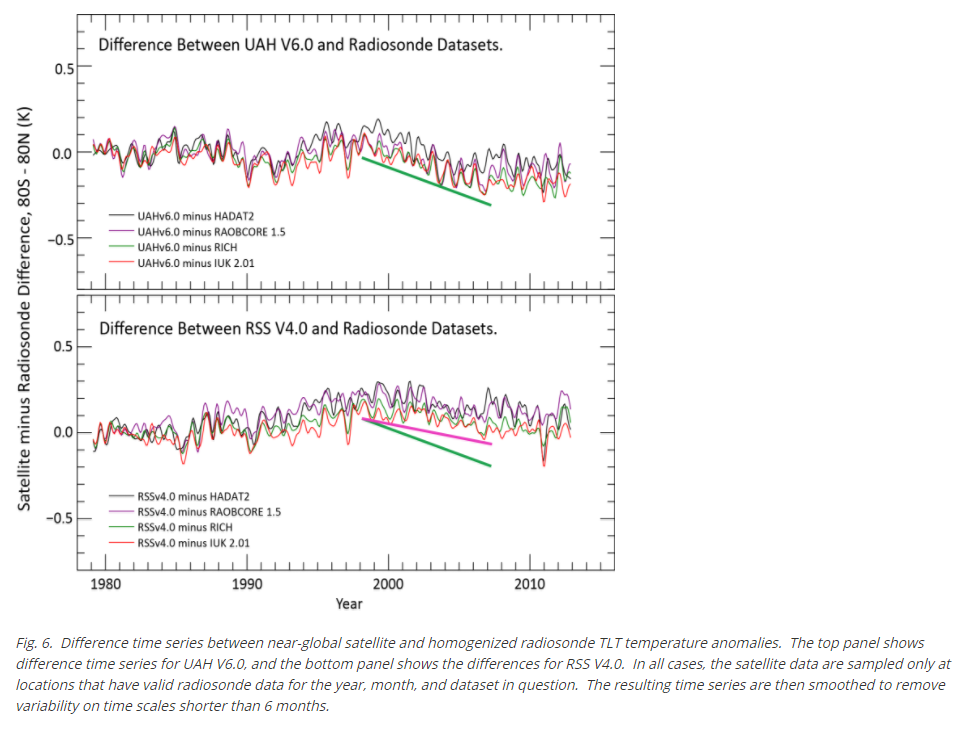
And here is the comparison with Radiosondes, from the RSS FAQ:
Radiosondes have been warming faster than both RSS and UAH, but RSS is closer.
Nick Stokes July 4, 2017 at 6:13 pm
Here (from here) is a plot of RSS
—-
Mears himself said that the RSS data was not accurate and should not be used or trusted. Now he says the exact opposite. LOL!
You would have to be a fool. incredibly naive, or on the take (politically or monetarily) to believe or support anything this man says.
“Mears himself said that the RSS data was not accurate and should not be used or trusted.”
He cautioned about the use of V3.3 when they realised that the diurnal drift wasn’t properly corrected. Folks here went on using it, however, because it supported their narrative. Now they have fixed that, but the results are less appealing, then it is rejected.
RSS fell May/June, but the fall was less pronounced than in UAH. May be because RSS doesn’t have as good coverage of Antarctica, which was very cold in June: http://images.remss.com/msu/msu_time_series.html
What makes me laugh, sometimes, is the speed at which the SkS Warrior of Day sends a trolling one-liner as the first comment to the thread. It is as if they’d be assigned shifts to wait for an update.
But, yeah, RSS says ‘oops, made a mistake‘. And adjusts its results so that UAH and RSS are no longer in good sync. I’m not saying there’s some misconduct, rather what I see is the classical confirmation bias. ‘I kept digging and digging, an eventually I found something that brought my results in line with Gavin. And that is when I stopped digging.’
The climate’s been changed.
Big surprise.
It changes constantly, pointing this out to leftarded science deniers makes them rather cross. You already know this, so, yea.
Wait, we just have to modify the data statistically a bit more to get the temperature we need.
Speaking of adjustments, June was 0.21C, said to be coldest for 2 years. March , when reported here at WUWT, was 0.19C. It has been adjusted since.
The real point there is that, apart from an uptick in May, the UAH temperature really hasn’t changed much this year.
March, when reported here at WUWT, was noted as “preliminary.” It was in the 2nd line and in bold print.
“March, when reported here at WUWT, was noted as “preliminary.””
It was still 0.19C a month later. No mention of preliminary there.
Temp has not changed much over the last 1000 years
Man BP,
A thousand years ago, the Medieval Warm Period was ~1.0 degree C warmer than now, as nearly as such a monster as GASTA can be reconstructed. But 320 years ago, during the Little Ice Age, earth was 1.0 degree or more cooler than now.
Granted, that’s not much change, but for 3000 to 5000 years, the planet has been cooling, which isn’t a good sign.
The Holocene Climate Optimum, ~5000 years ago, was ~3.0 degrees C warmer than now. The Minoan Warm Period, ~3000 years ago, was also some 3.0 degrees warmer, and the Roman Warm Period, ~2000 years ago, ~2.0 degrees warmer than now.
The alleged 1.0 degree C warming since c. AD 1850, the end of the LIA, is bogus. It was at least as warm in the 1930s as now. So it was warmer than now 1000 years ago, colder than now 320 and 160 years ago, but not necessarily than 80 years ago.
Gabro: ” It was at least as warm in the 1930s as now.” ….What is your data source/citation for this assertion?
Michael.
The best historical temperature data available, the USHCN temperature data series. And observations elsewhere.
https://climateaudit.org/2007/02/16/adjusting-ushcn-history/
As for the Medieval WP and LIA, look no farther than the first IPCC report:
Will the anomalies get back to the -0.2 and -0.3 level the way they were last century?
Or did the 98 El Nino kick us up to a higher climate state?
With the solar minimums, a return to the -0.2 reading would really put a crunch in the warmist fantasies.
There have been -0.2 degree C anomaly readings for months in this century. The last one was in 2012.
The red line, I would like to see the 13 month moving average hit -0.2 or -0.3 again.
That would choke the warmist alamism.
J,
If it even returns to -0.1, as earlier in this century, CACA advocates would have a lot of ‘splainin’ to do.
It appears that the lowest monthly anomaly of this century (since 2001) was -0.26 in May 2008.
Dunno if the revised series thanks to the new satellite has changed that.
It stands to reason that at some point another large volcano will erupt.
Yes, we are on the cusp of what? The dynamics involve the interacting multi-decadal variation and the long term secular rise in the background. it comes down to what next after the last El Nino.
https://rclutz.wordpress.com/2017/06/27/climate-roller-coaster/
We will have to get back to a negative AMO for the anomalies to drop back to that level consistently. Probably still 6-8 more years. But what is more important is if we stay around +.2. That means no warming for two decades and counting.
That is why RSS had to make up new numbers. Won’t help, the planet isn’t warming for another two decades.
BTW, is still the old RSS version availabe beneath the new one?
For now (it is .34 for June). Could disappear at any time.
So, it looks like the pause is back and is now 19 1/2 years.
Not really, but nearly. Temp rise in 20 Years 0.1°C.
http://www.woodfortrees.org/plot/uah6/last:240/plot/uah6/last:240/trend
Here the 2017 data are missing.
0.1c is around the margin of error, so yes the pause is back.
That’s around 0.5C / century. The rate of warming since mid 1997 has increased slightly since the beginning of the year, so you may have a little longer to wait for the freedom clock to tick to 20 years.
All the fireworks being sent up into the sky tonight here in the U S could give off some artificially high readings. Factor that in. 🙂
Fireworks give off particulates, so the net change may be negative.
Can these changes be interpreted net of random multidecadal variability?
https://papers.ssrn.com/sol3/papers.cfm?abstract_id=2990384
Who decided where that 0/normal line should be?…people that can’t even explain their basic science
Move it up an imperceptible 0.3, and we’re below normal.
Baseline is average for 1981-2010.
As Dr. Roy Spencer noted:
The global, hemispheric, and tropical LT anomalies from the 30-year (1981-2010) average for the last 18 months are:
The zero line is the 1981-2010 average.
1981 – 2010 is arbitrary. It has the virtue of being recent, but the claim is that post-industrialization release of CO2 is responsible for warming. Therefore, one should be comparing a pre-industrialization baseline to modern temperatures. Unfortunately, satellites weren’t available prior to industrialization. So, I’d vote for the baseline to be the first 30 years of satellite measurements. Anomalies alone have the problem that they are difficult to compare with other anomalies precisely because there is no commonly accepted baseline. When you have many ‘standards,’ you don’t have a standard!
Since dedicated satellite observation began in 1979, the 1981-2010 baseline is pretty close.
Unless you include satellite observations from the 1960s and earlier ’70s.
Too bad that 1979 was probably the highest ice year of the past century.
guys I know that……..and it wasn’t the point I was trying to make
Agree, I got it, in the real world 0.2 C has no significance over such a long period. Just playing with numbers beyond a meaningful point, like the temperature record of 0.06 hotter touted by the media not reporting the insignificant amount.
The biggest change was the Southern Hemisphere, which lowered .4 to just .09.
Looking forward to the map, to see where the cool spots were.
Yes, how to explain that when the NH has been having Record breaking cold temperatures, with Snow, ice, destroyed crops and dead animals.
I have been saying for some years that what the Satellites show is not what we experience on the actual surface, I think they show the heat leaving the planet for space.
Winter in other words
So, it is still just weather and humans aren’t causing anything. Got it.
Finally. Took your time.
don’t trust the sat’s with what is currently coming from the sun\ no probe can withstand.
They keep on changing versions. why? what version UAH are we on now?
There is no more global warming, not even any man made global warming as this would affect minimum temperatures.\
And minimum T is falling
I don’t think this is O/T.
I read there was a large CME captured on video. How big was it? Is it going to affect us? Presumably it would drive up cloud cover (according to CERN).
Is the cloud cover causing the cold weather, or is it mostly the clearing and cooling at night as per the text above?
My wife and daughter are in Mongolia. Just leaving actually. My wife was there a month
for a class and then to meet my daughter the last two weeks. Spent a few days here and
there in Ulaanbaatar.
Piers Corbyn says the mini ice age is here to stay. link
Joe Bastardi thinks the hurricane drought is over. link
The temperature north of 80° is somewhat cooler than normal. link Usually during the melt season it’s stuck right on average. This is a bit unusual. On the other hand, it looks like the melt is proceeding normally.
What’s it all mean? I have no clue.
Trend since beginning of UAH series (1979): 1.2 °C per century
Trend since 1998: 0.2 °C per century
It doesn’t matter. We have CFSR and ECMWF and they cannot be adjusted as lives depend on their weather forecasts. ECMWF is also an international effort that is free from possible political interference.

The planet has been cooling since February 2016. This is to be expected after a strong El Niño. Let’s remeber that 2015-2016 El Niño was preceded by a 2014 quasi-El Niño (declared by Japan) that raised temperatures already in the second half of 2014 and set the stage above the average for the second half of 2015 start of El Niño.
Notice how Niño 3.4 SST anomaly reached 1ºC in late 2014 and never went really below 0.5ºC afterwards.
CFSR shows how 1-year averaged temperature anomaly (1981-2010 baseline) reached +0.5ºC in early 2016 and it is now below +0.4ºC and set to decrease further as the trend is clearly negative.
As Dr. Spencer says temperatures for the last 3 months have been moving in the range of mid-2015 temperatures. For a complete return to pause temperatures the gains of mid-2014 to mid-2015 should also be retraced and the 1-year average should reach around +0.1ºC. Whether temperatures are going to do that or not is anybody’s guess.
It is important to highlight that temperatures have been decreasing on ENSO neutral conditions. This is important because La Niña conditions are accompanied by lower cloud cover over the Pacific and the recharging of oceanic energy through increased insolation. In fact significant warming as been observed previously after the strong Las Niñas of 1976, 1989, and 2000. The lack of La Niña conditions makes it more unlikely that we will have a long term increase in temperatures after the 2015-16 El Niño.
The cooling of the planet for the past year and a half should be good news to skeptics and alarmists alike, as it reduces the chances of runaway temperature increases, that nobody wants. We should get a clearer picture of how things stand by 2019 when we should be able to determine if temperatures have been increasing or not during the 21st century, as a strong El Niño is a weather phenomenon that obscures the climatic signal.
It hasn’t cooled as rapidly as after the 1999 super El Nino, but that might have to do with the prior quasi-El Nino, not present in the late ’90s.
As per above, a return to below the baseline, as after the 1999 El Nino, in the next two years would be hard for alarmists to explain, but I’m sure they’ll try. Probably by disparaging UAH.
The cool years after the 1998 super El Nino were easy to explain. They were La Nina years. It is going to be much harder explaining the current temperatures. They were counting on a bump after the El Nino and it doesn’t appear they are going to get it. That is why RSS had to be manipulated upwards. They will claim UAH is an outlier now.
Also note we have been at or close to weak El Nino conditions for a few months now. This likely raises the anomalies by close to .1 C above where they would be with a completely neutral Nino 3.4.
How will The Team cook the balloon books?
Richard
The weak ENSO conditions currently could be linked to the recent el Nino having been of the Modoki kind, meaning that there was no engagement of the Bjerknes feedback. There was no full interruption of either the Peruvian coast deep upwelling or the equatorial trade winds, such as happens in a “real” el Nino. Thus the equatorial warming was centered in the central, not eastern Pacific.
It is the Bjerknes feedback that gives both the full blown east Pacific el Nino warming and the robust reactive cooling in a following La Nina. As happened in the archetypal 1999 ENSO event.
With the 2016 Modoki el Nino there was no real Bjerknes feedback. Thus the absence of the strong thermal fluctuations after the event. The central Pacific warming in such Modoki events is probably from a different mechanism or series of events.
Ptolemy2, I agree 100%. This warmth is left over from the 2016 super El Nino.
More hot air?
Thanks, Javier.
This is great news. I can’t wait for Lord Christopher to resume his “The Pause is now 24 months” postings.
I’ve learned not to make monthly or shorter-term predictions, but the same drop in anomaly for July as from May to June (-0.23 degrees C) would be below the baseline.
July is starting off fairly cool around my part of the country.
Independence Day in my AO will be one degree above average, but far below record:
———————– Forecast Average Record
Max Temperature 86 °F 85 °F 107 °F (1975)
Great.
Just great!
We’re in some real pretty shit now, man!
Game over!
https://youtu.be/45QJiADwGhE
Maybe we can build a fire…sing a couple of songs?
Already miss Bill Paxton!
What is clear is that none of the statistics translate into anything supporting an apocalypse ie any other sort if climate crisis
hunter July 4, 2017 at 12:34 pm
Exactly. Despite all the hysterical claims of impending Armageddon where the heck is this climate crisis? Trends are at 1C per century or so…maybe. (As if extrapolating that long is fair, anyway) What a non-story it all is.
Over the past 18 months or so we have seen a major revision to the UAH interpretation of the satellite data that greatly reduced the warming trend and a major revision to RSS interpretation of the satellite data that greatly increased the warming trend.
Both revisions, contradictory as they are, are supported by peer reviewed articles. Both revisions caused trend changes since 1979 that are massively bigger than any of the many revisions made to the surface temperature data, including the dreaded Karl et al. 2015.
The differences between the trends identified by the satellite producers since 2000 continues to be a magnitude bigger than the trends identified by the many surface data producers over the same period.
Structural uncertainties in both satellite temperature data sets mean that the error margins in their long term trends are massively bigger than those in any of the surface temperature data sets.
So why, oh why, do people keep insisting that the satellite temperature data are superior to the surface temperature data?
For many good reasons, although RSS is now scarcely better than the totally bogus “surface data”, which are in fact neither.
Adjustments to UAH were warranted scientifically to correct technical problems. “Adjustments” to “surface” “data” are politically motivated, unwarranted works of fiction. “Corrections” warm the land, so that the ocean then has to be warmed to keep up with the land. SSTs aren’t of the surface, but from different depths below it, calculated in different ways, which permits the book cookers to make them whatever they want. “Data” for much of the land surface are simply made up. The “surface” sets could hardly be more of an anti-scientific mess than if their perpetrators set out to make them as worthless as possible on purpose, rather than of the most use to their agenda.
Gabro,
Exactly the same case is made by RSS in their peer reviewed paper, which is published in journal certainly no less esteemed than that in which the UAH v6 update paper was published.
The satellite TLT data are all over the place. That’s in terms not just of compatibility between RSS and UAH, but also in terms of their internal structure. They massively over-respond to ENSO fluctuations, for instance.
There is much less cohesion between the satellite data sets than there is between the surface data sets, in terms of both internal cohesion and mutual compatibility.
Yet people continually refer to the satellite data as though it were pristine!
The simple reason being 7,500 stations on land do not represent anywhere near enough surface of the planet, to record meaningful small changes in global temperatures.
The satellites cover orders more surface area and the UAH a role model for the poles.
The revisions to the GISS and changes have been much larger than any data set.
Don’t you just love settled science?
What we call “GISS” was for local temperatures and local forecast. (ie airports. Planes needed to know what was happening on ground.) It was fine for that.
Then someone decided to try and take all those numbers from a system for local conditions and extrapolate “Global” conditions.
Nothing wrong with trying … until the square peg needed to be adjusted to fit the desired round hole.
David
I assume you are aware just how piltifully tiny the coverage of the surface data is
https://notalotofpeopleknowthat.wordpress.com/2016/10/12/more-hottest-year-evah-nonsense/
Paul,
I assume you are aware that there are at most 3 and more often 1 polar-orbiting satellite/s taking all that ‘global’ temperature information in at any one time?
Simple things like orbital decay affect *all* satellite temperature measurements, greatly affecting the global mean temperature result.
Station moves, etc only affect a small number of surface stations at any given time. Far too few to be of any real consequence to the global mean.
In any case, you ignore my main point: the global satellite temperature producers can’t even agree on what the long term warming trend is, whereas the surface temperature producers can.
So why is the satellite data held in higher regard than the surface data?
And if your answer is ‘satellite’, then which satellite data producer do we chose from and which data set, from the 4 wildly differing ones issued by the 2 main groups over the past 2 years, should we prefer?
DWR54
“So why is the satellite data held in higher regard than the surface data?”
Because the majority of the surface data is made up. Phil Jones admitted it in the Climategate emails. The surface data sets are rubbish and are of no scientific value.
“The surface data sets are rubbish and are of no scientific value.” As is the jiggery poker-ied satellite data. Leftist political agenda has corrupted the entire process, time for a full reset and for control of all of this to be placed in the hands of actual scientists and away from signitists whose only goal is getting more tax dollar funded grants.
“Station moves, etc only affect a small number of surface stations at any given time. Far too few to be of any real consequence to the global mean.”
Come off it, removing thousands of stations from both hadcrut and GISS hugely affect the data base to an extent they are no longer useful. Station moves are only just one of many much bigger problems. Making up data where there is none is acceptable to you? Yet you complain about little changes for orbital corrections.
What if the satellite reduce it coverage by 75%? Started making up data around poles where this isn’t any, never mind other area of the world especially Africa.
You are showing low standards for one and extremely high standards for the other, funny that isn’t?
“In any case, you ignore my main point: the global satellite temperature producers can’t even agree on what the long term warming trend is, whereas the surface temperature producers can.”
There was disagreement with hadcrut and GISS for as recent as version 4. Then after previously removing many stations they added 400+ more in places including for more Arctic coverage to match the GISS.
GISS reasons earlier for the difference was more coverage to the Arctic, but they had instead just made up data there were there was none by interpolation.
Therefore hadcrut version 4 was created to match a data set (being too kind) that showed more warming because it was apparently covering more Arctic by interpolation. How wrong is that to try and represent something that is not observed, but made up?
Now we have RSS trying to match the surface temperature data sets that have awfully changed there ways to match made up data interpolation in the Arctic originally done by GISS.
Sorry, but I will never find that acceptable in any science field.
To make matters worse GISS said the difference at the time between it and RSS was down to extra Arctic coverage. Even that was wrong because Arctic temperature would have to be ridiculously much higher to match each other. (50-100 c example in places)
DWR, there is only just the two (UAH & RSS), so it doubtful that the fact that they don’t corroborate one another has much meaning. Maybe if there were half a dozen you might have something there.
You’re right about your other point though… Half of the correction from v5.6 to v6 was due to spurious warming in the land data. This was pointed out to dr roy by two commentors at his blog(!) God only knows what else might be wrong with uah that spencer and christy are unaware of. Eventually though the climate will start warming again or start cooling again. At that point all the data sets should be in agreement about that basic fact. i think until that day comes, we’re all just spliting hairs…
” the error margins in their long term trends are massively bigger than those in any of the surface temperature data sets.”
Hah!
That’s a laugh!
I mean seriously…that is really rich.
Are you talking about error margins in data sets that have been multiply adjusted outside of their OWN ERROR BARS?
GMAFB.
Coverage comes to mind….
I’m not gonna insist that. I’m insisting the confirmation bias means the uncertainty is much bigger than admitted. The changes done afterwards undermine any statements on certainty, including the so called consensus statement of ‘settled science’.
It may have been the coolest for 2 years, but back then the planet was still in a El Nino.
There is one thing that we know if any one didn’t before?
AGW is real, but unfortunately it is mainly down to adjusted data once it has been realized it has failed to warm enough or warm at all.
We have seen no warming since the 1990’s using the same version, with the exception only because of a strong El Niño 2016/17.
NOAA-15 is not to blame.
March 4th, 2016 by Roy W. Spencer, Ph. D.:
While the title of their article implies that their new diurnal drift adjustment to the satellite data has caused the large increase in the global warming trend, it is actually their inclusion of what the evidence will suggest is a spurious warming (calibration drift) in the NOAA-14 MSU instrument that leads to most (maybe 2/3) of the change. I will provide more details of why we believe that satellite is to blame, below.
Importantly, Mears and Wentz choose to leave this calibration drift in without adjustment for it. In effect they are saying, ‘we don’t know which of the two satellites is at fault, so we will leave both satellites in without adjustment’.
http://www.drroyspencer.com/2016/03/comments-on-new-rss-v4-pause-busting-global-temperature-dataset/
That, if true, would mean the result is with a really large error bar. As I said, more uncertainty than admitted. Also, a very nice place to put in some confirmation bias.
NOAA-15 is not to blame.
March 4th, 2016 by Roy W. Spencer, Ph. D.:
While the title of their article implies that their new diurnal drift adjustment to the satellite data has caused the large increase in the global warming trend, it is actually their inclusion of what the evidence will suggest is a spurious warming (calibration drift) in the NOAA-14 MSU instrument that leads to most (maybe 2/3) of the change. I will provide more details of why we believe that satellite is to blame, below.
Importantly, Mears and Wentz choose to leave this calibration drift in without adjustment for it. In effect they are saying, ‘we don’t know which of the two satellites is at fault, so we will leave both satellites in without adjustment’.
http://www.drroyspencer.com/2016/03/comments-on-new-rss-v4-pause-busting-global-temperature-dataset/
Reality checks? Hardly any at all. The “anomaly” is less than +/-1 deg C, within the measurement accuracy of the satellite sensor.
Move along, nothing to see here.
@Javier
RSS “adjustments” aside, what are the various radio sond data sets telling us these days?
In the 2013-14 IPCC spaghetti graph comparing models vs. empirical, the radio sond data pretty much corroborated the satellite data.
I don’t think we can trust radiosonde data sets any more than we can trust surface or satellite data sets, and thinking that they can be the arbiters of disagreements is asking too much, as the data is even sparser than surface measurements, and the differences between different radiosonde data sets are quite big.
If RSS and UAH differ too much there is a new technique that could tell us which one is truer. It is a technique called Radio Occultation (RO) that uses the GPS satellites and does not rely on Microwave Sounding Units (MSU). It is the top graph in this figure:
From this article:
Recent global warming hiatus dominated by low-latitude temperature trends in surface and troposphere data
https://www.researchgate.net/publication/270597966_Recent_global_warming_hiatus_dominated_by_low-latitude_temperature_trends_in_surface_and_troposphere_data
ja, ja
global cooling is here
+10…nice graph comparisons.
Thanks for that.
Would like to see 2014-17.
http://www.romsaf.org/
How comprehensive are the satellite readings? How often is a particular area on earth measured? once a day? many times a day? Does a lot of extrapolation have to go on to get a high or low or mean temperature reading for particular areas of the earth. It seems like a lot of math must be used as opposed to a lot of actual observation.
Yeah, and as opposed to massive infilling of missing data, revisions to historical data, and just plain old making stuff up.