Poste invité par David Middleton
Sacré bleu !
Trump Budget Attacks Montreal Protocol, Reagan’s Crown Jewel
May 24, 2017 David Doniger
The Trump FY18 budget proposal slashes funding to support compliance with the Montreal Protocol, Ronald Reagan’s treaty to save the ozone layer.
The cut—which appears to be on the order of 40 percent—welches on U.S. international commitments and will imperil the global phase-out of ozone-destroying chemicals.
The Montreal Protocol—widely considered the world’s most successful environmental treaty—was negotiated under President Ronald Reagan in 1987 and is his crowning environmental achievement. It has been strengthened repeatedly under both Republican and Democratic presidents.
[…]
This year will mark the 30th anniversary of the Montreal Protocol, the “treaty to save the ozone layer.” This treaty is often cited as the textbook example of a successful environmental treaty which literally saved the planet at a reasonable cost. In many ways it is a perfect model for global efforts to save the planet from climate change:
- Instrumental measurements of the phenomena do not date back far enough to establish natural variability.
- Measurable mitigation success won’t occur for decades.
- Unverifiable claims that things would be worse if we hadn’t acted are treated as evidence that the treaty was successful.
- The threat was hyped.
- The true economic costs have been blurred.
This excerpt from a Smithsonian Magazine article sums it up quite well:
[…]
Rumors of blind sheep—the increased radiation was thought to cause cataracts—and increased skin cancer stoked public fears. “It’s like AIDS from the sky,” a terrified environmentalist told Newsweek’s staff. Fueled in part by fears of the ozone hole worsening, 24 nations signed the Montreal Protocol limiting the use of CFCs in 1987.
These days, scientists understand a lot more about the ozone hole. They know that it’s a seasonal phenomenon that forms during Antarctica’s spring, when weather heats up and reactions between CFCs and ozone increase. As weather cools during Antarctic winter, the hole gradually recovers until next year. And the Antarctic ozone hole isn’t alone. A “mini-hole” was spotted over Tibet in 2003, and in 2005 scientists confirmed thinning over the Arctic so drastic it could be considered a hole.
Each year during ozone hole season, scientists from around the world track the depletion of the ozone above Antarctica using balloons, satellites and computer models. They have found that the ozone hole is actually getting smaller: Scientists estimate that if the Montreal Protocol had never been implemented, the hole would have grown by 40 percent by 2013. Instead, the hole is expected to completely heal by 2050.
Since the hole opens and closes and is subject to annual variances, air flow patterns and other atmospheric dynamics, it can be hard to keep in the public consciousness.
Bryan Johnson is a research chemist at the National Oceanic and Atmospheric Administration who helps monitor the ozone hole from year to year. He says public concern about the environment has shifted away from the hole to the ways in which carbon dioxide affects the environment. “There are three phases to atmospheric concerns,” he says. “First there was acid rain. Then it was the ozone hole. Now it’s greenhouse gases like CO2.”
It makes sense that as CFCs phase out of the atmosphere—a process that can take 50 to 100 years—concerns about their environmental impacts do, too. But there’s a downside to the hole’s lower profile: The success story could make the public more complacent about other atmospheric emergencies, like climate change.
[…]
Read more: http://www.smithsonianmag.com/science-nature/ozone-hole-was-super-scary-what-happened-it-180957775/#W5LRedAOT3ymcci1.99Give the gift of Smithsonian magazine for only $12! http://bit.ly/1cGUiGvFollow us: @SmithsonianMag on Twitter
Rumors of blind sheep!!! Drastic measures to eliminate CFC emissions!!! Thirty years on, the ozone hole has not significantly changed… Although it would have been worse without Montreal (wink, wink) and it will heal by 2050 (nudge, nudge). This is from NASA’s Ozone Hole Watch page:

The annual thinning of the ozone layer over Antarctica has occurred during every Antarctic spring in which anyone was actually trying to measure it and continuous records only date back to 1986.
Ozone in the upper atmosphere is created when UV radiation from the Sun strikes oxygen molecules. This leads to the creation of ozone. The ozone layer doesn’t work like sunscreen; it’s more like reactive armor.
Stratospheric ozone is created and destroyed primarily by ultraviolet (UV) radiation. The air in the stratosphere is bombarded continuously with UV radiation from the Sun.When high energy UV rays strike molecules of ordinary oxygen (O2), they split the molecule into two single oxygen atoms.The free oxygen atoms can then combine with oxygen molecules (O2) to form ozone (O3) molecules.
O2 + UV light → 2 O
O + O2 + M → O3 + M (where M indicates conservation of energy and momentum)
The same characteristic of ozone that makes it so valuable – its ability to absorb a range of UV radiation – also causes its destruction. When an ozone molecule is exposed to UV energy it may revert back into O2 and O. During dissociation, the atomic and molecular oxygens gain kinetic energy, which produces heat and causes an increase in atmospheric temperature.
During the Antarctic winter very little sunlight hits the upper atmosphere over Antarctica and the Antarctic polar vortex prevents much in the way of atmospheric mixing between the polar and higher lower latitude air masses. This leads to an annual depletion of Antarctic ozone from mid-August through mid-October (late winter to mid spring). As the Antarctic spring transitions to summer, there is more exposure to sunlight and the ozone layer is replenished.
This process has occurred since the dawn of continuous ozone measurements in 1986. NOAA’s Earth System Research Laboratory / Global Monitoring Division used to feature a very disingenuous chart on their ozone page.

The image above has been replaced with the following:

The NOAA ESRL/GMD charts imply that the annual ozone hole did not exist during an earlier period of measurements from 1967-1971. This is wrong. The actual data from 1967-1971 clearly show that the annual ozone hole did exist. It may have been less pronounced at higher altitudes and it may have bottomed out in September rather than October; but it did exist. At low altitude (200 MB and 400 MB) it was nearly identical to the present-day…

There are a lot of reasons why earlier measurements differ from the modern data:
- The older data were sparsely sampled (1/4 the number of profiles) and the earlier ozonesonde balloons rarely, if ever, reached higher altitudes (40 MB and 25 MB).
- Natural climate oscillations. 1967-1971 was during a period of global cooling. 1986-1991 was during a period of global warming.
- Fluctuations in the polar vortex. It has been demonstrated that fluctuations in the polar vortex can influence Antarctic ozone observations (Hassler et al. 2010).
- Chlorofluorocarbons (CFC’s). It is possible that CFC’s did exaggerate the Antarctic ozone hole. However, the data clearly show that CFC’s did not create it.
Anthropogenic CFC emissions may very well have contributed to the area and depth of the annual Antarctic ozone hole. Reducing CFC emissions was a good thing. However, there clearly is no evidence that this was a crisis which required immediate, drastic, global action. CFC’s could have easily been replaced gradually with substances less hostile to the stratospheric ozone layer. The panic was so severe, that no cost analysis was even required for the Montreal Protocol.
No estimate of the global cost of replacing CFC-based technology has been made, but the Environmental Protection Agency estimated that the cost in the United States alone would be some $3 billion, mostly for replacing equipment made obsolete or unusable by the ban.
Unsurprisingly, the Competitive Enterprise Institute estimated that the cost in the United States would be more than ten-times the EPA estimate.
The CFC phaseout may well be the single most expensive environmental measure taken to date. During the policy debate, the costs were underemphasized to the point that they never became an important factor. The impact on consumers was scarcely considered. It may be too late to reverse course on the CFC phaseout, but it can serve as a lesson for the future.
I have not been able to find any recent estimates of the costs imposed on the U.S. economy by the Montreal Protocol. However, I know the costs were not insignificant and all of the benefits are either: 1) model-based assumptions and/or 2) 50 years in the future.
The ozone hole panic cost many people a lot of money. Refrigerating fluids, particularly in automobile air conditioners, had to be replaced. If you were the owner of a 1980’s motor vehicle or in need of air conditioner repairs in the 1990’s, you may as well have traded your vehicle in; because the cost of repairs became almost prohibitive due to new environmental regulations related to CFC’s (I owned a 1983 Chevy Camaro back then). If your home HVAC system was manufactured before the CFC ban, you faced a similar dilemma. The elimination of CFC’s even drove up the cost of asthma breathalyzers inhalers. The elimination of CFC’s may have evened worsened AGW!
The economic cost of this particular chapter of environmental junk science was minuscule in comparison to that of the current environmental swindle (anthropogenic global warming)… But this should serve as a clear reminder that citizen scientists have a duty to always check the work of government and academic scientists when they start Chicken Littling about the latest environmental crisis du jour.
References:
[1] Data Visualization >> South Pole Ozone Hole >> South Pole Total Column Ozone
[2] Hassler, B., G. E. Bodeker, S. Solomon, and P. J. Young. 2011. Changes in the polar vortex: Effects on Antarctic total ozone observations at various stations. GEOPHYSICAL RESEARCH LETTERS, VOL. 38, L01805, doi:10.1029/2010GL045542
[3] Oltmans, S. J., Hofmann, D. J., Komhyr, W. D., Lathrop, J. A. 1994. Ozone vertical profile changes over South Pole. NASA. Goddard Space Flight Center, Ozone in the Troposphere and Stratosphere, Part 2, p 578-581
Featured Image:

When it comes to environmental scares the CFCs hole in the ozone layer is classic when looking at AGW. As a none scare by creating the fear when that fear never eventuates rather than say it was never a problem they say look how our policies prevented a global economic disaster. It’s only a matter of time before AGW proponents rather than argue whether the temperature is increasing or not will explain that the lack of warming is due to measures to already taken to slow the rate of temperature rises. They will then argue that more money needs to be spent otherwise these gains will be reversed.
Even on moons with thickish atmospheres polar regions come equipped with low pressure “holes” RELATIVE to the standard air.
Like on Titan for instance.
http://www.clarksvilleonline.com/wp-content/uploads/2014/10/NASAs-Cassini-spacecraft-discovers-Methane-Ice-Cloud-in-Stratosphere-of-Saturns-moon-Titan.jpg
The leftists saw something “new” in Antarctica, took advantage of the situation, propelled by the nigh inexhaustible lobbying funds of Dupont, to hoodwink the entire human race.
That is a crime. Dupont deserves to suffer for that. Seems to me Brussels is always keen to crack the whip on a Microsoft or Budweiser.
What’s justice for them should be twice as just for a criminal corp like DuPont, which actually deserves it.
The reactive armor analogy is a bit off in that dissociation of ozone doesn’t block UV. Ablative effect is more precise analogy.
Still, not much correlation between ground level UV and total ozone. It is indeed oxygen which shields, explaining why sunburn is rapid at Mt Everest while nigh impossible at the Dead Sea.
David,
I am interested to know what evidence you would accept as compelling that CFCs were destroying the
ozone layer? There is evidence that they act as a catalyst in the lab, evidence that the ozone concentrations in the atmosphere is decreasing (albeit it is a slow decrease which is mostly hidden by seasonal fluctuations and large amounts of natural noise). As you stated there is no planet B on which a controlled experiment can be done.
In the meantime lower ozone concentrations mean larger instances of sun cancer so there is a real cost that is associated with low ozone concentrations. In addition plastic goods in the southern hemisphere degrade faster due to the increased UV concentrations. Thus you have to weigh the real costs associated with of a lack of ozone against real costs that come from banning CFCs. The question is then the costs outweigh the benefits? And again there is the selfish fact that using CFCs in the northern hemisphere kill people in the southern and how do you account for that?
Actual evidence would consist of decades of consistent measurements of stratospheric ozone starting well before the beginning of anthropogenic CFC emissions.
I stipulated in tbe post that CFC’s could have contributed to and enhanced the annual Antarctic ozone “hole” and that a gradual elimination of CFC’s would have been a good thing.
But no such measurements were made. So are you suggesting that people should die because the
ideal measurements were not made? Again the question is how do you weight the potential costs of continuing to use CFCs against the cost of implementing a ban? Would multiplying the cost of a
life lost by the probability that CFCs are the cause be acceptable? In which case again the case for a
ban would be quite strong.
There’s no evidence that any lives have been lost due to ozone depletion… None whatsoever. There is no clear evidence of a significant secular depletion of stratospheric ozone.

There is only the standard Chicken Littling that an x depletion of ozone would lead to a y% increase in melanoma deaths.
The gradual elimination of ozone-depleting emissions was a good thing. It just wasn’t a crisis which required drastic action.
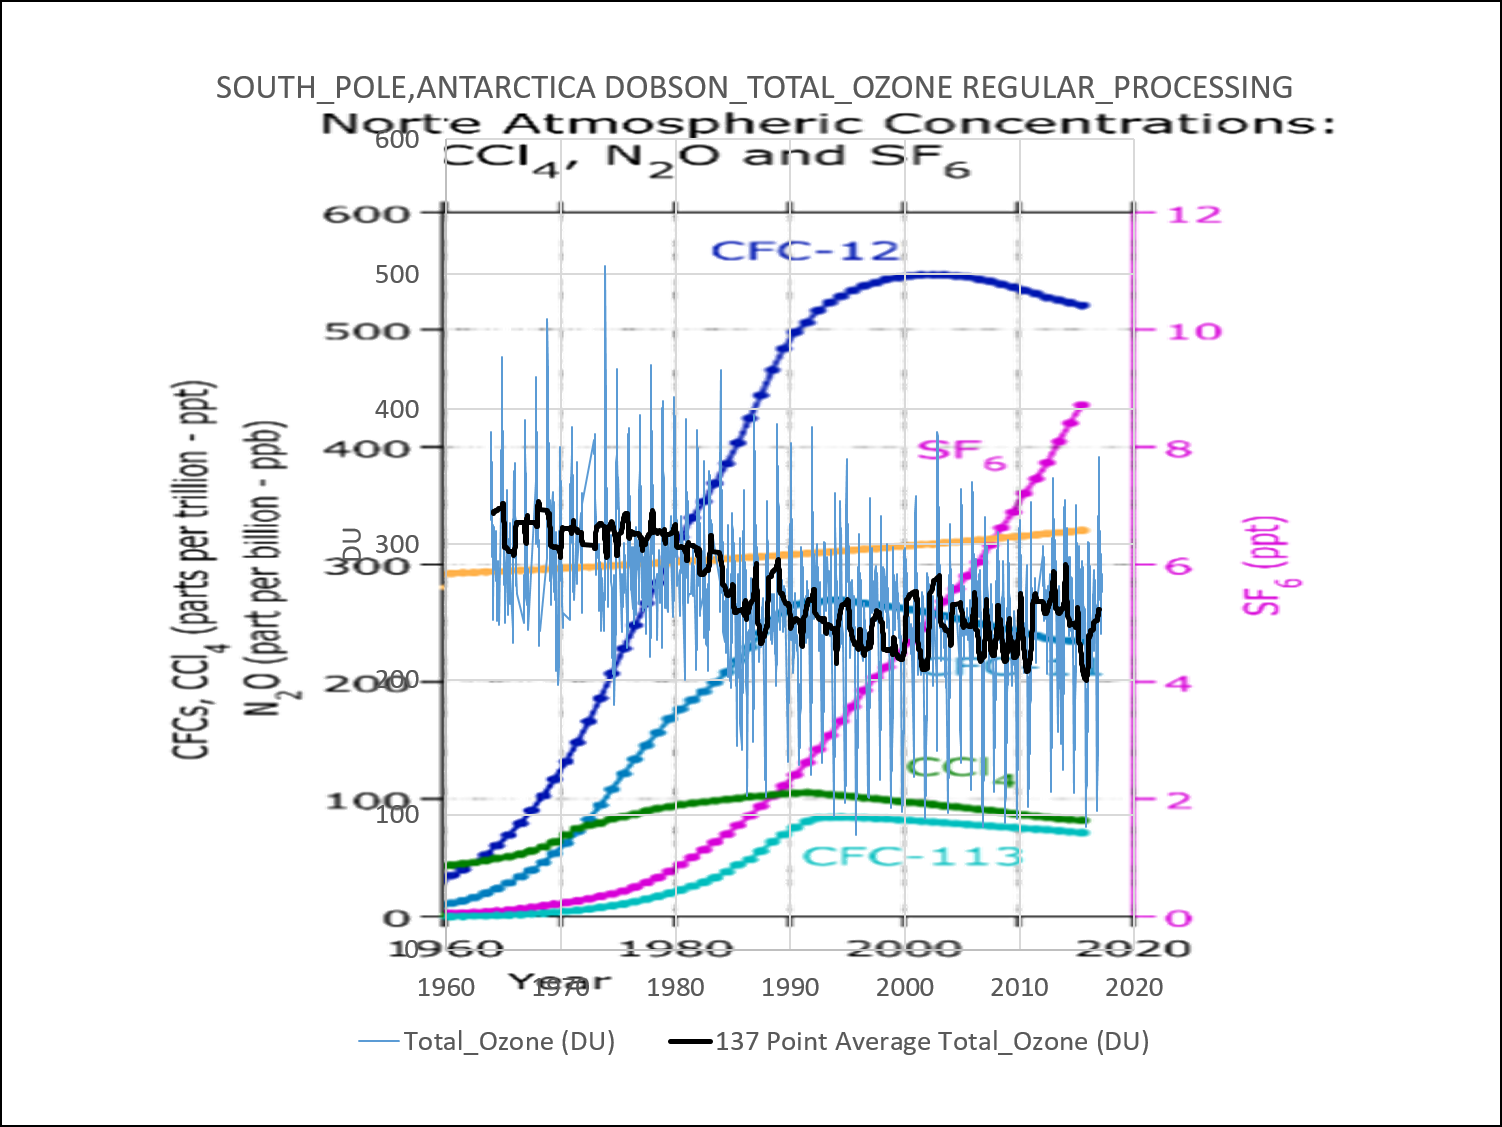
Here are two plots of total stratospheric ozone over Bismarck, North Dakota, one with atmospheric CFC concentrations and the other with stratospheric temperature:
While CFC’s were skyrocketing from a few ppb to 100’s of ppb, total ozone rose from 1960-1966 and declined from 1966-1993. Since 1993 the CFC concentrations have declined slightly, while ozone has recovered to where it was in the late 1970’s and early 1980’s.
It is massively unlikely that a 500 ppb increase in CFC-12 (and comparable rise in other CFC’s) could instantaneously cause a 20 DU drop in ozone and a 40 ppm drop in CFC-12 (and comparable drop in other CFC’s) could instantaneously cause 10 DU increase in ozone.
Total ozone more or less tracks the stratospheric temperature over the entire time series, irrespective of CFC concentrations.
Ozone depletion can either cause or be caused by stratospheric cooling.
David,
the question of whether or not there is any “evidence that any lives have been lost due to ozone depletion” is a statistical one that will always rely on correlation. But there is extremely strong statistical evidence about how many melanomas are caused by UV radiation
(see How much melanoma is caused by sun exposure?. Armstrong, B. K.; Kricker, A.
Melanoma Research: November 1993 for example) evidence that the rate of skin cancer in Australia has risen dramatically since 1980, and evidence that CFCs deplete ozone causing UV levels to rise. Put it all together and there is a strong case that CFCs are causing people to die. Imagine it is a civil court case where things are decided on the balance of probabilities. What is the probability that people are dying due to CFCs?
Abject nonsense.
As moronic as the Precautionary Principle.
Like these?
Exactly not like those. The minimum occurred in September prior to the mid-1980’s and the ozone level recovered every summer.
The ozone column over Antarctica was stable from the early 1960’s through the mid 1980’s. It shifted then downward and stabilized in the early 1990’s…
The ozone column over Alaska has increaaed since the early 1970’s…
How did this happen if CFC’s were destroying the global ozone layer?
David Middleton June 7, 2017 at 1:55 am
Exactly not like those. The minimum occurred in September prior to the mid-1980’s and the ozone level recovered every summer.
You have evidence that the minimum in Total Ozone in the Antarctic occurred in September prior to the mid-1980s? What does the summer recovery have to do with whether the data from the BAS are a consistent dataset or not?
Try to follow along. This was the original question:
To which, I replied:
The question wasn’t about whether or not CFC’s might contribute to the annual Antarctic ozone thinning. The fact that the thinning recovers every summer pretty well destroys the notion that “CFCs were destroying the ozone layer.”
David Middleton June 7, 2017 at 5:32 am

The question wasn’t about whether or not CFC’s might contribute to the annual Antarctic ozone thinning. The fact that the thinning recovers every summer pretty well destroys the notion that “CFCs were destroying the ozone layer.”
No it does not, in the 70’s the recovery was to values between 400 and 450 DU, in the 90’s the recovery was to between 300 and 350 DU. So not only do CFCs cause a ‘hole’ in the ‘ozone layer’ at the S Pole between 15 and 20km but it also prevents its returning to the same levels as previously.
The Antarctic winter *causes* the seasonal ozone hole. CFC’s might have contributed to its area and depth.
Over the entire record of continuous measurements, the Ozone column starts out at 250-300 DU, drops to 100-175 DU and returns to 250-300 DU.
Total Ozone, South Pole Station, 1963-2017
 ?w=680
https://www.esrl.noaa.gov/gmd/dv/iadv/graph.php?code=SPO&program=ozwv&type=ts
Ozone was stable from 1963-1983. from 1983-1993 it dropped from about 300 to 240 DU, where it has stabilized.
While CFC-12 was skyrocketing from 50 to 400 ppt, the ozone level remained constant. All of the drop in ozone occurred while CFC-12 was rising from 400-500 ppt. However, the ozone level remained stable while CFC-12 was rising to 540 and then dropping to 520 ppt.
Unsurprisingly, the ozone tracks the stratospheric temperature, irrespective of CFC concentrations…
David,
Back in the ’90s, CIESIN had a website with a sophisticated model of surface UV, that took into account clouds. One could look at the historical changes for various cities throughout the country. I could not see any evidence for a problem. That website is no longer available to the public.
David Middleton June 7, 2017 at 8:31 am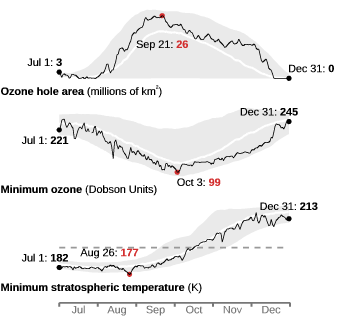
The Antarctic winter *causes* the seasonal ozone hole. CFC’s might have contributed to its area and depth.
No, it is the UV light from the sun after the Antarctic Spring sunrise that causes the seasonal ozone hole.
The formation of PSCs in the winter and their subsequent disappearance in the spring are the main ’cause’.
Over the entire record of continuous measurements, the Ozone column starts out at 250-300 DU, drops to 100-175 DU and returns to 250-300 DU.
No, the behavior in the late 50’s and 60’s was quite different than it is today. Typically in September and October the total Ozone was about 300-320 DU rising to about 350 in November and December then drifting back down to ~300 during the rest of the year.
Last year the value was 243 DU on July1, dropped to 114 DU on Oct 1 and rising back to 249 DU on Dec 31. Corresponding values in 1994 were: 277: 102: 304
David Middleton June 7, 2017 at 9:33 am
While CFC-12 was skyrocketing from 50 to 400 ppt, the ozone level remained constant. All of the drop in ozone occurred while CFC-12 was rising from 400-500 ppt. However, the ozone level remained stable while CFC-12 was rising to 540 and then dropping to 520 ppt.
You have apparently difficulty in reading your own graph, you appear to have misread 300 as 400. Also taking Northern Hemisphere, tropospheric CFC-12 and comparing it with South Pole, stratospheric ozone is a bit of a stretch (~5 year lag, Antarctic value in 1980 ~250 DU). Also there was a slow decline in ozone starting in ~1970 which accelerated in 1980, the ozone minimum was reached in about 1994 by which time the CFC-12 was very close to maximum.
Once again, the original question was: “I am interested to know what evidence you would accept as compelling that CFCs were destroying the ozone layer?”
David Middleton June 7, 2017 at 8:31 am
The Antarctic winter *causes* the seasonal ozone hole. CFC’s might have contributed to its area and depth.
My original reply to this appears to have vanished so I’ll try again.
The ozone hole is not caused by the antarctic winter, it is caused by the return of sunlight over the pole in the spring.
Over the entire record of continuous measurements, the Ozone column starts out at 250-300 DU, drops to 100-175 DU and returns to 250-300 DU.
That’s not correct, in the late 50s and 60s Total Ozone in September/Oct was ~300 DU, it rose to ~350-400 DU in Nov, and then declined back to ~300 DU during the rest of the year.
Nowadays this is what we see:
A different profile altogether, if we go back to 1994 we see the following:
June 28, 291 DU, Sept 26, 102 DU, Dec 27, 304 DU
Geronimo, if CFC were the culprit, why has there not been a major step up in Ozone since the massive reduction in CFCs.
Instead Ozone worldwide has continued a steady decline, there is absolutely no correlation between the 2, just as there is no correlation between CO2 and temps.
Because CFCs stay in the atmosphere for decades.
The why did they drop so quickly after the Montreal Protocol went into effect?
http://cdiac.ornl.gov/oceans/images/nhemispherecfcs2.png
http://cdiac.ornl.gov/oceans/images/shemispherecfcs2.png
David Middleton June 6, 2017 at 1:38 pm
The why did they drop so quickly after the Montreal Protocol went into effect?
Less than 10% drop over ~2-3 decades, that’s not ‘so quickly’.
From 1990-2004, CFC-12 rose from 500-545 ppb (3.2 ppb/yr). From 2004-2016, it dropped from 545-520 ppb (2.1 ppb/yr). It dropped almost as fast as it was rising.
David Middleton June 6, 2017 at 3:36 pm
From 1990-2004, CFC-12 rose from 500-545 ppb (3.2 ppb/yr). From 2004-2016, it dropped from 545-520 ppb (2.1 ppb/yr). It dropped almost as fast as it was rising.
Well CFC-12 production flattened out in the early 70s and dropped precipitately from 1990, it was growing faster prior to 1990. Went up from 300- 480 ppt between 1980 and 1990, that’s 18 ppt/yr (sic).
Geronimo,
You state, “In the meantime lower ozone concentrations mean larger instances of sun cancer so there is a real cost that is associated with low ozone concentrations.” First off, it is an implied association, not one demonstrated by measurements of UV. It is my understanding that melanomas are most commonly found on the lower body, while people are more commonly exposed to direct sunlight on their upper bodies.
In the case of Antarctica, there is no sunlight at all for nominally 6 months. When the sun first comes up over the horizon in the Spring, the rays are not only passing through a longer path length of air than they will three months later, but the rays are also passing through an ozone enriched region outside the circumpolar vortex. (See the images above in this thread, provide by Mike McMillan.) The sun is not high enough for the rays to pass directly down through the so-called hole. By the time that the sun does get high on the horizon, the vortex has broken up and the ozone levels are back to their protective levels. An unanswered question is whether or not the break-up of the polar vortex allows low-ozone air to dilute air masses north of the Antarctic Circle. It is unanswered because all the researchers are focusing on ozone and not measuring UV. There is a possibility that in the absence of stratospheric ozone, UV will be absorbed by the continuous creation of ozone at lower altitudes. Again, I don’t think that anyone has looked into this.
You are parroting the MSM script on ozone and apparently haven’t done any original thinking on the subject. The amount of UV that reaches the surface is not controlled just by ozone, but also by the strength of sunlight, which varies with the solar altitude, meaning the seasons. UV is also affected by clouds. Anytime a natural process is simplified to a single parameter, such as ozone, one should be suspicious that it is no longer science driving the discussion.
It’s the standard EPA “bear in the woods” or “bogeyman” fallacy…
http://www.who.int/uv/faq/skincancer/en/index1.html
Note that there is no statistical evidence presented or even linked to support the claim that “the incidence of both non-melanoma and melanoma skin cancers has been increasing over the past decades.”
The connection to ozone depletion is in the future, if we don’t abide by Montreal.
Then, almost as an aside, they state, “the main factors that predispose to the development of melanoma seem to be connected with recreational exposure to the sun and a history of sunburn. These factors lie within each individual’s own responsibility.”
Clyde Spencer June 6, 2017 at 1:17 pm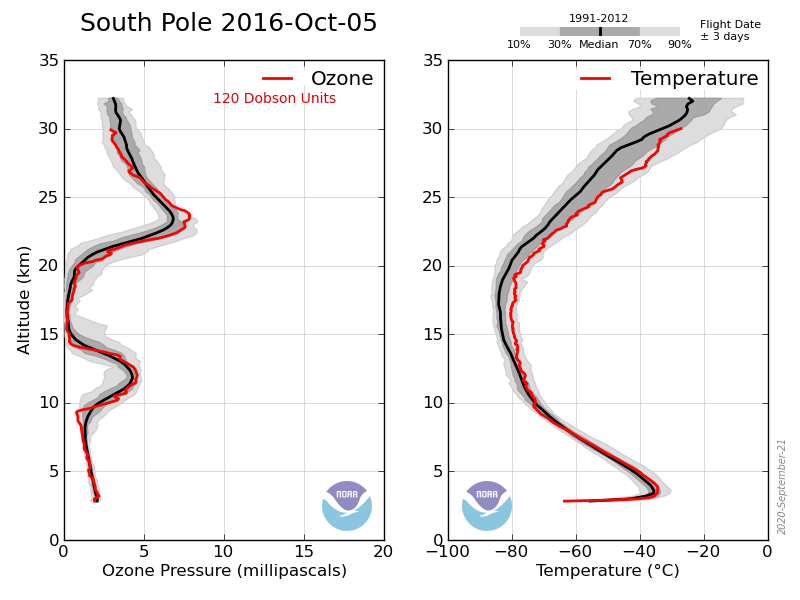
In the case of Antarctica, there is no sunlight at all for nominally 6 months. When the sun first comes up over the horizon in the Spring, the rays are not only passing through a longer path length of air than they will three months later, but the rays are also passing through an ozone enriched region outside the circumpolar vortex. (See the images above in this thread, provide by Mike McMillan.) The sun is not high enough for the rays to pass directly down through the so-called hole.
There is no sunlight so the atmosphere gets so cold that polar stratospheric clouds (PSCs) form, chlorine nitrate, ClONO2, breaks down on the surface of the cloud particles forming Cl2. While in the dark this isn’t a problem but once the sun reaches the stratosphere and warms it up enough to dissipate the PSC and Cl2 is photolysed by UV light (not the same wavelength as absorbed by O3) and the Cl radicals formed catalytically destroy the O3. Passing ‘down’ through the hole is an irrelevancy since the ‘hole’ exists between 15 and 20km where the Cl reduces the O3 to ~0 (down from ~12mPa a month earlier).
Phil,
I don’t disagree with your assessment of the mechanism of ozone destruction. However, what you seem to be missing, or at least not mentioning, is that depleted ozone itself is NOT the mechanism by which the biosphere might be harmed. Rather, it is the UV that may reach the surface that could be a problem. You don’t seem to have a good grasp of the geometry of the sun’s rays that reach the surface. The rays that first reach the surface in Spring enter the atmosphere well outside the ozone-depleted region. They pass through a longer path than if the sun were higher in the sky. That means, there is greater scattering and absorption than if the sun were high in the sky, and the rays encounter normal if not anomalously high ozone levels outside the vortex! Also, the footprint of a bundle of rays is spread out at low sun altitudes, meaning the sunlight (including the UV) is weak. The point is, by the time that the sun gets high in the sky, and the atmospheric path length is shortened, and the footprint is shrunk, the ozone has recovered to the protective levels of the previous year. Watch the pea under the shell!
Clyde Spencer June 7, 2017 at 11:36 am
Phil,
I don’t disagree with your assessment of the mechanism of ozone destruction. However, what you seem to be missing, or at least not mentioning, is that depleted ozone itself is NOT the mechanism by which the biosphere might be harmed. Rather, it is the UV that may reach the surface that could be a problem. You don’t seem to have a good grasp of the geometry of the sun’s rays that reach the surface. The rays that first reach the surface in Spring enter the atmosphere well outside the ozone-depleted region. They pass through a longer path than if the sun were higher in the sky. That means, there is greater scattering and absorption than if the sun were high in the sky, and the rays encounter normal if not anomalously high ozone levels outside the vortex! Also, the footprint of a bundle of rays is spread out at low sun altitudes, meaning the sunlight (including the UV) is weak. The point is, by the time that the sun gets high in the sky, and the atmospheric path length is shortened, and the footprint is shrunk, the ozone has recovered to the protective levels of the previous year. Watch the pea under the shell!
On the contrary I have an excellent grasp of the geometry, we’re not just concerned about UV rays reaching the surface during the spring in Antarctic. Ultimately continued depletion of O3 at the S Pole leads to depletion elsewhere. The Ozone does not ‘recover to the protective levels of the previous year’, as pointed out to you before the summer levels over time have decayed.
Phil,
As I stated in an early post, my work based on TOMS data doesn’t support your claim of declining Antarctic ozone having a significant impact in Antarctica, let alone a worldwide impact. The Antarctic decline is the result of special circumstances of extremely low temperatures, and the circumpolar vortex preventing ozone-rich air from migrating into the region of the ‘hole’ until after the vortex breaks up. Can you cite any research showing increasing surface UV either in Antarctica or the Southern Hemisphere?
Clyde Spencer June 8, 2017 at 11:37 am
Phil,
As I stated in an early post, my work based on TOMS data doesn’t support your claim of declining Antarctic ozone having a significant impact in Antarctica, let alone a worldwide impact. The Antarctic decline is the result of special circumstances of extremely low temperatures, and the circumpolar vortex preventing ozone-rich air from migrating into the region of the ‘hole’ until after the vortex breaks up. Can you cite any research showing increasing surface UV either in Antarctica or the Southern Hemisphere?
Your model for how the ozone hole is formed is wrong as pointed out above. I take it you don’t know how a Dobsonmeter works, since in order to measure decreased Total Ozone by definition surface UVB must increase.
I recall reading about industrial plants in China and other locations that were paid to destroy CFC stocks while other plants upped their production to satisfy this new market. A bureaucratic black market win-win. Has that been sorted yet?
Peta from Cumbria, now Newark June 6, 2017 at 1:57 am
And where were all our educated population when Montreal was put together?
Did *nobody* have the where-with-all or the guts to use their basic school chemistry education to say that chemical reactions DO NOT start and accelerate as temperatures drop?
Takes a bit more than basic school chemistry to understand that it required the formation of PSCs at -78ºC to create the substrate for the heterogeneously catalysed reaction to take place, followed by a photolytic reaction.
Phil,
You say that my “model for how the ozone hole is formed is wrong as pointed out above.” I don’t know exactly what you are referring to. I acknowledged that your description was essentially correct. Are you questioning the Brewer-Dobson circulation and the role of the circumpolar vortex in interrupting it?
I have not used a Dobson, but I know that they depend on a ratio of UVB to UVA, and they don’t measure absolute values. According to https://en.wikipedia.org/wiki/Dobson_ozone_spectrophotometer,
“The Dobson method has its drawbacks. It is strongly affected by aerosols and pollutants in the atmosphere, because they also absorb some of the light at the same wavelength. Measurements are made over a small area in the direction of the sun.” Therefore, they don’t work in total darkness, and unless the unit is positioned inside the “hole” it doesn’t measure properly. Something that isn’t addressed is how the sunlight coming in at low angles, outside the depleted air mass, is compensated for in the measurement technique.
I asked if you could cite measurements demonstrating an increase in surface UV (particularly in the Summer), and you referenced Dobson Spectrophotometers. That was not responsive to my question. An apparent increase in UVB could be observed if UVA decreased for some reason such as scattering outside the instrument site, overhead clouds, or a shift in the spectral composition of sunlight with the sun spot cycle.
So, besides the confounding effects of aerosols in measurements, recent work has found that water vapor apparently can accelerate photolytic losses.
You might find this link to be of interest: https://www.physicsforums.com/insights/software-never-perfect/ Might it be that the apparent change in the Antarctic ozone around 1980 is an artifact of a change in the way it was measured?
Clyde Spencer June 8, 2017 at 6:52 pm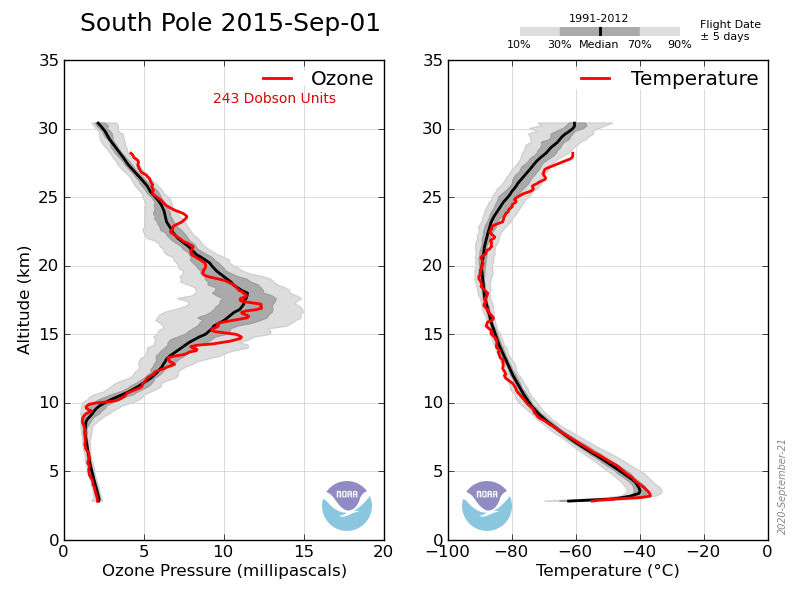


Phil,
You say that my “model for how the ozone hole is formed is wrong as pointed out above.” I don’t know exactly what you are referring to. I acknowledged that your description was essentially correct. Are you questioning the Brewer-Dobson circulation and the role of the circumpolar vortex in interrupting it?
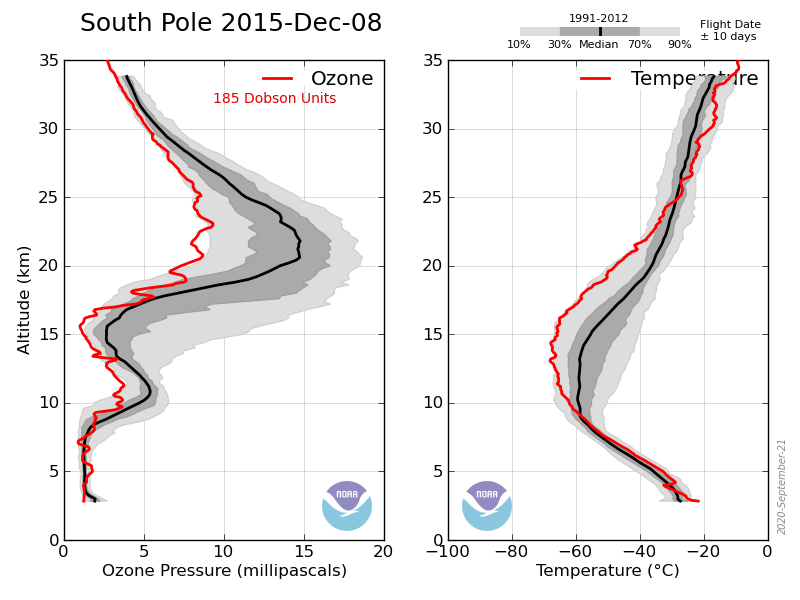
Here’s the profile early in September:
Vortex seems to be forming well:
Note there is a robust ozone layer and the temperature between 10km and 25km is low enough to form PSCs.
Vortex seems to be forming well.
By early October the ozone layer between 13 and 20 km has gone and the temperature has risen and total ozone is down to 124 DU.
Vortex looking good:
By early December the Ozone layer is rebuilding as the temperature has risen and total ozone is up to 184 DU.
The vortex has weakened but not collapsed so the growth in ozone is not due to that.
Phil,
“The chemistry of the Antarctic polar vortex has created severe ozone depletion. The nitric acid in polar stratospheric clouds reacts with chlorofluorocarbons to form chlorine, which catalyzes the photochemical destruction of ozone.[39] Chlorine concentrations build up during the polar winter, and the consequent ozone destruction is greatest when the sunlight returns in spring… Since there is greater air exchange between the Arctic and the mid-latitudes, ozone depletion at the north pole is much less severe than at the south [pole].”
https://en.wikipedia.org/wiki/Polar_vortex
“Researchers face two crucial problems in ozone studies-finding a slow, long-term trend among a variety of short-term trends, and ascertaining how much of the change in global ozone is due to human activities and how much is attributable to natural atmospheric processes. In order to separate these factors, scientists must record data over at least a complete 11-year solar cycle.”
https://eospso.gsfc.nasa.gov/missions/total-ozone-mapping-spectrometer-earth-probe
I think that it would be more instructive to look at the TOMS ozone maps for the southern hemisphere, contrasting the high ozone values outside the polar vortex with the low values inside, instead of only looking at South Pole time series.
It appears to me that the Brewer-Dobson circulation goes a long ways in explaining the recovery of the depleted ozone in Antarctica.
Clyde Spencer June 9, 2017 at 7:12 am
Phil,
“The chemistry of the Antarctic polar vortex has created severe ozone depletion. The nitric acid in polar stratospheric clouds reacts with chlorofluorocarbons to form chlorine, which catalyzes the photochemical destruction of ozone.[39] Chlorine concentrations build up during the polar winter, and the consequent ozone destruction is greatest when the sunlight returns in spring…
Which is basically what I said.
I think that it would be more instructive to look at the TOMS ozone maps for the southern hemisphere, contrasting the high ozone values outside the polar vortex with the low values inside, instead of only looking at South Pole time series.
Which is exactly what I did, for some reason the png files of the relevant TOMS images don’t open (maybe you can find them by clicking on the little blue [?].
They were the ones for 1st Sept: https://ozonewatch.gsfc.nasa.gov/Scripts/big_image.php?date=2015-09-01&hem=S
6th Oct: https://ozonewatch.gsfc.nasa.gov/Scripts/big_image.php?date=2015-10-06&hem=S
8th Dec: https://ozonewatch.gsfc.nasa.gov/Scripts/big_image.php?date=2015-12-08&hem=S
And where were all our educated population when Montreal was put together?
Did *nobody* have the where-with-all or the guts to use their basic school chemistry education to say that chemical reactions DO NOT start and accelerate as temperatures drop?
Obviously not.
So, why did everybody wimp out, & pass the buck to the money grubbing ‘scientists’ employed by DuPont?
I say, because almost *everyone* is hitting them selves with a chemical cosh, 3 times per day and with endless snacks (all based around sugar) in between. Probably finishing their day with the ultimate legal chemical cosh, alcohol.
And so it takes someone who doesn’t drink to call this out for what it is. Here is someone with a clear head, self confidence, good memory, ability to speak without a teleprompter and all the things that are wrapped into the thing that is a ‘GSOH’
And since Ancell Keys. on his own personal preference, misused the scientific process to declare saturated fat as ‘bad’, what have we had if not an ever growing succession of panics – based upon 5hit science and spread/amplified by the very technology that is going to save us and propagated by politically correct people without the brains or guts to speak out.
Things like nuclear winters, silent springs, millennium bugs, mad cows, global cooling, avian flu, ebola, ozone, CO2 and what else?
But its *so* obvious, eating fat makes you fat and sugar gives you energy that you need. yeah, just like its obvious that CO2 traps heat and ozone stops the world being frazzled. Did no-one evn have the guts to ask where the fook the ozone came from?
Reduction in saturated fat consumption & the associated rise in sugar consumption. Look at the timescales.
Is that correlation or causation?
Is it one or the other that causes a tee-totaller to call BS on the current global scientific frauds – because everyone else is half asleep, morally gutless, entranced by the snake-oil salesmen, counting faeries and admiring the emperor’s new clothes.
Because of eating carbs (sugar)
The ozon hole is largely caused by emissions from the Mount Erebus volcano. It is one of the most active volcanoes on Earth and has been erupting continuomusly since 1981. And this has been known for decades
https://www.researchgate.net/publication/283802406_The_Antarctic_ozone_depletion_caused_by_Erebus_volcano_gas_emissions
http://onlinelibrary.wiley.com/doi/10.1029/93GL01879/abstract
Eric,
You reference an early Newsweek article that says “Rumors of blind sheep—the increased radiation was thought to cause cataracts— …”
Probably you know that Al Gore’s 1992 book “Earth in the Balance” has passages like these: “In Patagonia, hunters now report finding blind rabbits; fishermen catch blind salmon.” “We too are affected by extra UV radiation. The best-known consequences include skin cancer and cataracts, both of which are increasingly common, especially in areas of the Southern Hemisphere such as Australia, New Zealand, South Africa and Patagonia.”
I went looking for Australian data on cataracts of the eyes and found first “As in other developed countries, the most prevalent causes of blindness and vision loss in Australia are the age-related degenerative eye diseases, such as macular degeneration, glaucoma and cataract.” Ref: https://www.health.gov.au/internet/main/publishing.nsf/Content/D1A5409787D800F2CA257C73007F12F3/%24File/eyehlth.pdf
It is scientifically irresponsible to quote a change with time as if the stated variable was the only one. Gore implies UV is the main variable. The quote shows age is the main factor. Another possible confounding factor is the actual variation of UV over time, as intercepted by the eyes of the subjects. In this respect, in about 1988, I did a fair deal of research into natural UV abundance globally and locally. There was very little data in the public domain – a next to useless amount of data.
Unless Gore had access to unpublished data, he was simply making stuff up. There is no point to the development of his theory about UV and cataracts/blindness unless and until he can show a correlation between increases of both cataracts and UV and then account for the large effect of natural ageing.
However, so popular has his book been that we mere mortals will be abused for questioning its science.
Geoff.
Speaking of Al Gore…
http://www.crm114.com/algore/quiz.html
Time changed the meaning of a sun tan. The Victorian era looked down on a tan, it was a sign of a field worker. The 1960s changed this, sun exposure takes time. It just so happened to correlate with ozone dissociation due to ClO.
Chlorine monoxide does not prevent formation of ozone. It only catalyzes dissociation. Shifting the equation to the left.
This link might be of interest to readers: http://www.news-medical.net/news/20170606/Study-reveals-increased-risk-of-ozone-loss-over-the-central-United-States-during-summer-months.aspx
Note that after three decades the UV levels are still not being reported. Only focusing on ozone, and extrapolating possible implications. Some things don’t change.
I would recommend this The Holes In The Ozone Scare: The Scientific Evidence That The Sky Isn’t Falling By Rogelio A. Maduro;Ralf Schauerhammer. Available as a book on Amazon and, if you poke about, a free download as a pdf. A very comprehensive study of the ozone scam, and includes some interesting stuff by Dobson (DU = Dobson Units) among other things.
And while I’m here – Thank you David for some very useful information over the years. I use it in some presentations I give at the U3A in Cambridge. U.K. (Don’t know whether you have that organisation in the US). It’s swimming against the tide, but I live in hope.
MikeA
A promising site to poke about is http://b-ok.org/ (former bookz.com)
One of the talks at the NOAA Earth Sensing conference in Boulder
a couple of weeks ago , Stratospheric Ozone at South Pole Begins to Show Signs of Improvement in the Yearly Ozone Hole https://www.esrl.noaa.gov/gmd/annualconference/abs.php?refnum=112-170407-C , was far from convincing .
A related talk , The Continued Slowdown in the Decline of Atmospheric CFC-11 The Continued Slowdown in the Decline of Atmospheric CFC-11 , I felt raised questions whether there might be natural source for some of these compounds . They are talking parts per trillion on a lot of these measurements .
In any case , the banning of Primatene asthma inhalers for the couple of grams of CFC propellant is an obscene direct and in some cases almost surely deadly attack on human health .
I seem to remember reading that the space shuttle Columbia tragedy was a result of the CFC paranoia. A chunk of the foam, which covered the external fuel tank, came loose during liftoff and damaged the shuttle, which then burnt up during re-entry as a result of the damage. Seems that the foam manufacturing / application process was changed due to CFC “concerns”, and the resultant product did not adhere nearly as well. Perhaps someone with better knowledge of this could elaborate.
Some of the foam used on the shuttle was made using Freon free processes, however the piece that broke off was BX-250 foam which was still made using Freon so the change did not contribute to the accident.