Guest essay by Rud Istvan

Dr. Murry Salby has been getting substantial attention in the climate blogosphere, for two reasons. First is his theory that at least 2/3 of the observed increase in atmospheric CO2 is natural and temperature induced. Second are the circumstances surrounding his departure from U. Colorado and later termination from Macquarie University. This post covers the first and not the second, and is motivated by a very recent WUWT post on the mysteries of OCO-2, where the Salby theory was raised yet again in comments.
Background
Dr. Salby developed a substantial scientific reputation for work on upper atmosphere wave propagation and stratospheric ozone. He has published two textbooks, Atmospheric Physics (1996) and Physics of the Atmosphere and Climate (2012). His new theory that most of the increase in atmospheric CO2 is naturally temperature induced (NOT anthropogenic) is not published. He explicated it in a Hamburg lecture 18 April 2013, and a London lecture 17 March 2015. Both are available on YouTube. (Search his name to find, view, and critique them before reading on if you want to deep dive.) This post does not reproduce or critique his arguments in detail. (There are fundamental definitional, mathematical, and factual observation errors. Perhaps a more detailed companion post will follow detailing them with footnotes if this does not suffice.) This post only addresses whether his conclusions are supported by observations; it is a macro Feynman test rather than a Salby details deep dive.
Controversial CO2 Atmospheric Concentration Theory
The core of Salby’s theory is derived using CO2 data from MLO’s Keeling Curve since 1958, and satellite temperature data since 1979. (His few charts reaching back to 1880 contain acknowledged large uncertainties.) His theory builds off a simple observation, that in ‘official’ estimates of Earth’s carbon cycle budget, anthropogenic CO2 is only a small source compared to large natural sources and sinks. This is illustrated by IPCC AR4 WG1 figure 7.3.

He then deduces there must be rapidly responding temperature dependent natural CO2 net sources much greater than anthropogenic sources. This is a very questionable argument on short decadal time frames. Gore got it wrong, and Salby got it wrong. The ice core based CO2 lagged change to temperature is about 800 years, common sensically corresponding to the thermohaline circulation period. (For rigorous calculations on Salby’s decadal time scales using residency half-lives and efold times, see Eschenbach’s post at http://wattsupwiththat.com/2015/04/19/the-secret-life-of-half-life/

He observationally bolsters his conclusion by ‘showing’ that highest CO2 concentrations are over relatively uninhabited/unindustrialized regions like the Amazon basin, so must have natural origins. The following ‘observational’ figure is from his Hamburg lecture. Except it is completely disproved by OCO-2.

Critique
As Feynman said, observation trumps theory.
First, if Salby is right, the rise in atmospheric CO2 concentrations should have slowed or stopped because of the ‘pause’. They haven’t. They bear no short or long term relationship to one another. Since 2000, CO2 has increased about 35% on the 1958 Keeling curve base; temperatures haven’t (the pause). The seasonality of the northern hemisphere terrestrial photosynthetic sink is apparent in the Keeling curve, as is the temperature/CO2 discrepancy disproving Salby.

Second, satellites have NOT generally observed higher CO2 concentrations over uninhabited/ unindustrialized regions in past two decades. (The following NASA charts use AIRS IR sensors on various satellites to estimate gridded CO2 concentrations from peak CO2 OLR absorption wavelengths. The new OCO-2 data is even more stark.)

Third, Salby’s theory requires that land and/or sea serve as the temperature dependent CO2 net sources that ‘overwhelm’ anthropogenic CO2 emissions from fossil fuels and cement production. That is NOT true either; both land and sea have been serving as net sinks.
Terrestrial biomass (net primary productivity, NPP) is an increasing sink. This has been observed in multiple ways, including NASA AVHRR (1982-2009) and MODIS (2000-2009) ‘normalized difference vegetative index’ (NDVI). NDVI has been ground truthed by sampling NPP including both ‘roots and shoots’ by ecosystem. The terrestrial net biological sink has increased since 1980. It is not a source. The most recent paper is NASA’s 14% greening in 30 years, published 4/16/2016 and previously remarked at WUWT.

That leaves oceans. Biologically, oceans are a net carbon sink through photosynthesis and calcification. Satellites detect this through planktonic chlorophyll concentrations.

But there are certainly large ocean zones that are relatively barren (mainly from lack of iron fertilization in the form of dust). Those large blue barren swaths are where ocean water pCO2 and pH are monitored, precisely to minimize confounding biological sink influences recently explained on WUWT by Dr. Jim Steele. Could those also be a net source?
Barren ocean regions are mainly influenced Henry’s Law and Le Chatellier’s Principle. The first says partial pressures of ocean dissolved CO2 and atmospheric CO2 will equilibrate. The second partly says colder water stores more dissolved CO2. ARGO suggests the oceans are warming. Could Le Chatellier be stronger than Henry, in which case oceans could provide Salby’s requisite rapidly temperature dependent net natural source? There are two stations, Aloha 100 km north of Oahu (maintained by University of Hawaii and WHOI) and BATS off Bermuda (maintained by WHOI) where the hypothesis can be tested by observations. Both show even barren oceans are a net carbon sink since 1980. Barren ocean pH declines as pCO2 increases.

If there are no observational temperature dependent natural CO2 sources, and temperature dependent sinks (NH temperate terrestrial vegetation) increase with temperature, then Salby’s natural carbon dioxide theory cannot be true. It is falsified. Even before detailing his definitional, mathematical, and factual errors.
Discover more from Watts Up With That?
Subscribe to get the latest posts sent to your email.
Even Ferdinand agrees with Salby (and Bart) that temperature controls the recent variability around the trend in increasing atmospheric CO2.
This power to account for short term variability must be accounted for even if humans are the predominant contributors to atmospheric increase.
Our understanding of the Carbon cycle is very crude. Clearly the human contribution is lunch money.
To argue that the biosphere is a net Carbon sink, and that therefore no part of it (except us) can dominate atmospheric increase, is not necessarily correct. This argument ignores the large Carbon flow asymmetries, both by volume and isotope, in the Carbon Cycle.
The atmosphere interacts with the biosphere through soils, land plants & biota, and ocean biota. (We set humans apart for this equation.) Soils absorb little atmospheric CO2, but introduce 60 GT/yr at about -21PDB. Land plants etc, absorb about 115 GT/yr at +18PDB and introduce about 110 GT/yr at -26PDB. Marine biota has very large exchanges with the mixed layer of the ocean, but interaction with the atmosphere is thought to be inconsequential.
Humans absorb very little and introduce about 10 GT/yr at -24PDB.
Carbon in the atmosphere averages -8PDB.
Let’s tabulate the net isotope integrated yearly inputs from the biosphere to the atmosphere:
(Humans 10@-24) + (Soils 60@-21) + (Land Biota -5@+1)
Sum ding wong. Without some huge unknown input of 13C, the atmosphere is not going to stay at -8. Even if we have Land etc.way off and it is actually -20@+1; still not going to stay at -8.
While the biosphere is a net Carbon sink overall, it is NOT a net sink from the atmosphere.
Same point I was trying to make above, but didn’t state it as well.
Thanks.
Gymnosperm wrote “This power to account for short term variability must be accounted for even if humans are the predominant contributors to atmospheric increase.”
try Jones et al. “The Carbon Cycle Response to ENSO: A Coupled Climate–Carbon Cycle Model Study”, http://journals.ametsoc.org/doi/abs/10.1175/15200442%282001%29014%3C4113%3ATCCRTE%3E2.0.CO%3B2
The Jones work is well known and supported by measurements, but ENSO does not represent all the short term variability. Neither does ocean outgassing as it is severely limited by a slow or nonexistent response to atmospheric temperature, and Henry’s law. Seemingly, soils would be the play. They respond quickly to atmospheric temperature, and at 60 GTC/yr, definitely have the horsepower.
Yeah, integrals are essentially “degrees of freedom”, and one hesitates to resort to them. If it were the typical crappy Milankovitch style correlation, one would easily dismiss it. I don’t have it handy, but Bart has posted many times a WoodforTrees graphic that shows a really astonishing correlation of temperature and the time integral. Too good to dismiss as artifact.
gymnosperm,
Something goes wrong in the totals…
I am not sure, but it seems to me that soils are a part of the biosphere, but in your calculation are counted apart. Soils can’t release CO2 that wasn’t first captured from the atmosphere by plants out of the same atmosphere some months to decades before…
If soils release CO2, they need oxygen, thus they are part of the oxygen balance, which shows that some O2 is produced, equivalent to 1 GtC/year CO2 uptake, thus including what soils released and what humans released by land clearing.
Thus your formula should be something like .:
(Humans 10@-24) + (Total biosphere -1@-18)
Need to be careful with the signs, as the biosphere sinks ~1 GtC wich is at -26 PDB, thus leaving ~1 GtC at +26 PDB behind? Why the difference in δ13C between releases and uptake?
Anyway, thanks to mainly human emissions, the δ13C levels drop since ~1850 (-6.4 PDB then) in lockstep with human emissions…
Yes Ferdinand, atmospheric PDB has indeed dropped at a rate of -.01/year since 1850, and has been measured more recently at -.02/year.
Soils are certainly part of the biosphere. They are differentiated here (as humans are) because their interaction with atmospheric Carbon is essentially one-way and their isotopic signature is unique.
One must indeed be very careful with sign. Doubly so when working with net flow. I hadn’t looked at my model for a long time, and I think I was a bit hasty with plants. The consensus was that the flow from the atmosphere to plants left a residual to the atmosphere of +18, and that the return from plants to the atmosphere was +5 to the atmosphere. Plants selecting 12C in the first case, and spitting out 13C in the second. So the net should be more like (Plants 5@ur momisugly+12). Unless we are very fussy about mass balance, 5 GT is very small relative to the ~700 GT the atmosphere contains, and the sign of the 5 GT can be ignored for this thread.
Changing from 5 GT@ur momisugly +1 to +12 really doesn’t change my point that we need a lot of 13C from somewhere to keep atmospheric PDB from falling like a rock. My model produced -3.5 the first year.
I agree with your approach of incorporating Oxygen balance. Certainly human combustion is all aerobic. A lot of soil CO2 metabolism is anaerobic. I’m not sure one can justify back-figuring the entire biosphere to a 1 GT sink based on O2 balance alone…
Cool farm Leif, ever welcome –
https://www.google.at/search?q=google+translate&oq=goo&aqs=chrome.
Rud , drop the erroneous cement making ‘source’. It spends it’s life taking its CO2 back out of the atmosphere. Gee, a carbon neutral activity of man don’t cha know.
http://www.cement.org/for-concrete-books-learning/concrete-technology/concrete-design-production/concrete-as-a-carbon-sink
GP, interesting idea. But won’t. The ultimate CO2 carbon sink is carbonate rock formed by various ocean biological calcification processes. The only thing keeping the planet alive is tectonic subduction zones where carbonates get recycled into andesic volcanos. Somewhere in my voluminous archives I remember reading a paper estimating that without that geologic recycling process, life on earth would cease in about 2.5 million years from now from lack of CO2 for photosynthesis. So I am by all means going to always include cement kilns. Just anthropogenic subduction zones.
BTW, looked up while writing Blowing Smoke the claim that concrete soaks up more CO2 than in the making of cement. By and large not true except in the first CM of the concrete bulk. Another skeptical urban CO2 myth busted. Go to the US Concrete Institute/Association (whatever its name is, google will find the reference) for experimental details.
Regards.
Yes, CO2 recapture is impeded by a contact layer but this concrete eventually is, at end of life, free to continue the reaction. Its often recrushed and used in other applications. If we are happy to talk about 800yr lags in ice cores, 50 year lags doesn’t sound so long. Also, use is now being made of CO2 injection into concrete by a firm, speeding up the process and making stronger concrete.
http://earthtechling.com/2013/05/carbon-crammed-concrete-how-it-works-what-it-does/
I wasn’t arguing against your point about subduction of carbonate (I am a geologist and engineer).
GP,
While it is true that cement takes back some of the CO2 given off in the calcining process, it doesn’t do so immediately nor completely. For massive structures, like Hoover Dam, it may have a shorter life span than what it takes for the CO2 to permeate to the core. When the dam is ultimately destroyed, the question becomes what happens to the concrete? Will it be buried in such a manner as to prevent equilibrium, or will it be calcined again to try to recycle some of the calcium carbonate?
Maybe there is a time lag?…
Rud,
“First, if Salby is right, the rise in atmospheric CO2 concentrations should have slowed or stopped because of the ‘pause’. ”
This is not especially logical to me (nobody special), since the oceans are very deep. Water now “touching” the atmosphere is the only water that can shed any “surplus” CO2 it contains, and I would expect the shedding to continue for a very long time if the high temps persists (the “pause”).
Please explain why you think the “out-gassing” would slow (or stop!) quickly, given the immense amount of water that has not “touched” the warmer atmosphere yet?
(PS ~ I realize some mixing/diffusion is going on, but this seems like a rather long term process too)
JK, you deserve a reasoned response to your good comment. Salby’s theoretical conclusion is that there is a ‘rapid’ natural carbon source response to temperature. Rapid (London video) on order of 10 months-1 year. So deep oceans are irrelevant. Only the ocean surface ( lets stipulate the mixed layer) could possibly source respond in his theoretical time frame. That is why I posted the global ocean fertility figure, then disproved the barren ocean source possibility using Aloha and BATS.
Another more mathy related disproof of Salby is that we know the ocean surface area, we know roughly the typical depth of the mixed layer (obviously depends on waves and storms) and we know roughly the dissolved pCO2 per cubic meter in that layer from measurements like at Aloha and BATS. Plus we know the Henry’s law dissolved gas temperature dependency from the lab. To a first order approximation, plus 1C should from these facts result in ~ 15ppm ocean degassed CO2 increase ignoring lags. (I skip the calculatons in this comment for brevity sake). Now if temps since 1900 have gone up ~0.6-0.7C, then this mechanism should have provided ~ 10 ppm. But CO2 has gone up over 100ppm. Just another way to disprove Salby and say its mostly fossil fuels and cement. One disproof suffices (blue barren ocean is still a sink). Two does not suffice for the true believers here. Which was perhaps part of the original point of this post. Regards.
@ur momisugly ristvan
May 13, 2017 at 3:10 pm : Your continued use of disparaging terms such as ‘true believers’ puts you in an unenviable place. It does not belong here. Only physics belongs here, and a proper dissection of the propositions and their refutations. All I see is surficial shuttling so far, though I may have missed something….
https://scholar.google.co.nz/scholar?hl=en&q=Salby%2C+Murry&btnG=&as_sdt=1%2C5&as_sdtp=
BK, I have no, zero, nada respect for those you would defend. Never, ever. Good luck with your fools errand.
PS~ Our emissions rose at an increasing rate, but Atm.CO2 seems to have risen steadily. Are you proposing the bulk of the rise is from us, but the greening kept it from tracking in a similar fashion?
JohnKnight @ur momisugly May 13, 2017 at 1:48 pm
“…and I would expect the shedding to continue for a very long time if the high temps persists …”
Yes!
ristvan @ur momisugly May 13, 2017 at 3:10 pm
“Salby’s theoretical conclusion is that there is a ‘rapid’ natural carbon source response to temperature. Rapid (London video) on order of 10 months-1 year. So deep oceans are irrelevant. “
And, Rud again displays his misapprehension of the model. The rapid response is in the rate domain. This indicates a very slow response in the absolute domain.
Allow me to elucidate. A standard, first order relaxation process can be expressed as
dx/dt = -x/tau + u
for input u and time constant tau. If tau is very large, then the steady state response is very slow. But, if tau is large, then over short timelines, we can say
dx/dt := u
where “:=” means “approximately equal”. The derivative responds almost immediately to u, but the overall response is slow.
ristvan @ur momisugly May 13, 2017 at 5:57 pm
“BK, I have no, zero, nada respect for those you would defend. Never, ever.”
The sentiment is returned. You are a dilettante, swimming in waters over your head.
Bart,
The observed exchange of CO2 between ocean surface and atmosphere has a response time of less than a year. The observed changes of DIC (total inorganic carbon) and δ13C in the ocean surface follow the changes in the atmosphere, lagging only a few years (yes, not leading).
There is a rapid response of the CO2 rate of change to temperature changes in the ocean surface of less than a year.
Thus every observation shows a rapid exchange between ocean surface and the atmosphere for CO2 (pressure) and temperature.
Thus taus are very short between ocean surface and atmosphere.
Any -slow- changes in deep ocean temperatures play – lucky for us – little role in the temperature of the ocean surface on short periods of decades or even centuries. Neither in the CO2 concentration of the upwelling waters. If we may believe the CO2 levels in ice cores, we no receive waters of around 1200 when atmospheric CO2 levels were around 280 ppmv, not 400 ppmv…
“Thus taus are very short between ocean surface and atmosphere.”
This is true.
“Any -slow- changes in deep ocean temperatures play – lucky for us – little role in the temperature of the ocean surface on short periods of decades or even centuries.”
This is mere assertion.
Thanks, Rud . .
“To a first order approximation, plus 1C should from these facts result in ~ 15ppm ocean degassed CO2 increase ignoring lags.”
But, how can one ignore “lags”, since that top water will be “recharged” with surplus CO2 from deeper water, (through mixing and diffusion) such that it can’t be a “one time” X ppm per X C rise affair, it seems to me . . and isn’t the amount/rate dependent on relative temps (Water to Air)?
John,
You don’t take into account the CO2 increase in the atmosphere. The CO2 fluxes are pressure difference dependent, not temperature difference dependent, but the ocean surface temperature of course has a direct influence on the equilibrium CO2 pressure of the oceans.
If you rise the ocean surface temperature with 1 K, the local pCO2(aq) goes up with ~16 μatm, while the atmosphere initially remains at the same pCO2. Any CO2 flux between ocean surface and atmosphere is in direct ratio to the pCO2 difference between the two. Thus at the warm uplwelling side, more CO2 will be released and at the cold sink side less will be absorbed. In both cases about 5% change in flux (of ~40 GtC/year) each.
That disequilibrium gives an increase of CO2 in the atmosphere, thus the pCO2 of the atmosphere increases. When the increase in the atmosphere gets ~16 ppmv higher, the original pCO2 differences are restored and thus the original (dis)equilibrium of before the temperature increase is restored:
http://www.ferdinand-engelbeen.be/klimaat/klim_img/upwelling_temp.jpg
There is no difference in effect for a 1 K temperature increase in a single sample or the full ocean dynamics: 16 ppmv/K according to Henry’s law.
The influence of the changes in CO2 pressure in the atmosphere are completely absent in Bart’s formula. That makes that in his theory a small step in temperature will release a continuous flow of CO2 without any effect of the CO2 increase in the atmosphere. That is physically impossible.
Ferdinand cannot think beyond a static model. It is nonphysical.
Bart,
After years of discussions with you, I am finally fed up with your contentless responses. I have extremely much patience as many here can witness. But here it ends.
If you don’t understand that I am showing the changes in a fully dynamic ocean system for temperature and pressure changes, so be it. But don’t accuse me of speaking in static terms, if you don’t recognize a dynamic response right before your nose.
In clear terms:
Don’t you understand:
That the CO2 input at the upwelling zones into the atmosphere depends of the pCO2 difference between ocean surface and atmosphere, thus also from the CO2 pressure already in the atmosphere?
The same for the CO2 fluxes from the atmosphere into the sinking waters near the poles?
That if the CO2 pressure in the atmosphere increases that less CO2 is coming in at the upwelling zones and more is going out at the polar sinks?
That this dynamic response makes that the influence of temperature is restricted to 16 ppmv/K, the same 16 ppmv/K as Henry’s law for a single seawater sample?
Thanks Ferdinand, I;m pondering, for what it’s worth, prolly not much ; )
So I wonder, if the CO2 is continuing to rise, the pressure differential has gone beyond equilibrium and the oceans are taking up more now? (I wonder about the reliability of the CO2 numbers, given that if that number doesn’t rise, it’s game over for the “cause”, it seems to me. Temps not rising can be explained away for a time, it seems to me, but if our emissions are driving that CO2 rise, they can’t both stall, and impending doom continue to be believably preached . . )
John,
It is a play between several actors: temperature dictates what at any moment the dynamic equilibrium should be, human emissions are one-way inputs, no matter what is already in the atmosphere and the CO2 pressure in the atmosphere (pCO2) above the temperature controlled equilibrium is what pressures CO2 into the oceans for every part of the ocean surface or reverse for overpressure in the (tropical) oceans. The largest differences in pCO2 between oceans and atmosphere are at the upwelling zones of the equator and the sink zones near the poles.
Thus starting with increasing temperatures and increasing emissions, the sinks may increase in an about constant ratio with the emissions and thus result in a constant ratio of increase in the atmosphere (the “airborne fraction”). That was the situation until about 2000, although even before that there were huge variations on yearly to decadal periods.
If the temperature increase stalls (as was the case after 2000) and human emissions remain increasing, then the sinks grow faster than the emissions and the remaining increase in the atmosphere stalls at a more or less constant rate, thus reducing the airborne fraction.
If humans would freeze the emissions to a constant level, still the CO2 levels would go up, but at a slower and slower pace, until emissions and sinks are equal at a higher constant CO2 level. Thus with a remaining airborne fraction of zero.
If humans would stop all emissions today, in the first year CO2 levels would drop with ~2.15 ppmv, the next year a little less and so on, until the dynamic equilibrium with the oceans is reached again at ~290 ppmv for the current average ocean surface temperature… The time needed to reach that equilibrium has a tau of ~51 years (~35 years half life time), surprisingly linear over the past 59 years…
The IPCC uses much longer time periods, but that is based on the Bern model, which includes saturation of the deep oceans, for which is not the slightest indication – yet…
“That the CO2 input at the upwelling zones into the atmosphere depends of the pCO2 difference between ocean surface and atmosphere, thus also from the CO2 pressure already in the atmosphere?”
Upwelling CO2 is coming up no matter what you do. It was set in motion centuries ago, and cannot be stopped in the near term.
Splitting the flux into two components, one in the atmosphere and one in the oceans, does no work. It cannot “push” the CO2 into the downwelling flows when the downwelling transport is being throttled by a temperature increase. To demand that it be so is constructing a perpetual motion machine, in which work is done with no additional energy input.
Your analysis is static. You are thinking of the oceans as a shallow pond of water. It is assuredly not.
Bart,
You are only digging deeper in showing that you don’t have any idea where you are talking about:
Splitting the flux into two components, one in the atmosphere and one in the oceans, does no work. It cannot “push” the CO2 into the downwelling flows when the downwelling transport is being throttled by a temperature increase.
If there was zero CO2 exchange between the oceans and the atmosphere, then any CO2 in the upwelling waters would be transported to the sink zones and sink there unchanged, as the migration speed of CO2 in water is about 12 orders (!) of magnitude slower than the speed with which the THC waters moves from upwelling to sinks. No matter the temperature changes from source (~ +30°C) to sinks (~ -1.5°C).
The “throttling” of CO2 transport into the deep oceans is a fantasy, just to rescue your theory. Because of the above slow migration speed compared to the water flow, any CO2 present in the approaching waters will sink with the waters, not migrate back to the source. There is zero accumulation of CO2 in the sinking waters from within the waters themselves. No matter any local temperature change.
Thus, besides the biological pump between ocean surface and deep oceans, the main changes of CO2 in the ocean surface waters are via the atmosphere.
That depends of temperature and concentrations at the seawater side, which gives an equilibrium CO2 pressure: pCO2(aq) which is measurable and is measured with over 3 million samples over all oceans.
That depends of the CO2 concentration/pressure in the atmosphere: pCO2(atm).
If both are equal nothing happens. If both differ, a CO2 flux starts between atmosphere and oceans or reverse. Its magnitude is in direct ratio to the difference in pressure: pCO2(aq) – pCO2(atm).
That works for every pressure difference in this world: no motor would give mechanical energy if there was no pressure difference. That works even if the pressure difference between atmosphere and oceans was not more than 1 μatm (~1 ppmv) above steady state.
To demand that it be so is constructing a perpetual motion machine, in which work is done with no additional energy input.
I repeat it here from earlier responses: The additional energy input comes from the sun:
Cold upwelling waters (which did sink with a CO2 pressure pCO2(aq) of around 150 μatm) are heated up by the sun near the equator, which increases the pCO2(aq) from what is upwelling up to ~750 μatm. The atmosphere is at 400 μatm. The difference of 350 μatm of potential energy is transformed into the kinetic energy needed to push CO2 into the atmosphere. The second push from the atmosphere (at 400 μatm) into the polar waters (at ~150 μatm) also uses the potential energy of ~250 μatm to push CO2 molecules into the cold sinking waters.
You see, the CO2 motor is running fine, transporting some 40 GtCýear CO2 from ocean sources to ocean sinks via the atmosphere…
Your analysis is static. You are thinking of the oceans as a shallow pond of water. It is assuredly not.
40 GtC/year CO2 coming in and going out in continuous fluxes driven and modulated by temperature and pressure differences is not dynamic?
As I said in an earlier note: you don’t recognize a dynamic response even if it is right before your nose…
“If there was zero CO2 exchange between the oceans and the atmosphere, then any CO2 in the upwelling waters would be transported to the sink zones and sink there unchanged, as the migration speed of CO2 in water is about 12 orders (!) of magnitude slower than the speed with which the THC waters moves from upwelling to sinks.”
Absolute nonsense. Stratification of CO2 concentration within the oceans is a well-established phenomenon.
“I repeat it here from earlier responses: The additional energy input comes from the sun:”
There is nothing about the Sun heating the water’s that forces CO2 back into them. Absolutely nothing. This is ridiculous.
“40 GtC/year CO2 coming in and going out in continuous fluxes driven and modulated by temperature and pressure differences is not dynamic?”
No. There is no dynamic response here. It’s just a magical recirculation that exists for no particular reason. It is a “Just So” story.
Bart,
You are just closing your ears and singing lalala to not read what was written…
Absolute nonsense. Stratification of CO2 concentration within the oceans is a well-established phenomenon.
This kind or responses is just diverting the attention of the lack of knowledge of the writer (or worse).
I was talking about the CO2 transport from sinks to sources by the THC, if there was no exchange with the atmosphere. Nothing to do with stratification.
There is nothing about the Sun heating the water’s that forces CO2 back into them. Absolutely nothing. This is ridiculous.
Same attitude: divert the attention from the original reaction where he said that I invented a perpetuum mobile of energy via CO2 in the atmosphere.
The energy of the sun pushes CO2 out of the hot equatorial waters, which needs energy, but that CO2 still holds enough potential energy (pressure) to sink in the cold polar waters.
No. There is no dynamic response here. It’s just a magical recirculation that exists for no particular reason. It is a “Just So” story.
Same attitude: avoid to admit that you don’t recognize a dynamic response even if it is just before your nose.
Nothing happens with that magical recirculation if the ocean surface temperature changes or the CO2 pressure in the atmosphere changes?
Ferdinand, this is absolute nonsense. Transport of CO2 through the THC is subject to the same characteristics that describe all transport phenomena, including wave phenomena, which describe alternating regions of higher and lower concentration based on boundary conditions along the flow.
Splitting of flows adds no energy, and cannot force more CO2 down that would have gone anyway. For every parcel of CO2 in the air, there was one taken out of the ocean currents themselves.
You have no mechanism for establishing equilibrium. For you it just exists, like magic.
Suggesting I do not know what I am talking about is supremely ironic, and adds nothing to the conversation.
Bart:
Transport of CO2 through the THC is subject to the same characteristics that describe all transport phenomena
Doesn’t matter, you may think of waters mixing underway via eddies, etc. Ultimately the same amount of water sinks into the deep as is upwelling. Water doesn’t pile up that easy.
CO2 in that water simply follows the flows. If there are no exchanges between neighboring waters, no biopump with the deep oceans and no exchanges with the atmosphere, then CO2 is simply transported from sources to sinks and the same amount of CO2 sinks with the same amount of water, no matter its temperature changes…
Please simplify your thoughts about CO2 in waterflows, it is not as complicated as the flow of burning gas in a gasturbine…
For every parcel of CO2 in the air, there was one taken out of the ocean currents themselves.
and
You have no mechanism for establishing equilibrium. For you it just exists, like magic.
Only if source and sink fluxes are in equilibrium. That depends of the temperature (and thus pCO2) at the source side and temperature (and thus pCO2) at the sink side and for both the pCO2 in the atmosphere.
In all cases, the CO2 flux depends of the pCO2 difference between water and atmosphere. No pressure difference, no flux.
Source and sink fluxes only can be in equilibrium if the pCO2 differences (aq to atm) at the upwelling give as much CO2 input as the pCO2 differences at the poles (atm to aq) gives as outflux. pCO2(aq) changes with temperature, pCO2(atm) changes with the disequilibrium between influxes and outfluxes.
For a fixed average ocean surface temperature, the steady state is reached through that disequilibrium when a fixed pCO2(atm) is reached. That is your not-so-magic mechanism.
Any change in temperature leads to a new fixed pCO(atm) via the temporarely disequilibrium between influxes and outfluxes.
Any change in CO2 pressure in the atmosphere leads to a disequilibrium between influxes and outfluxes that tries to reestablish the equilibrium (Le Chatelier’s principle).
We cannot complain. Most people at both sides of the debate do not understand the scientific arguments. They have taken sides for multiple reasons, but one side essentially accepts what most experts are saying and the other side doesn’t. So it doesn’t matter how much we tell them that Murry Salby is wrong, that he hasn’t been able in years to put his conjecture in writing to be examined by other experts, which suggests he knows it wouldn’t stand a chance. Since they do not accept the opinion of most experts they won’t accept ours that Salby’s conjecture doesn’t hold water either.
There are so few scientists defending that there is no anthropogenic warming whatsoever (Singer is another one) that each one of them is precious to them, no matter if they defend that the earth is flat or that more CO2 is coming out of the oceans that going in.
Javier,
What evidence do you see for measurable global AGW?
If it exist, then is it large enough to be a concern, or is it a good thing? That it is beneficial of course was the opinion of Arrhenius and Callendar.
I happen to think Salby is wrong, as do probably most skeptics, so your dig at us is also wrong.
The repetition of “global” was meant to distinguish from local.
Downtown Vegas, for instance, is probably hotter now that it was in the 1930s, which in the US and the world were warmer than now.
If you do understand the scientific arguments involved or you do accept the opinion of the skeptic experts like Rud Istvan, or Ferdinand Engelbeen that Salby is clearly and completely wrong, my dig is not at you.
Javier,
I have a decent grasp of the sciences involved, which is why I see no persuasive evidence of AGW, let alone catastrophic.
But, yes, to me it’s pretty clear that humans have contributed significantly toward accumulating more beneficial plant food in the air. The issue is what the effects of four rather than three CO2 molecules out of 10,000 dry air molecules has been since AD 1900, and what another one by AD 2100 might be.
Your appeal to experts however is IMO unscientific. As Feynman so wisely said, “Science is the belief in the ignorance of experts”. A basic grounding is necessary, of course. There actually aren’t any experts on climate change, since it is so poorly understood. That said, IMO you’re on the right track with obliquity among the Milankovitch cycles, although it might not warrant “control knob” status.
I am not appealing to experts. No expert is needed to disprove Selby as his claims are so contrary to observations. I am stating that Selby is defended by many here exclusively because he claims that human emissions are not the main cause of the CO2 increase. They don’t have many reputable scientists to chose among that would publicly defend that. How many scientists you know that will defend that there is no anthropogenic warming (none), or that the increase in CO2 is not mainly due to human emissions? Curry? No. Spencer? No. Christy? No. Lewis? No. Pielke Jr.? No. Soon? No. Haper? No. Do you know any besides Salby and Singer?
When your scientific conjectures are not shared by any scientist, you shouldn’t put too much faith on them. You are more likely to be wrong than not.
Javier,
I don’t think there is any evidence of AGW. Zero. Zip. Nada. Doesn’t mean there isn’t some. It’s just not measurable. The relevant data required even to look for it don’t exist within margin of error.
Humans have measurably made some small parts of the Earth hotter, but not enough IMO to affect global average temperature, if that could be measured to within one degree C, which it can’t. The so-called “surface series” are a bad joke. Among their many absurdities is mashing up subsurface SST with above surface land air temperature. That’s just for starters.
We don’t even know the sign of whatever human influence there might be. We do things that cool the planet, too, although again, not within the measurement margin of error.
That CO2 is a “greenhouse gas”, I’ll grant you. But that doesn’t mean that more of it in the air necessarily implies a warming world, since on a homeostatic planet, net feedbacks are more liable to be negative than positive.
That humans have probably contributed most of whatever increase in plant food in the air actually occurred since 1850, I’ll also grant you.
But there are no experts on climate change. Not you, not me, not Judith and least of all not Mann or any other CACA advocate. Reid Bryson, the Father of Climatology had it right. Bill Gray, the Father of Hurricanology, had it right. Freeman Dyson, Einstein’s heir, has it right. His Princeton colleague, physicist Will Happer, MIT atmospheric physicist Richard Lindzen and Nobel Laureate physicist Ivar Giaever all have it right. CACA is caca.
And cuckoo. An evil false religion which has cost humanity dearly. The enemies of humanity like Mann and other “experts” have squandered trillions in treasure and wasted millions of lives, sacrificed on the altar of their false god and careerist egoism.
Hubris, indeed, Javier. But, nothing supporting Rud’s deeply flawed argument. Just ad hom, and self-congratulation.
Just to your eyes, Bartemis. Salby’s conjecture is nonpunishable and he hasn’t even tried to put it in writing for years. Not even a congress presentation. Nobody really knows what he is talking about because he won’t let anybody know the details.
No, Javier. Objectively speaking. You are just finding excuses to avert your gaze, because you do not think it is fruitful to pursue one way or the other.
If you looked closely at the evidence, and if you are on the level I think you are, you would see clearly that there really is no alternative – human inputs are not significantly impacting CO2 concentration.
B, I did. There is no there, there. The further you dig your hole, the fuether you will be buried by Salby erroneous ‘conclusions’. Many already posted except for his math errors.
You didn’t, Rud. You are not even addressing the model. You are off in some La-La land of your own devising.
Anyone who accepts “what most experts are saying” today will be in disagreement with what most experts say tomorrow. It has always been that way with science. Early experts in a new field tend to get few things completely right and most things at least partially wrong. Climate science is a new enough and complicated enough field to fall into that category. We simply don’t have tools good enough or data accurate enough to be drawing definitive conclusions. We all want answers now. But life doesn’t work that way. Those who claim to have the answers, and say that the science is settled, are either lying to us or deceiving themselves. It will take time to get good answers, whether you have the patience to wait or not. One thing’s for sure, future scientists will have a good chuckle at the naivete and brash smugness of today’s climate scientists. Overconfidence is the last attribute a scientist seeking for truth should possess.
I 100% agree with that Louis. Our knowledge changes with the evidence and is always partially wrong and incomplete.
It’s even worse after 40yrs of political science and warming adjustments to make data fit a preconceived theory.
Javier, I would think you would be a bit more deferential to skeptics, particularly the scientifically literate ones. That they number few is a tribute to an individualistic and rather brave character especially these days. There are mindless contrarians to be sure and mindless supporters on the other side. The 97% idea, to me has more meaning than the quacks that cooked it up might believe. Think dissidents in the USSR, for example. Think the status quo in the USSR for the 97% that went along with the crowd (a large part out of ignorance from a propagandized education (like leftists have done to America today) and yes of fear, I admit).
Some very smart people could be wrong in their support of Salby but they are head and shoulders above the consensus science mobsters. These skeptics don’t need outlier support to grasp onto as you seem to think. Trust that they believe they have a point. The 97% on the other hand aren’t prepared to debate (they’ve had their butts kicked in the few they ventured into in the earlier days and don’t want a repeat – if they had game they would be able to lay it out for all to see). Rejoice when you see robust debate, it isn’t the norm in society any more where sound bytes are prepared for everyone to follow the correct, certified narrative.
Good post, Rud. As you show, Salby’s theory is quite obviously wrong. I have never understood why, accomplished scientist as he is,Salby ever put such an unsound and easily falsified theory forward.
That is disappointing to see. I don’t know how you can imagine that Rud’s very mistaken conception of Salby’s model proves anything.
Bartemis, I just happened to read this last night:
Letter from C. S. Lewis to Mary Willis Shelburne, February 8, 1956.
****************
For Mr. Istvan’s fans (and I can see that there are several here) please note: I am NOT equating Mr. Istvan’s (and niclewis’) intelligence with that of a dog (or even of a sloppy/dull literary critic). This is only an analogy (not a metaphor) specifically addressing the posted article.
Ms. M., this is about as “muddled” a comment page as i’ve seen in a long while. It’s almost as though everybody is sitting down to play a game of chess, but they don’t even know how the pieces move. There must be some way to advance this discussion to that of being a worthy one. As is, it’s just a bunch of muddle headed gobbledygook. (and i think bart deserves better than this)…
Besides the very real problem of verifiability, the ice cores do not have the resolution to prove your point anyway.
If half of anthropogenic inputs have stayed in the atmosphere, then half of volcanic additions must also stay. We see a definite jog in the CO2 data when Pinatubo erupted, that quickly dissipated.
It makes no sense to speak of a half life without specifying a model. If it were an exponential decay model, as you are here suggesting, then the polynomial order of the CO2 concentration would be no greater than the polynomial order of the emissions rate, which is roughly linear. So, you would not have any significant curvature in the CO2 accumulation, which we do. So, an exponential decay model is not applicable to your hypothesis.
Bart:
f half of anthropogenic inputs have stayed in the atmosphere, then half of volcanic additions must also stay.
With a sink/pressure ratio of ~0.05 that gives 5 ppmv extra at steady state (already perfomed a few million years ago, I suppose).
Human emissions still are not in equilibrium with the resulting sinks, thus still there is an increase of CO2 in the atmosphere.
If human emissions remained constant during a long time at 5 ppmv/year, the new staedy state would be reached at 5/0.05 = 250 ppmv above the steady state per Henry’s law. Or 290 + 250 = 540 ppmv…
The surprisingly linear e-fold decay rate is ~51 years unchanged in the past decades, that gives a half life time of ~35 years for any one-way injection of CO2 in the atmosphere.
the emissions rate, which is roughly linear.
The emissions curve is slightly quadratic over the past 57 years with the exception of a few economical crisis. So is the increase in the atmosphere and are the net sinks. That all gives the near linear changes in rate of change of all three. And an app. constant 2:1 ratio between emissions and increase/sinks.
Sure photosynthesising lifeforms are gagging for CO2 , the more they can get, the more their biomass will increase to exploit it. A negative f/b on increasing atm CO2. A lot of that is ocean based life as well.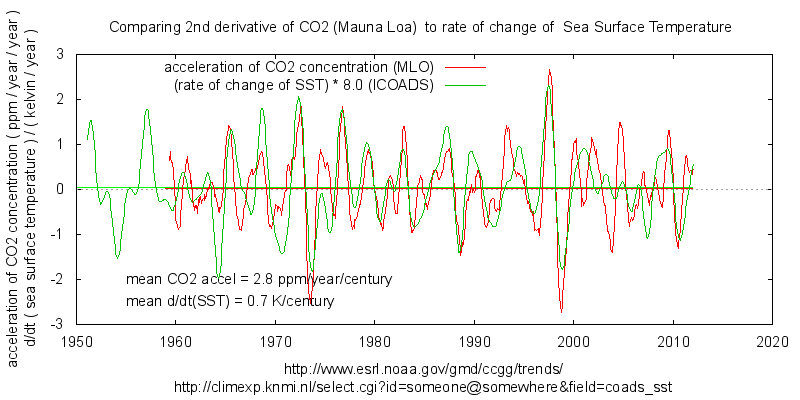
The water outgassing argument is more complex but you should at least be looking at SST not satellite derived TLT, MLT etc. several people have explored the similarity of d/dt(CO2) and temperature “anomaly”.
https://climategrog.wordpress.com/d2dt2_co2_ddt_sst-2/
The magnitude of the short term ratio is much stronger than the decadal scale ratio.
That much Salby get right. Where I remain unconvinced is on the centennial scale where I get the impression he is twisting the meagre facts to fit his hypothesis. That does not mean he is necessarily incorrect but his arguments are certainly unconvincing.
OH dear , too many links ??

Sure photosynthesising lifeforms are gagging for CO2 , the more they can get, the more their biomass will increase to exploit it. A negative f/b on increasing atm CO2. A lot of that is ocean based life as well.
The water outgassing argument is more complex but you should at least be looking at SST not satellite derived TLT, MLT etc. several people have explored the similarity of d/dt(CO2) and temperature “anomaly”.
“Where I remain unconvinced is on the centennial scale where I get the impression he is twisting the meagre facts to fit his hypothesis.”
It’s a moot point. The lion’s share of the observed rise has been since 1958, when accurate and direct means of measuring CO2 were established. In that time, the rate of change of CO2 to temperature relationship has held with extraordinarily high fidelity.
It may indeed be a fool’s game to try to match up with the pre-1958 record from the ice cores. There are no means of corroborating the ice core measurements – indeed, they do not agree with the other proxies, which have consequently been disparaged. I do not consider them validated. But, as pointed out above, there is no need for them anyway.
Somewhat of an over-statement.
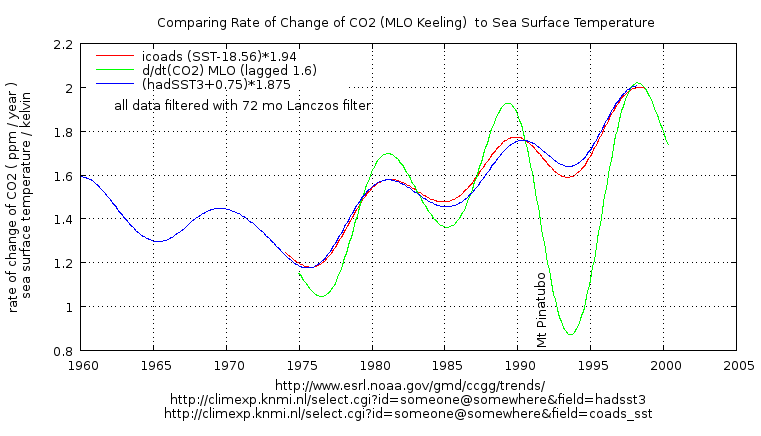
Well there is a fairly good ‘high frequency’ correlation using global SST averages after filtering out the annual cycles. That would seem to justify more detailed, regional analyses of d/dt(CO2) vs dT. I have not seen any.
Also not that the wiggles which match are on top of a notable d/dt(CO2) currently around 2ppmv/year. That could be centennial scale adjustment or simply the anthropogenic input. More likely a mix of the two.
http://www.ferdinand-engelbeen.be/klimaat/klim_img/co2_T_dT_em_1900_2011_B.jpg
“…a fool’s game…”
Ferdinand was the fool, Bart, and he did it just for you! And as you can see, the hadcrut4sh data that he used gave a perfect match at the turn of the century. (a period of slow and stable carbon growth where smoothing would be negligible) Had he extended the graph back to 1850 the data would have matched back to then as well. Even the early twentieth century is not that far off and is consistent with what we would expect with much smoothing. According to the temp data, the carbon growthrate quadruples during this time period. This should give inflated numbers in the core (and it does)…
Bart, this has been a most painful comment page to read. It’s as though we have a bunch of grown men sitting down to play a game of chess and they don’t even know how the pieces move. For God’s sake, can they at least try to understand the argument they’re critiquing? (short hint istvan et al, the temps paused and so did the carbon growth rate) It would be really nice, Bart, if folks would take the time to listen to you, so that they can at least understand what the argument is. That might then make for an intelligent discussion…
(BTW, where’s ol’ you know who?)
Greg May 13, 2017 at 5:01 pm
“Somewhat of an over-statement.”
In the realm of stochastic analysis, this is as good as it gets. It is an extraordinarily high signal to noise ratio, given all the competing influences and bulk measurements.
afonzarelli @ur momisugly May 13, 2017 at 5:17 pm
“It’s as though we have a bunch of grown men sitting down to play a game of chess and they don’t even know how the pieces move.”
Is it ever! I feel like Arthur Dent trying to teach scrabble to the cave men.
afonzarelli,
What you don’t mention is that the green line matches the observations a lot better than the red line. The green line is calculated from the emissions and the net sink rate as observed (assuming linearity in the early period too), the red line as from Bart’s formula.
If there are two competing possibilities for a reasonable match between theory and observations over a certain time span, it is normal to see if both also match over a different period. The emissions/sink rate and applying Henry’s law matches ice core and direct data over 800,000 years without any modification. Bart’s formula needs modifications (a different factor and offset) for every new period…
Ferdinand, all bets are off when it comes to early twentieth century carbon data. With the potential for smoothing during that time period who knows which of the three are the most accurate. One thing that can be said is the red line looks a lot more like the keeling curve than the other two…
Regarding deeper cores, what is your take on the impact of the biosphere on co2 levels going from glacials to interglacials?*
Who knows just what we’re dealing with on larger time scales. With a shorter time scale, like that since the LIA, the temperature relationship does just fine. We can calculate that the LIA was at least .7C cooler than the pause which is certainly a good ball park figure. We see that both carbon growth and sea level rise briefly go negative around the turn of the century. With ice cores the relationship holds wherever we have expectations of little smoothing. And to think all that i’ve just mentioned depends entirely on temperature trends of the last few decades—that should not be happening(!) And then there is the derivative plot itself. A near perfect fit with both variability and TREND features. (that’s a far cry from those who would curve fit the keeling curve to the giss data set) That’s a lot of coinkidinks that come together in one neat little package. And no amount of “hand waving” is going to make those coincidences go away…
*don’t forget to answer my question (☺)
“Bart’s formula needs modifications (a different factor and offset) for every new period…”
Perhaps. If, and it’s a big IF, the ice core data are reliable. But, that is not really a problem for me – regime changes do occur in massively nonlinear, chaotic systems.
It is a much bigger problem on Ferdinand’s side that the notion of tightly regulated CO2 levels for hundreds, if not thousands, of years is thoroughly inconsistent with the notion that they are supersensitive to our minuscule inputs over the past hundred or so years.
Bart:
regime changes do occur in massively nonlinear, chaotic systems
Except that in this case the system acts surprisingly linear to temperature changes over the past 800,000 years (~16 ppmv/K) and the system acts surprisingly linear to CO2 pressure changes in the past near 60 years (a tau of ~51 years)…
the notion of tightly regulated CO2 levels for hundreds, if not thousands, of years is thoroughly inconsistent with the notion that they are supersensitive to our minuscule inputs over the past hundred or so years.
The above linear response of ~51 years to any CO2 pressure change in the atmosphere deviating from the steady state is not fast enough to remove all human emissions in the same year as emitted, but has no problems to remove any one-time Pinatubo injection or even Tambora in a few years,
No problem either to follow the glacial – interglacial transitions at a “speed” of 0.02 ppmv/year (100 ppmv in 5000 years).
“Except that in this case the system acts surprisingly linear to temperature changes over the past 800,000 years …”
Begging the question.
“The above linear response of ~51 years to any CO2 pressure change in the atmosphere deviating from the steady state is not fast enough to remove all human emissions in the same year as emitted, but has no problems to remove any one-time Pinatubo injection or even Tambora in a few years,”
Massive self-contradiction.
Fonzie,
A very detailed study was done by Jochen Schmitt e.a. on two ice cores over the past 24,000 years, thus ecompassing the depth of the last glacial period and the deglaciation + most of the Holocene:
“Carbon isotope constraints on the deglacial CO2 rise from ice cores”
As preview:
http://epic.awi.de/30386/1/schmitt2012s_accepted_all.pdf
or with a (free) subscription direct from Science:
http://science.sciencemag.org/content/336/6082/711
Interesting
LGM-Holocene transition: +100 ppmv, δ13C change +0.4 per mil (growing biosphere).
Human transition: +110 ppmv, δ13C change -1.6 per mil (growing emissions)…
Bart:
Begging the question.
Vostok ice core (420,000 years) CO2 vs. T:
http://www.ferdinand-engelbeen.be/klimaat/klim_img/Vostok_trends.gif
Where most of the deviation from the trend is from the lags of CO2 after T changes, especially at the onset of a new glaciation…
(note that the 8 ppmv/K is for polar temperatures, global more around 16 ppmv/K)
Massive self-contradiction.
With a half life time of ~35 years for any CO2 injection in the atmosphere above steady state, the Pinatobo injection at ~ 0.05 Gt CO2 or 0.014 GtC or 0.007 ppmv was not even measurable. The largest eruptions in the past millions of years like the Tambora, even with a 100-fold emission over the Pinatubo, thus around 0.7 ppmv CO2, would desappear rapidly.
If we may assume a constant supply of ~0.1 GtC from all CO2 outgassing and all volcanic eruptions over the years, that is good for 2-3 ppmv increase over the steady state…
Response misplaced here. This thread is too long.
NL, dunno, Maybe there is lots of oil money to be made. Not by me. TY high praise never the less on this little post, on more shakey research footings than my last Fisker Nanotech post at CE ( where I am a true SME). Appreciate your comments on both. I do try to stay true to Beacon science roots. Helps with my now 13 issued US patents. Guess I have to update that again. Never understood why playing the person was equivalent to playing the issue. Graphic illustrations here this post.
NL
Have you parsed Hermann Harde’s recent paper that posits the alternate interpretation of IPCC data that results from Salby’s work? His conclusion is “Our analysis of the carbon cycle, which exclusively uses data for the CO2 concentrations and fluxes as published in AR5, shows that also a
completely different interpretation of these data is possible, this in complete conformity with all observations and natural causalities.”
Thanks Nic
I wish that more skeptics would get that the real fight and debate is on the ground you have selected to fight on.
There is a REASON why Parliment calls on you to testify… YOU DID SCIENCE!
unlike salby
Imagine if the collective brain power of WUWT focused on the real problem.
Instead these guys believe a YOU TUBE VIDEO.. WTF?
A video …That has not been written up
that has NO DATA
that has NO CODE
They like the answer Salby gives, so forget the details like SHOWING HIS WORK
Jeez
Do you realize that you do polemic, not dialog? Politics, not thoughtful discussion? Rhetoric, not science? Just checking. It’s funny how fatuous you are without having any sense of it. I learned long ago that one can’t teach others to see themselves.
How does a concentration stop?
ristvan have you considered that CO2 could be released by natural sources when environmental temperature is greater than a threshold level and absorbed by natural sinks when temperature is less than the threshold level. The behaviour above and below the threshold may be non-linear.
You appear to imply that Salby expects CO2 concentration “rate of change” to be related to temperature “rate of change” rather than the actual value of temprature on decadal time scales. The pause was at a warm level – a decadal pause in temp change could mean no change in the rate of CO2 release if CO2 release is related to temperature ?
makes sense….
I asked you to study Salby’s videos if you had not. Gave reference coordinates. Pathetic.
An interesting article. My critique includes:
1) “Dr. Murry Salby has been getting substantial attention in the climate blogosphere, for two reasons. First is his theory that at least 2/3 of the observed increase in atmospheric CO2 is natural and temperature induced.”
I disagree with Salby here. My view is that 100% of the increase is natural.
2) “The seasonality of the northern hemisphere terrestrial photosynthetic sink is apparent in the Keeling curve, as is the temperature/CO2 discrepancy disproving Salby.”
This is the old Al Gore theory. No, the seasonality is (obviously) due to Southern Ocean temperature changes.
3) “First, if Salby is right, the rise in atmospheric CO2 concentrations should have slowed or stopped because of the ‘pause’. They haven’t. They bear no short or long term relationship to one another.”
The temperature pause is a measure of land and sea surface temperatures. The sea surface temp has increased very slightly to give us the continuing rise as per the Keeling curve. Land surface temperatures have decreased slightly to give us the overall pause result. The lowering land surface temperature is a worrying trend given the recent lack of sun spot activity.
4) Nice to see some traditional science appears in this argument:
“Barren ocean regions are mainly influenced Henry’s Law and Le Chatellier’s Principle.”
Why the comment is confined to “barren oceans” is beyond me. HL applies to all water/atmosphere surfaces and LC is an integral part of the three dissolving stages of CO2 into the oceans.
If the seasonality was due to Southern Ocean temperature changes, then wouldn’t the seasonal variation in CO2 be highest over the Southern Ocean? It isn’t, it’s highest in the NH.
In fact the strongest annual swing is at Arctic sites like Barrow and Alert stations. So the same logic says that it is the cold water sink of the Arctic which is driving the global change, not the US or China burning coal.
And “global warming” is strongest in the Arctic. Doesn’t that mean that the Arctic is driving the warming not fictitious
“polar”Arctic amplification?https://climategrog.wordpress.com/co2_alert_fit/
Hi Mike,
The katabatic winds over the antartic during winter ensure the atmosphere is well and truely mixed.
Robert Beatty
That’s a pretty strong statement given that the Antarctic is a continent, whose total ice area (land + shelf +sea ice) alone at maximum sea ice is larger than all other land masses south of the equator.
Would Santa Ana winds in California affect the distribution of acid rain particles in Ontario? Only limited valleys around Antarctica have the high sustained winds that are advertised so frequently. Do the high waves photo graphed at some beaches off Australia mean every beach off of Australia has great surfing? If adiabatic winds occur at the base of individual glaciers in specific valley outlets… what is their speed and area 1000 kilometers away at the edge of the sea ice, and 5000 kilometers away , then 10000 kilometers away?
I’m serious:

Much of the weather of Europe and N. Am is driven by Arctic polar vortex. The typical land+ocean “global average” is biased in favour of land SAT because it is more volatile. That land bias means that he “global average” is NH biased. It is quite credible that Arctic polar vortex influences the defective “global average temperature” which everyone is bed-wetting over.
The 1998 super El Nino was pre-saged by a notable swing in N. Atl Oscillation:
Yes, but Mike, there is less ocean for co2 to sink into in the NH…
Greg – The statement referred specifically to Southern Ocean temperature change, not to anything else in the SH, so my comment was aimed at that. The seasonal swings in the far south, eg. Baring Head, S Pole, are not just lower, they are almost non-existent, while from the tropics to the far north they are high. I think that pretty well rules out the S Ocean as the driver. Yes, the strongest annual swing is in the far north. But that doesn’t necessarily mean that it’s the Arctic water that is driving, it could be the NH flora. The seasonal swings are not hugely different from Barrow to the equator, just a bit higher at Barrow. And I think you will find that Barrow is as close latitudinally to the NH flora as any other CO2-measuring station.
“I think that pretty well rules out the S Ocean as the driver.”
The tributaries of a great river are all small. The pileup of water occurs where resistance to the flow is greatest.
Life turns CO2 into coal, oil and the cliffs of Dover. That is a sink.
If warmer water is outgassing this will lead to a reduced sink and an increased dynamic equilibrium level. Just saying “sink” does not form a conclusive point.
Greg,
Implicit in your definition of a “sink” is the length of time the CO2 is sequestered. However, I have never seen anyone specifically define how long something needs to be sequestered to be considered a sink.
If you pore water down the sink and it comes back up in the toilet, the sink is still sink. You have a new source to take into account.
“First, if Salby is right, the rise in atmospheric CO2 concentrations should have slowed or stopped because of the ‘pause’. They haven’t.”
Now this makes me pause. If we know that natural causes do not stop and start rapidly (IE: 800 year lag), then any assumption that a rise in CO2, when the warming has stopped or paused, is man made would be totally in error. The degradation of plant matter would continue to force rise for many years even though the plants themselves would slow in growth. Salby’s model does not say there would be a slowing of CO2 rise. I am not sure where you came to this conclusion.
Again, too simplistic. Water is rising from the cold depths, sinking in the Arctic and absorbing or out-gassing at moderate latitudes. Area of exposed water in Artic has changes notably in recent decades.
If the discussion is Henry’s law ; Feck;s law etc. starting with UAH TLT is not the most relevant dataset.
Salby’s point there is that temperature affects the rate of change, the ppmv increase year to year. If the temperature plateaus, the yearly increase should remain about the same, not drop to zero as Rud suggests. I’ve plotted the annual data for all 12 months of the year, January to January to January, etc., and the correlation remains strong.
ristvan – Thanks. Good analysis, good article. To my mind too, Murry Salby’s numbers don’t stack up. I did a whole heap of calculations some years ago, and concluded that the late 20thC CO2 increase was something like 94% from man-made CO2, 6% from natural. One counter argument at the time was that the oceans were absorbing half the man-made CO2, so the natural contribution must be zero. This counter argument was incorrect, the point being that without the man-made CO2 the warming oceans would have provided an increase of around 6% of the actual observed. But this brings me to my main point in this comment. You say “The ice core based CO2 lagged change to temperature is about 800 years, common sensically corresponding to the thermohaline circulation period.“, and that seems to be generally accepted (but see [1] below), but I think there are two separate timescales. There is another much faster CO2 response to temperature from the upper layer of the ocean, as per Henry’s Law, Revelle Factor, etc. I worked out that it had a half-life of around 12 years – ie, that the ocean-atmosphere CO2 transfer was at a rate that would halve the ocean-atmosphere CO2 imbalance in around 12 years. Then there is a quite separate and longer timescale driven by the deeper ocean.
[1] Yes, this is the theory re the 800 years. I have never seen anyone explain the way it actually worked, ie. the mechanism. I must be missing something, because the CO2 transported by the THC and re-released after 800 years seems to have had to come from the ocean in the first place. So it could easily explain an 800-year cycle, but to my mind cannot explain an 800-year lag in a longer cycle.
It’s a hand-waving attempt to explain away the 800 lag and thus retain the idea that CO2 is driving temperature. Since we have not been doing deep ocean circulation observations for that long. I doubt even the 800y figure is anything more than a convenient guestimate. But hey, this is climatology, not physics.
I doubt that Hansen predicted anything that he did not rig in advance.
the lag wwas predicted by hansen
and its no problem.
watch this
Cool, statisticians realise that regressing two sets of error laden variables gives a biased estimation. When will climatologists account for that when regressing Rad on Temp and getting an exaggerated ECS?
Steven – At the time that Hansen predicted the 800-year lag, had it already been observed in the ice cores? It seems to me that prediction of something known is a bit easier than prediction of something as yet unknown.
I didn’t know that [if?] Hansen predicted the 800-yr lag. Can you find me a reference to that. If he did predict, that is very strong evidence that he knows what he is talking about.
“I didn’t know that [if?] Hansen predicted the 800-yr lag. Can you find me a reference to that.”
I think the allusion is probably to this Nature paper (Lorius et al) on which he was a co-author. It was in no doubt that the CO2 response was a feedback; they calculated that it contributed from 40-65% of the change. Their analysis didn’t depend on the phase relation, and I didn’t see one predicted. They say:
But I really don’t see the reason for making an issue of the phase lag. It has long been understood that ice age changes were caused by orbital changes, that CO2 changed in response to temperature mainly in the oceans. Here is the AR3, 2001, setting it all out:
“Orbital variations (Berger, 1978) are the pacemaker of climate change on multi-millenial time-scales (Hays et al., 1976). Atmospheric CO2 is one of many Earth system variables that show the characteristic Milankovitch periodicities, and has been implicated as a key factor in locking natural climate changes to the 100 kyr eccentricity cycle (Shackleton, 2000). Whatever the mechanisms involved, lags of up to 2,000 to 4,000 years in the drawdown of CO2 at the start of glacial periods suggests that the low CO2 concentrations during glacial periods amplify the climate change but do not initiate glaciations (Lorius and Oeschger, 1994; Fischer et al., 1999). Once established, the low CO2 concentration is likely to have enhanced global cooling (Hewitt and Mitchell, 1997). “
Terrific! A lecture on complex physical relationships by an economist! How quintessentially Mosher.
“Good analysis, good article.”
Mike, how can you of all people say that? i know that you know that it’s the RATE of carbon growth that varies with temperature. i also happen to know that you know that the mass balance argument is bunk. Other than those two arguments, there is not a whole lot else presented in Rud’s piece (save the satellite co2 data)…
(oh, yeah and that 800 year lag thing that just so happens to be missing in shallow ice cores)…
afonzarelli – Rud’s article was chiefly a crit of Murry Salby’s arguments, and I thought his analysis of those was good. I’m not sure which part of my temperature-CO2 knowledge you are tapping into re the “RATE of carbon growth that varies with temperature“. There is indeed a very strong correlation between annual change in atmospheric CO2 and temperature [as first(?) identified by Frank Lansner], which tallies exactly with what you say. But those annual changes in CO2 are really just wiggles on a trend where the trend is much larger in scale and tallies quite well with man-made emissions. So while I do think that some CO2 variation is T-caused, the great majority does seem to be man-made.
OTOH, I – like you apparently – am somewhat dubious about the 800-year lag.
afonzarelli – Sorry, I should have addressed your other point too – the mass balance argument. The mass must balance, but any particular set of mass balance figures may or may not be junk. My view is that there are too many unknowns for any of the proposed mass balances to be reliable. But then, Rud Istvan’s arguments don’t rely on a particular mass balance.
Mike, i oft quote you on the mass balance argument because you are the only person who has ever stumped ferdinand on it! Like FE, Istvan is saying that since the oceans are a net sink, they can’t be a source at all (zero, nada, nilch). Your argument (to ferdi) says that if even a small part of the rise depends on the existence of a natural imbalance, then the rise is at least part natural…
Also, you once produced a graph showing the close relationship of temperature to rate of change of the carbon growth rate. (i used to use it, but it confused people because it had temps lagging co2; i think it used a thirteen month median which ended up doing that) If what you’re saying is true, then there is no reason that your trends of temps and rate of changes (of co2) should match as well as the variability. Think about it. Now, what i’m saying doesn’t mean the rise is necessarily natural. It only means that the rise, anthro or not, is temperature dependant both short term and long term. And as more than a few comments hear have noted, Istvan dropped the ball on that point. (the pause in temps corresponds with a pause in the carbon growth rate)…
Mike Jonas, Frank Lansner wasn’t the first to recognise the CO2 thermometer in 2008, Jarl Ahlbeck wrote a contribution on John Daly’s website already in 2001
https://www.john-daly.com/co2-conc/updated.htm
afonzarelli,
Your argument (to ferdi) says that if even a small part of the rise depends on the existence of a natural imbalance, then the rise is at least part natural…
Seems a rather strange reasoning: in some years (like during an El Niño) the biosphere as a whole is a net source of CO2, but as the oceans still are a larger sink, even with warmer oceans, the net sum of all natural sinks and sources stil is a (small) net sink. Thus the natural contribution to the CO2 increase in the atmosphere even in El Niño years still is zero…
The only part where I can admit (with reluctance…) a natural contribution is the influence of temperature at a maximum of 16 ppmv/K per Henry’s law, as that would happen even without human emissions…
The average lag of atmospheric CO2 behind surface T evident in the Vostok core data doesn’t imply that it, along with water temperature, was transported virtually unmodified by THC, reappearing ~800yrs later at the surface. This is the “global conveyor belt” meme that is uncritically accepted in “climate science,” but is dismissed by qualified oceanographers as sheer fantasy. It completely ignores the highly stable temperature stratification of all oceans and the inevitable mixing of water masses in transport.
While there seems to be little reason to doubt that the secular rise of Mauna Loa CO2 is indeed primarily man-made, it’s relationship to modern-day surface temperatures needs to be clearly understood. Cross-spectrum analysis of season-suppressing yearly averages shows that delta-CO2 invariably LAGS surface T, when coherent, and is otherwise unrelated. The lag, however, is orders of magnitude less than 800yrs! Nevertheless, it falsifies the notion of CO2-driven T variations.
Because of the ice cores, the 800yr lag of CO2 behind temperature rise seems to have become a logical box that many can’t escape from. It is perfectly possible for their to be such a lag on this scale, but it doesn’t rule out that a coca cola from the icebox in a warm room with the lid off will become flat in an hour or so. Doesn’t the post 2016 El Nino show a measurable increase in CO2 over the pre El Nino as per an illustrate post above:

First two weeks of June 2015
First two weeks of June 2016
Or have I got this wrong.
That looks like less CO2 after the 2015-16 El Nino rather than more.
The atmosphere is all about chemistry, physics, heat transfer and thermodynamics. You want an expert trained in those topics, certified in those topics, whose career is actually applying those topics check with a experienced chemical or mechanical engineer.
The world is still recovering from LIA and has seen 300y of general warming. Ice core record shows a lag of around 800 years. Why do you expect atm CO2 to stop dead in its tracks on a sub-decadal timescale?
Since nowhere in the article do you seem to be examining d/dt(CO2) against temp. anomaly which was Sably’s basic point about orthogonality, it seems that you have totally missed to point of the work you are aiming to criticise.
Maybe you should have taken the time to dive deep before diving deep into counter arguments.
@ur momisugly Greg
May 13, 2017 at 4:44 pm: Thanks Greg, that was a point I noticed too. Still waiting to learn if Salby was ever included in the debate as one would reasonably expect. We have no reason to be enemies.
I agree with ristvan,


Salby’s model is based on mathematical errors and logical errors.
The airborne fraction of human emissions to that remaining in the air of 2.2 to 1.0 falsifies the proposal.
The ice age CO2 ppm to Temperature ratio of 19 ppm to 1.0C falsifies the proposal.
The change in CO2 back to 0AD versus GISP2 temperatures does not lead to one to really any conclusion other CO2 likes to be at 280 ppm in non-ice age conditions.
The change in CO2 per year going back to 0AD versus human emissions clearly indicates we are responsible for the recent increase.
But then the natural absorption/release rates were many times bigger than our emissions until recently.
Overall, it appears the math works when one assumes that the natural level of CO2 in non-ice age conditions is about 280 or 275 ppm. When the concentration in the atmosphere rises, the natural absorbers begin to work harder and harder but all they manage is 1.8% per year of the excess above the equilibrium rate of 280 ppm.
We do no have to cut our emissions to Zero to stop the rise in CO2. The natural absorption rate will eventually catch up if we start limiting the growth in emissions. In the last three years, there has been no growth in human emissions so it is very possible with just more efficient natural gas power production for example.
Sorry Bill, your second graph is Mann-Jones hockey stick grafting two incompatible datasets in the same colour with no indication of what data is used nor that graft you have done.
No cookie.
Your third graph contradicts Ristcan’s claim that CO2 did not slow down during ‘the pause’. It did. I seems to have stabilised at around 2ppmv/year rather than the steady acceleration of late 20th c.
Also as emission controls start to bite and human emissions ease off in the last few years, the “actual” CO2 change rocket’s off again. On the crude scale you show this seems to correspond to the 2011-2015 “super El Nino”.
The annual CO2 increase is affected by the ENSO. It rises much less in a La Niña and much more in an El Niño.
Let’s say in average ENSO year right now, CO2 would increase by 2.3 ppm.
In an El Niño, this would jump to 3.0 ppm but in a La Niña it would increase by just 1.6 ppm.
But let’s go back to the biggest Supe-El Nino on record, 1877-1878. This was truly a remarkable El Nino. But CO2 only rose by 0.1 ppm in that year.
It obviously depends on human emission rates or actually more accurately, how far away the number is from equilibrium of 275-280 ppm.
But let’s go back to the biggest Supe-El Nino on record, 1877-1878. This was truly a remarkable El Nino. But CO2 only rose by 0.1 ppm in that year.
Bill, think about your sinks…and biology .when something like CO2 is limiting….plants, algae, bacteria, on and one…..grab it fast and more of it
The biggest problem I see, trying to compare now with then…when we really don’t understand either
That is a very foolish statement to make, since accurate atm CO2 only started in 1958. You still have not even said what the data you are using in your graphs is ( the early stuff you grafted on to Scripps data like it was the same thing ).
What time resolution does you data have ? It is presumably ice core of some sort. There are enormous questions about about firn closing times , diffusion etc. One that that is certain is that you do not have annual resolution and it will NOT capture the annual swing of that year.
Maybe we should look at an event for which we do have data. The 1998 event shows a massive swing in dCO2
https://climategrog.wordpress.com/co2_sst_regression_nino98/
Interesting stuff Bill, but how do we know CO2 numbers are that accurate?
7 years ago right here on WUWT, David Middleton made a guest post about CO2 levels of the past, showing that Ice core CO2 data are not that reliable,it is probably too low.
It is worth reading.
CO2: Ice Cores vs. Plant Stomata
https://wattsupwiththat.com/2010/12/26/co2-ice-cores-vs-plant-stomata/
I think the ice cores are accurate (can I say to the extent that the climate scientists haven’t mucked around with them like they have the surface temperature record).
Stomata appear to be reasonably accurate as well but then this depends on what time of the year the fossil specimens were laid down. On a local basis, CO2 can be as low as 250 ppm or as high as 2000 ppm. Throughout the day, one could see those kind of changes and throughout the seasonal cycle, one could see those type of changes.
The local vegetation will have responded to those levels but maybe they were buried at 9:00 am in early Spring and as a consequence they will indicate a high CO2 level.
Climate Science likes to use a proxy of Carbonate from fossil soils or paleosols. But this as well depends completely on the time of year and the precipitation levels that existed at the time the fossil soils were isolated and buried. The methodology can even record a completely impossible 0.0 ppm CO2 but climate scientists keep using it because they get to distort the record by using it. Really, they use a time series that contains 0.0 ppm 7 different times but 1,000 ppm on the other timelines but because they can cherry-pick, they keep using these fake paleosols numbers.
Stomata are100 times better than this and seem to match up reasonably well with what we know. But it is just not as accurate as the ice cores for an individual year like 1825 or 1080 or an average 1860 to 1880.
I think of stomata as being as secondary confirmer only.
Stomata from the Eemian show 330 ppm, if IIRC.
Thank you for your quick reply,Mr. Ellis.
The problem I see is the lack of Stomatal data,which is a shame since this is a significant Botanical response,to what is available at the time of ingesting the raw materials it needs for the Photosynthesis process. Surely they vary over time due to the regional environment they grew in, also varies. The Ice core data is TOO smooth ,when ALL other data from plants,chemical analysis ,shows significant variability as shown by David in his guest post.
David made the point in his guest post,that we lack precision and data to be sure the CO2 levels are actually a true marker of the atmosphere,at a point in time. That is why I think this needs to be investigated much more bringing in new data from various places,to develop a firmer data base with better resolution.
Rud, Dr Salby is correct. There is a natural source of CO2 which
increases with temperature.
First, a description of a recent experiment I performed on some decent
topsoil.
With a reasonably accurate CO2 meter, I measured the ambient CO2
at 6′, 406 PPM.
I then took a stainless steel salad bowl, inverted it and put the
CO2 meter under it, and put a 10 lb weight on the bowl.
12 hours later, I retrieved the meter. It read 1384 PPM.
Frozen ground stops the upwelling natural gas and greatly diminishes
or stops the microbial consumption of the gas which slows or stops
the production of CO2. Warm earth speeds the flow of natural gas
and encourages the microbes to bloom. The CO2 thus increases.
The atmospheric level of methane has greatly reduced its level of
rise. I believe increased microbial consumption that is more comfortable
in the warm topsoil is responsible.
Topsoil is not a sink for CO2, it is a source. My very simple and easily
replicated test proves this.
https://www.bing.com/images/search?view=detailV2&ccid=cE7lDPFa&id=
AD5AFF374A7573A0AF51BCCAA6DB23DE13F4E50F&thid=OIP.cE7lDPFa
YXj9Iqs2o46PBQEsCL&q=CH4+increase+vs+CO2+increase&simid=
608038495807210159&selectedindex=21&ajaxhist=0&first=1
I also agree with Dr. Salby on the reliability of ice core CO2 readings.
CO2 readings at ground level are highly localized, as my simple experiment
and historical leaf stomata prove.
Dr. Zibgniew Jaworowski’s work and my findings convinced me that the ice
core readings are useless.
http://www.warwickhughes.com/icecore/
With no sensitive historical readings of CO2, we do not know if the
current readings are even high. I doubt it.
Geological CO2 records are probably accurate but a blunt instrument.
Jerry, nice try but fail. Topsoil is at most 49 percent of CO2 sinks/aources. So your basic math fails on basic sink/source math.
Mr. Ristvan,
Your critique shows a lack of understanding of the processes involved. Salby said there is a lag at all time scales. This is not unknown. The CO2 is a dynamic quantity that changes rapidly locally and regionally driven by Primary Production, Respiration along with abiotic chemical and physical processes. OCO2 if you read the instruments description, only measures an average at the same places and times over a 16 day cycle to determine world co2. While this is interesting it doesn’t show the massive sources and sinks that exist but are regularly measured and evaluated by a wide number of people who are interested in trying to understand this very complex subject. I only post because you are not listening to someone who has a valid critique. Well done Mr. Hanson.
v/r,
David Riser
Jerry,
Please let Dr. Jaworowski rest in peace, together with his ideas about ice core CO2. He was an expert on radionucleides in ice, but as far as I know never performed any CO2 analysis. His remarks are mainly from 1992, completely refuted by the work of Etheridge e.a. on three Law Dome ice cores. Ice cores CO2 is reliable if you take a lot of precautions. There is even an overlap of ~20 years (1960-1980) with direct measurements at the South Pole…
Dr. Jaworowski made several real stupid errors like migration of CO2 from low to high levels, his “reason” why one measures too low CO2 levels in ice cores. If you measure 180 ppmv in the ice core bubbles and the outside atmopshere in the lab (or during storage) is 350-380 ppmv, how can CO2 migrate from inside to outside the ice core? See:
http://www.ferdinand-engelbeen.be/klimaat/jaworowski.html
Topsoil indeed is a source of CO2, but not more that in the previous year(s) leaves and other material was put down, thus that can’t release more CO2 than was captured first out of the same atmosphere. In general a null-operation and currently a net, growing sink for the whole biosphere.
CO2 readings at ground level are highly localized
Yes, therefore many of the historical measurements are worthless, as they were taken midst of towns, forests,… Only those taken on board of seaships and coastal with wind from the seaside are of interest. These show values around the ice core averages…
Modern measurements are made on top of barren mountains, ice deserts (Antarctica), islands in the middle of the oceans, in the atmosphere by airplanes, seaships,… They show little variation in the bulk (95%) of the atmosphere and mainly seasonal in the NH.
Ferdinand @ur momisugly 10;50 am
The reason that CO2 levels are highly localized is that they are the result
of the hydrocarbons which perk up from deep in the earth being oxidized by
microbes.
This is not a theory of mine. I have proved it by experiment in different types
of topsoil. It requires work to dig through the topsoil, through any biomass
and worm castings.
The topsoil in Kansas I tested was more than a meter thick. Lots of digging.
Hydrocarbons perk up all around the earth, but they are not evenly distributed.
The shield in the area around Atlanta, Ga is close to the surface and blocks
the hydrocarbons. Very poor topsoil.
This is a very important finding, because it means that just about everything
you have read about topsoil is wrong.
A good example would be that the deep topsoil in Kansas was created
by deep rooted tall grass. The reverse is true. Over time and through
many fires and droughts, the plants with the deepest roots survived
when others did not, becoming dominate.
Because I do not have a PHD, I have not been able to garner interest
in my results. WUWT gives me a forum which I very much appreciate.
My findings mean that Dr. Thomas Gold was correct. Hydrocarbons do perk
up from deep in the earth and always have. The millions of years of layers
of carbonate rock witness that fact.
This means that hydrocarbons are a renewable resource and that we
will never run out. The Russians know and understand this fact and the
Saudis benefit from being on a fault which directs the heavier molecules
right to their fields.
What I request is that people who think that I am wrong find some good
upland topsoil and do a test.
It requires some work, but my findings are easily replicated.
“There is even an overlap of ~20 years (1960-1980) with direct measurements at the South Pole…”
Wow, a whole 20 years !!!! You have no idea about the long term (probably exponentially reducing but who knows) disolution of CO2 in ice under increasing pressures or assumed short term recovery rates in a lab. Nor has anyone else. Too many assumptions, limited credibility. Sorry, small round filing device in the corner,
“Ice cores CO2 is reliable if you take a lot of precautions.”. Circular logic. First understand and prove the physical processes at work in appropriate timeframes.
AJB,
Please, have some more digging in the scientific literature before commenting…
Ice core specialists are not stupid, they know the pitfalls and try as much as possible to avoid them.
Ice cores are laid down at -20°C for relaxation for at least a year. During that time, they expand with some 50% in volume. Most clathrates formed under the high pressure of ice then decompose again and bubbles regrow.
Ice core measurements are done by grating the still frozen ice under vacuum, freezing water vapor out over a cold trap and measuring CO2. That recovers about 70% of all gas and vacuum destroys near all remaining clathrates in the opened bubbles.
The alternative method is sublimating all ice under vacuum just under melting point with an IR lamp and cryogenically freezing everything out and later selectively evaporating each part and measuring everything on a mass spectrometer, thus including the isotope ratios. No CO2 can hide anywhere in that way.
I know 20 years is short, but already a good check for the best resolution (~10 years) ice cores of Law Dome, spanning the past 150 years. The next ice cores span ~1000 years (resolution ~20 years) and match the first over the most recent 150 years, The next core spans 70,000 years (resolution ~40 years) and match the second over the most recent 1000 years and then we have one of 420,000 years (Vostok) and one of 800,000 years (Dome C, resolution ~560 years). All these ice cores, with extreme differences in temperature, accumulation rate, layer thickness,… show the same CO2 levels for the same average gas age within a few ppmv, including a trapped check of each other.
Thus in my opinion, ice core CO2 levels are very reliable, but are (assymetric) averages of CO2 levels in the ancient atmosphere over periods between 10 and 560 years,
“No CO2 can hide anywhere in that way.”
Except that which likely already escaped by diffusive means (solute or gaseous) over extended time. I agree, we are looking at long term averages with limited resolution as indicated by stomata studies. Not sure what you mean by ‘assymetric’. But even if you improve the resolution, physical diffusive mechanisms will still have fudged out the variability over unknown, inconstant timescales. And since they’re not fully understood, possibly affected the longer term calibration too. Usual arguments reasonably well summarised here.
AJB,
Diffusion over time goes from higher to lower levels. If we measure 180-300 ppmv in ice cores, it is impossible that real levels in the atmosphere were below 180 ppmv, or C3 plants were in serious trouble. Worst case, the levels were higher, as in some periods the stomata data show. Migration from low to high levels? Dr. Jaworowski made that error, unbelievable for an ice core specialist.
The main advantage of stomata data is the higher resolution, the main disadvantage is that these are a proxy for local data on land, where there is in average a positive bias over “background” CO2, That is compensated for by calibrating the stomata data against ice core data and direct measurements over the past century. The problem is that nobody knows how the local bias changed with land (use) changes over the centuries in the main wind direction. Even the main wind direction may have changed in certain periods (MWP-LIA)…
Thus in my opinion, stomata data are good indications of more (local) variability and resolution than ice cores, but of the average of the stomata data differs from the average ice core data over the period of resolution of the ice core, the stomata data need recalibration, not the ice core data…
Assymetric: take the high resolution (~10 years) of Law Dome: the pores in the ice are gradually decreasing with depth and after 40 years so far closed that any migration virtually stops.
The first years, the enclosed air freely exchanges with the atmosphere, thus its age is the same as in the atmosphere. As the firn get denser, it takes more time to migrate, so the average age of the enclosed air lags the atmosphere and at 72 m depth (40 years ice layers), the migration stops at average 7 years older air than in the atmosphere with an average range of ~10 years for the bulk, with a long, small tail up to 40 years old air.
Bill Illis, this is a compelling and easy to understand presentation. Are you aware of the call for comments by the EPA on the Executive Order:
https://wattsupwiththat.com/2017/05/12/three-days-left-to-submit-suggestions-to-repeal-epa-regulations/
This is a perfect contribution, especially the issue of Natural Gas effect on CO2 accumulation in the atmosphere. I urge you to submit it. There is a link.
Ah… Satellites.
ristvan,
You said, “He observationally bolsters his conclusion by ‘showing’ that highest CO2 concentrations are over relatively uninhabited/unindustrialized regions like the Amazon basin, so must have natural origins. The following ‘observational’ figure is from his Hamburg lecture. Except it is completely disproved by OCO-2.”
I don’t see that your claim is supported by the released OCO-2 maps. If you go to http://wattsupwiththat.com/2015/09/15/are-the-oceans-becoming-more-acidic/ , and scroll down to the NASA/JPL illustration I provided, I think that you will find a resemblance to the Salby map. In particular, the Amazon Basin and southern Africa both show high levels of CO2, similar to Salby’s map.
CS, i provided links to NASA at the time. Even provided contemporary figures in the post. And then noted OCO-2 was even worse. What part of that do you not yet get?
OCO-2 does in fact show some of the highest CO2 concentrations over uninhabited WINTER forest regions. Lower Northern Hemisphere concentrations as in the depicted image are demonstrated in the summer, when photosynthesis is more active there.
Do note as well that generally increasing temperatures will promote significantly increasing microbial activity, which composes most of Earth’s biosphere and thus carbon cycle.
ristvan,
You asked, “What part of that do you not yet get?” Apparently none of it and I’m not a dimwit. So, ask yourself why the disconnect? You claimed that Salby’s Hamburg figure is “completely disproved by OCO-2.” I provided a link that, to me, bears a strong resemblance to Salby’s figure. If by “links” that you provided you mean the two figures, I can’t read the associated text even after zooming in 150%. Even so, what appears to be the most recent data, albeit with a different color scheme, is not all that different from the illustration in the link I suggested. So instead of reverting to your all too common arrogant response, please be more specific in how your “links” completely disprove Salby’s figure.
Yes, but Clyde, the amazon and congo are not sources of co2. They just pull it in out of the atmosphere and release it via dead biomass. (analogous to a back yard pond that collects debris but does not produce it)…
afonzarelli,
Sources and sinks can be interchanged with the seasons. You didn’t define “source.” Therefore, I’ll give you my definition: A CO2 source is any area on the surface that for at least part of the year has a CO2 concentration that is above the median, irrespective of the mechanism that is producing the CO2. Therefore, the Amazon Basin may be a sink and a source, but is acting as a source for the OCO-2 map I cited. Your pond example might be considered a ‘sink’ for debris. In a similar manner, the polar sinks do not produce the CO2 they are removing.
Clyde, the only reason that the amazon and congo are “acting” as sources in your map is that they gather co2 at those places and releasing it through dead biomass. In your map, those areas are not adding anything to the atmosphere that they haven’t taken from it first (save deforestation). That’s THE reason that they are showing up as dark red…
Clyde, let me add that what i’m saying is an aside to what you and istvan are specifically talking about. i’m just looking at the bigger picture. Not intending to be a distraction, i’m just trying to add some clarity for others who may be reading (or perhaps even yourself). At the very least it may be, as you are pointing out, that istvan has misrepresented salby on the particular issue that you have raised…
afonzarelli,
And by the same line of reasoning, the CO2 released in tropical waters by outgassing is “gathered” at the poles and is transported to the tropics where upwelling occurs. The amount of CO2 in the water is increased by “dead biomass” drifting downward through the water column, oxidizing by bacterial decomposition and being dissolved in the cold water that is under high pressure. There is no ‘new’ CO2 on the planet. It is all old CO2 that gets moved around. The Carbon Cycle is all about characterizing the transient sequestration and subsequent release. What is happening in the Amazon Basin is fundamentally no different from what is happening in the oceans. However, what is at issue here is whether or not Salby’s statement that most CO2 is being released into the atmosphere in areas with relatively low population densities is true or not. It seems to me that there is evidence to support Salby’s claim.
Well… Clyde, the oceans have a mechanism for being a source, outgassing. Sure, trees can become a source, too, by dying off (and not being replaced by new growth). i’m just trying to make it clear that those red areas in your map are not bonafide sources. They are adding nothing to the content in the atmosphere. (just as some argue that the oceans ain’t adding much to the atmosphere either)…
Let me ask you a question if i may (now that i have your attention)… What (say you) would atmosphereic carbon levels look like during an interglacial if the biosphere was the same as that during glacials? (IOW, what impact does sequestration by trees have on carbon levels as the planet warms from glacials to interglacials?) Thanx…
afonzarelli,
First off, I have to acknowledge that I miss-spoke. The amount of carbon is fixed, not CO2. However, the carbon changes its oxidation state as it is sequestered and potentially released into the atmosphere as CO2.
You said, “…those red areas in your map are not bonafide sources. They are adding nothing to the content in the atmosphere.” First off, you aren’t using the definition that I provided and you haven’t offered an alternative. If dead trees or leaf litter are being converted from carbohydrates to an oxide at a greater rate than surrounding vegetation is converting the CO2 back to carbohydrates , then I would say that the region in which it is happening is, at the very least, a transient source of CO2. Consider a situation where one is alternately opening and closing a valve on a tank of CO2 in a hot house. Isn’t the tank a source of CO2 for the plants in the hot house? It doesn’t have to be turned on all the time to be a “source!”
To answer your question about interglacials: Clearly, vegetation has the ability to draw down CO2 and reduce the atmospheric concentration. That is basically why we have coal. However, the whole point of trying to characterize and quantify the Carbon Cycle is to discover how all the various elements interact over time. The leaves in trees and annuals are a seasonal reservoir. The trunks of trees act as a reservoir with a life span of decades to hundreds of years. However, ultimately, the sequestered CO2 will be released. In a typical situation, the release and absorption of moderate-term sequestration is nearly in balance. However, consider a situation where a disease or insect infestation kills most of the trees in a forest in a short period of time. Then, the release of CO2 will not be neutralized and there will be an excess of CO2 over the production of carbohydrates. It is possible to have short-term and long-term imbalances in the re-cycling of carbon. That is what the whole AGW argument is about.
Ristvan, Is the Argo data before or after adjustment?
Argo matches bouys matches satellites matches re analysis matches ships IF you adjust the ships
Which doesn’t answer the question asked. 😉
Yeah, Mosher did. He took a sophisticated sideswipe at Karlization (2015). You need to know more.
A casual look at the Keeling Curve at the time of the last 3 El Nino events looks to me like it supports Salby:
https://qph.ec.quoracdn.net/main-qimg-e73e23b02785cb2195f8f0c526df1a8d
I drew the time of the last 3 strong el Nino events offset slightly below the main curve. each time the Pacific got warmer, the CO2 accumulation accelerated.
Yes , far bigger swing in 1998. Short term d/dt CO2 does show a strong temperature dependant signal. Sadly Rud did not even understand Salby’s main point before trying to dismiss it.
This short term variability is on top of long term rise. The question is : does the long term d/dt CO2 also contain a temperature driven component ( almost certainly it does ) and how much. Salby in unconvincing but raises valid questions.
gregfreemyer,
Your link doesn’t seem to be working.
gregfreemyer,
The point is that the observed variability is not more than +/- 1.5 ppmv around a 80 ppmv trend for the extremes (Pinatubo, El Niño) and more important, levels off to zero in 1-3 years. The variability in CO2 rate of change has no influence at all on the huge CO2 trend, neither on the derivative, which still is around 50% in average.
If one calculates the net sink rate (in ratio to the CO2 pressure in the atmosphere above the equilibrium per Henry’s law) and subtract that from the yearly human emissions the residual plot is in the middle of the variability:
http://www.ferdinand-engelbeen.be/klimaat/klim_img/dco2_em6.jpg
Ferdinand,
I’m a bit confused. The chart for dCO2/dt(12) obs looks extremely reminiscent to the satellite temp chart. That seems to support the contention that a significant portion of dCO2/dt(12) is driven by temps.
gregfreemyer,
You may assume that most of the variability in CO2/dt(12) is driven by temperature variability. The point is that the variability is small, as your chart also shows: some 1.5 ppmv from the trend for the extreme El Niño’s but also 1.5 ppmv to the other side for the Pinatubo injection.
Over periods longer than 1-3 years the variability practically averages to zero around the trend of ~90 ppmv over the full period.
The error Salby (and Bart) makes is thinking that the match of the variability means that the trend also is caused by temperature. But human emissions in the same period are twice as high and the small increase in temperature never can push 90 ppmv extra in the atmosphere…
The trend matches, too. There is no justifiable reason to arbitrarily dismiss it, filter it out, and substitute your own preferred (and nonphysical) version of what you think the dynamics should be.
Bart,
Either compare T to CO2 or dT/dt to dCO2/dt.
Don’t compare T to dCO2/dt. You still have all the variability in T and CO2, which is the same in dT/dt and dCO2/dt. only shifted back in time. But the trends have nothing to do with each other: you compare the small trend in temperature with the small residual trend in dCO2/dt after removing the bulk of the trend of CO2.
All what you have done is declaring that the two (linear) trends match, so, the integral of T must represent the increase of CO2, which is based on a real correlation between the +/- 1.5 ppmv noise and the arbitrary match of two linear slopes.
That may work in an arithmetic world where you live. In the real world, variability and slope are caused by different processes: the variability mostly by the reaction of (tropical) vegetation on fast temperature changes, while the slopes are NOT caused by vegetation as that is a net sink over periods longer than 1-3 years…
“Either compare T to CO2 or dT/dt to dCO2/dt.”
Why? The data are what they are, and they match T to dCO2/dt.
You are forcing the data to fit your hypothesis, rather than your hypothesis to fit the data.
If you have been around in 1905, you would have told Einstein that everyone knows time progresses uniformly across the universe, and he had to shoehorn the data into that paradigm.
Nature is strange, and often fails to live up to our intuition.
Does anyone know from when we could accurately measures CO2 levels in the atmosphere ? It certainly wasn’t in the early 1900s. You cant tell me that in 1910 we had the technology to measure the % of CO2 to a one hundredth of a percent ? If we couldn’t accurately measure CO2 prior to 1940, then the values before that are invalidated. But let’s assume CO2 has increased by 100pm – then that is a change of 0.01% of a component of the atmosphere in a century. I think you will find both Oxygen and Nitrogen level have fluctuated by FAR bigger amounts over that time (and probably Argon too). While I don’t believe his theory, I also find it hard to believe that changing a component of the atmosphere by one hundredth of one percent has any impact what so ever.
Local measurements with some accuracy were made in the 19th century by the direct chemical method:
https://link.springer.com/chapter/10.1007/978-1-4757-1915-4_4
http://3.bp.blogspot.com/_Lxqre8hMG3M/Sz-Ovumj9QI/AAAAAAAABDA/l8bxjtZBsJw/w1200-h630-p-k-nu/weatherCO2historicalRawMeasurements.jpg
“First, if Salby is right, the rise in atmospheric CO2 concentrations should have slowed or stopped because of the ‘pause’. They haven’t.”
According to this study it did slow down and that while the human fraction of emission is decreasing.
https://www.nature.com/articles/ncomms13428
It’s not only according to this study. It is not controversial at all that the annual atmospheric CO2 change rate slowed down since ~1998. It’s basically flat just like the global temperature indices (no surprise since there is such a good correlation). This has happened during a significant increase in anthropogenic emissions, moreover an acceleration. So, the airborne fraction decreased. This is the opposite of what the consensus projected.
What happens next? Cooling and a decrease in the atmospheric CO2 change? Much smaller airborne fraction (zero, negative)?
This is also shown in one of Bill Illis’ graphs above.
Note how dCO2 takes off during recent El Nino when emissions are slowing or even constant.
It’s decreasing again with the temperature downturn. The annual growth and the AF will be low in 2017.
http://www.woodfortrees.org/plot/esrl-co2/mean:12/derivative
Rud is wrong on that point, but that doesn’t imply that Salby (or Bart) are right.
The net sink rate of CO2 in the atmosphere depends of the extra CO2 pressure in the atmosphere above (dynamic) equilibrium and the equilbrium depends of temperature. If human emissions remain constant, as was the case in the past years, still CO2 increases in the atmosphere and thus the net sink rate increases at a relative constant temperature. El Niño / La Niña and Pinatubo are only temporarely variabilities which zero out in 1-3 years.
See the graph in my previous message.
If human emissions remain constant for a long period, the airborne fraction indeed would go to zero until human emissions and sinks are equal.
If emissions would be zero tomorrow, there would be a drop of ~2.15 ppmv the first year, gradually decreasing until the CO2 levels are back in equilibrium with the current average ocean temperature.
“Rud is wrong on that point…”
Hear that, Istvan? Even Ferdinand is dumpin’ on ya! Admit that you’re wrong and move on (either that or keep your yap shut on GMOs, cause you can’t be trusted with that either)…
Rud Istvan, thank you for your essay.