Guest essay by David Archibald
Our divination of solar parameters is aimed to elucidating two things – the length of Solar Cycle 24 and the amplitude of Solar Cycle 25.

Figure 1: F10.7 Flux from 2014
The F10.7 flux was exhibiting high volatility up to the beginning of 2015 after which it entered a disciplined decline in activity to late 2016. Now it is not far above the activity floor of 64 with three years of the solar cycle to go.

Figure 2: Solar Cycle 24 progression relative to Solar Cycles 19 to 23
For the last couple of years Solar Cycle 24 has been bumping along the lower bound of activity for the cycles for which we have F10.7 data, but with much lower volatility. From here it looks like Solar Cycle 24 will have a long, flat tail until minimum.

Figure 3: Interplanetary Magnetic Field 1966 to 2017
Combined with the solar wind flow pressure, the magnetic field coming out of the Sun is what pushes galactic cosmic rays away from the inner planets of the solar system. Activity in Solar Cycle 24 was backloaded but is now down to levels of previous solar minima.

Figure 4: Oulu Neutron Count 1964 – 2017
The neutron flux, caused by galactic cosmic rays hitting oxygen and nitrogen atoms in the atmosphere, causes changes in cloudiness by providing nucleation sites for cloud droplets. Changes in cloud cover in turn cause change in the Earth’s albedo, perhaps the largest driver of climate. The neutron count is climbing fast now that the peak in the interplanetary magnetic field (and Ap Index and solar wind flow pressure) has passed.

Figure 5: Solar Cycles aligned in month of solar minimum
Solar Cycle 24 is the cycle in blue at the top of the figure. It is three years ahead of Solar Cycle 23 at the same level of neutron flux. It also looks like it will have a higher count than Solar Cycle 20 which caused the 1970s cooling period.

Figure 6: Circum-Arctic oceans temperatures 2004 to 2017
The Climate4you site carries a graphic of circum-Arctic ocean temperatures from the surface to 1,900 metres using Argo data. What is interesting is that the water depth slice from from 200 metres to 1,500 metres is showing a strong and consistent cooling trend from 2012. The slice from 400 metres to 1,200 metres is shown above. The temperature decline at 1,000 metres has been 0.1°C per year from 2012.

Figure 7: Solar Polar Magnetic Field Strength by Solar Cycle and aligned on solar minimum
Solar polar magnetic field strength at solar minimum is the best indication of the amplitude of the following solar cycle. With an amplitude similar to that of Solar Cycle 23 at the same stage, it looked like Solar Cycle 25 might be just a little weaker than 24. It is still too early to tell.
David Archibald is the author of American Gripen: The Solution to the F-35 Nightmare.
I guess in 10 years or so we will know if the Sun really matters. I’m not sure whether to put a /sarc tag on this or just let it fly.
As I recall, people said similar things ten years ago. And likely will say it again ten years from now.
lsvalgaard
“As I recall, people said similar things ten years ago. And likely will say it again ten years from now.”
____________
David Archibald, the author of this article, was confidently predicting imminent global cooling nearly 10 years ago based on reduced solar activity: https://wattsupwiththat.com/2008/06/02/solar-cycle-24-could-be-13-years-long-cooler-times-ahead/
The reduced solar activity arrived as predicted; the expected global cooling did not. Instead further global warming occurred. To record high levels in fact.
Indeed!
yes,
but who is guarding the guards [of the records]?
what if the sat. records are wrong by a few tenths of a degree?
do you honestly think earth is getting warmer?
[hint:start checking Tmax and Tmin in your own back yard and then come back to me with your own actual results….]
The globe is cooling with less solar input. The oceans and earth have been releasing significant amounts of heat into the atmosphere whenever the solar input is at its lowest. Its pretty obvious the globe is and has been cooling.
Its pretty obvious the globe is and has been cooling.
http://www.drroyspencer.com/wp-content/uploads/UAH_LT_1979_thru_February_2017_v6-550×317.jpg
The troposphere has not warmed quite (sic!) as fast as most climate models predict:
http://images.remss.com/figures/climate/RSS_Model_TS_compare_globe.png
from: http://www.remss.com/research/climate
But has not cooled either as it should if responding to declining solar activity
lsvalgaard wrote:
“Its pretty obvious the globe is and has been cooling.”
No. You have to include ocean warming to make judgements about the globe as a whole. Oct-Dec 2016 ocean heat content in the 0-2000 meter region jumped up 1.5 W/m2 (2.4e22 J) — easily swamping any atmospheric cooling.
Never said that. I quoted someone, and showed a graph that was no cooling.
Crackers,
Even if a reliable datum, which it isn’t, three months of ocean “observations” say nothing at all about climate, the shortest unit of which is 30 years. Oceanic warm and cold blobs come and go. It’s weather, and oceanic circulation not climate.
chimp, right. but people here and elsewhere are trying to claim global cooling based on about 6-8 months of lower tropospheric data. that’s not valid either (and involves much much lower quantities of heat).
lsvalgaard: my apology for misquoting you.
crackers345 March 21, 2017 at 5:10 pm
You could be right, but I haven’t seen that claim.
The conclusion I have seen however is that the past 20 years, give or take, show global cooling or at least flat GASTA. That is approaching a meaningful period.
Chimp wrote:
“The conclusion I have seen however is that the past 20 years, give or take, show global cooling or at least flat GASTA”
That is simply not what the organizations doing the work find — NOAA, NASA GISS, Hadley Centre, BEST, and JMO. All find trends of 0.15-0.2 C/decade over the last 20 years. Even UAH and RSS find 20-year trends for the lower troposphere of +0.06 C/decade.
And, of course, the ocean has warmed enormously since then — 15-20e22 J.
Crackers,
Nope. The trend in UAH is cooling:
http://www.drroyspencer.com/wp-content/uploads/V6-vs-v5.6-LT-1979-Mar2015.gif
HadCRU, GISS and NOAA are works of anti-science fantasy.
Nonsense. The difference between the two versions is NOT the temperature trend. Jeez.
That graphic reflects the fact that in this century the trend in UAH has been down.
Even in the cooked book HadCRU, 2002-15 was down:
http://www.woodfortrees.org/graph/hadcrut3vgl/from:2002/to:2015/trend/plot/hadcrut3vgl/from:2002/to:2015/plot/rss/from:2002/trend/plot/rss/from:2002/to:2015/plot/uah/from:2002/to:2015
It’s clear that the rising GASTA from the PDO flip c. 1977 ended either in the ’90s or ’00s, flattening out at best after that, but in the least cooked books, cooling.
Complete nonsense. Look at the graph. It clearly says that the UAH trend has been +0.114 deg/decade. ‘+’ means warming. Please do not pretend to be dumber than you are.
It is cooling
By my book
Globally.
But the greening of earth traps some heat to keep cooling down a bit…..
It gc versus ngw…
There is no agw
It is man helping nature that done it…
More nonsense. UAH themselves say the trend is +0.114 deg/decade which for the last 40 year is a warming of half a degree. .
Both of you:
THE TREND IS UP [WARMING]
http://www.leif.org/research/UAH-Trend-is-UP.png
Now, no more nonsense from you guys.
End of discussion. Period.
Einstein once said: “there are two things that are infinite: the Universe and Human Stupidity. And I’m not sure about the former”.
what nonsense?
Leif, you mean we all have to believe your graphs showing that it is warming?
You are kidding me, right?
\
\ For good reasons, I think your graphs are all wrong.
My graphs show me that it already has started cooling ca. 19 years ago, looking at what we get from the sun, especially maxima.
I looked at means, maxima and minima in 54 cities, namely, 27 NH and 27 SH, balanced to 0 latitude and 70/30 @sea and inland. I looked at the average rate of change over time in K/annum, meaning balance on longitude is not important.
I also looked at the past 40 years.
So in total, I looked at 54 x 40 x 365 x 3 = 2365200 daily data. That is the amount of data I evaluated.
You say you don’t believe me? You can check me up if you want to. From all those 54 cities I can tell you exactly what the mean was, and the minimum and maximum, for any given day during the past 40 years.
[ for USA, I included Cheyenne, NY, LV, LA, Atlanta, Miami Beach, Honolulu, Kahului, ]
My very best wishes to all independent investigators,
[put some ice on it if it is too warm for you]
Cheers,
Henry
Leif, you mean we all have to believe your graphs showing that it is warming?
Yes, indeed, you should all do just that.
It is not MY graph, it is the satellite measurements of the global temperature. And there is clearly a steady warming.
Henry,
The satellites have made 150 million measurements covering the entire globe….
yes Leif
and if they measure 150 million times wrong, it does not help anybody….anything.
There is no [probe] material that I know of that can withstand what is currently coming from the sun;
luckily we have our atmosphere to protect us
and, most unexpected [by myself]
this is causing the global cooling that Chris and myself is talking about….[By experience!]
As it produces more ozone & other substances TOA
I am sure we have been over that before.
Here you can see cooling happening in Alaska:
http://oi60.tinypic.com/2d7ja79.jpg
\
no doubt it also happened like that in NZ as Chris Norman reported.
Go for the real news. Not the fake news from BEST, NOAA, BOM, KNMI, etc….
and if they measure 150 million times wrong, it does not help anybody….anything.
Just displays your ignorance. End of Discussion.
Leif,
it only shows your ignorance by not actually measuring and recording about what is happening in your own backyard,
here is my final report on this:

Concerned to show that man made warming (AGW ) is correct and indeed happening, I thought that here [in Pretoria, South Africa} I could easily prove that. Namely the logic following from AGW theory is that more CO2 would trap heat on earth, hence we should find minimum temperature (T) rising pushing up the mean T. Here, in the winter months, we hardly have any rain but we have many people burning fossil fuels to keep warm at night. On any particular cold winter’s day that results in the town area being covered with a greyish layer of air, viewable on a high hill outside town in the early morning.
I figured that as the population increased over the past 40 years, the results of my analysis of the data [of a Pretoria weather station] must show minimum T rising, particularly in the winter months. Much to my surprise I found that the opposite was happening: minimum T here was falling, any month….I first thought that somebody must have made a mistake: the extra CO2 was cooling the atmosphere, not “warming” it. As a chemist, that made sense to me as I knew that whilst there were absorptions of CO2 in the area of the spectrum where earth emits, there are also the areas of absorption in the 1-2 um and the 4-5 um range where the sun emits. Not convinced either way by my deliberations and discussions as on a number of websites, I first looked at a number of weather stations around me, to give me an indication of what was happening:
The results puzzled me even more. Somebody [God/Nature] was throwing a ball at me…..The speed of cooling followed a certain pattern, best described by a quadratic function.
I carefully looked at my earth globe and decided on a particular sampling procedure to find out what, if any, the global result would be. Here is my final result on that:
Hence, looking at my final Rsquare on that, I figured out that there is no AGW, at least not measurable.
Arguing with me that 99% of all scientists disagree with me is useless. You cannot have an “election” about science.
You only need one man to get it right.
Leif, you are just not the man who got it right….
it only shows your ignorance by not actually measuring and recording about what is happening in your own backyard,
I’ll take 4 billion satellite measurements covering the whole globe over what happens in my backyard anytime.
here is my final report on this
If true, then good riddance.
Falsified data is falsified data. Human caused warming advocates have been caught falsifying data, repeatedly, therefore they are not reliable. Real scientists don’t have to lie, political/religious advocates do lie. End of conversation.
Everyone is entitled to believe what graph he believes is correct.
On another note. What I am missing here in the post….
Leif, could you just show me again your graph or slide of ssn and solar polar mfs in one picture?
Slide 15 of http://www.leif.org/research/AMJ-100-Years-Polar-Fields.pdf is one reconstruction.
Slide 51 of http://www.leif.org/research/w6yx-Talk.pdf shows recent data
Very recent [and better] polar fields:
http://jsoc.stanford.edu/data/hmi/polarfield/
http://solis.nso.edu/0/vsm/vsm_plrfield.html
Leif thanks, very much.
The graph that gives me the best oversight is the one at page or slide 51,
http://www.leif.org/research/w6yx-Talk.pdf
I printed it now, so I won’t lose again.
I remember now what struck me as important, looking at this graph.
Namely, that high SSN corresponds with low(er) solar polar magnetic field strength. I had always assumed it was the other way around. Do you count the single Schwabe cycle from minimum (SSN) to minimum (SSN)? Would it not be better to count a [single, Schwabe ] solar cycle from max (SSN) to max (SSN) rather than from min to min?
Or what do you think would be the best interval to use to compare certain data on earth with the SCs?
Namely, that high SSN corresponds with low(er) solar polar magnetic field strength
It is a bit more complicated. The polar fields are largest just before SSN minimum. They then are the seeds from which the next cycle forms. So you have to compare polar fields at minimum with SSN at next maximum. Anything else is not physics.
As to when to start a cycle: The maximum is often ill-defined, e.g.
http://www.solen.info/solar/cycl14.html
And the minimum is the time when the sunspots change their polarities, so the Hale cycle goes from minimum to minimum. It doesn’t matter which convention you use as long as you know what you are doing.
Leif
you say:
It is a bit more complicated. The polar fields are largest just before SSN minimum. They then are the seeds from which the next cycle forms. So you have to compare polar fields at minimum with SSN at next maximum. Anything else is not physics.
As to when to start a cycle: The maximum is often ill-defined, e.g.
http://www.solen.info/solar/cycl14.html
And the minimum is the time when the sunspots change their polarities, so the Hale cycle goes from minimum to minimum. It doesn’t matter which convention you use as long as you know what you are doing.
Henry says
I am trying to work this out for myself:
http://www.woodfortrees.org/graph/sidc-ssn/from:1969/to:2017/offset/trend/plot/sidc-ssn/from:1920/to:2017/plot/sidc-ssn/from:1925/to:1969/trend/plot/sidc-ssn/from:1925/to:2017/trend
in the above graph I have changed the GB cycle to 88 years, which I think is fair.
When I move the middle of GB to 1969, I needed no offset….the blue and red are a perfect fit!!
Of course the blue and red line are an approximation of the apparent curved hyperbolas, either way of 1969, going up and coming down to/from the said top in 1969. This date of 1969/1970 is confirmed by your slide no 51: something very odd happened in 1969-1970 if you look at the solar polar magnetic field strengths. It looks to me exactly like an electrical dead end stop…and it is as if there was one extra very small sc which everyone then simply missed…. That is probably why sc 20 looks a bit smaller then what it should have been.
the 1970 date is confirmed by all of my data on minima and maxima, both reaching peak maximum around 1969 in many places followed by sharp drops after 1970.
Like I said, I am trying to work this out for myself:
I think it would be correct for me to count the last 2 Hale cycles from 1969 until 1990 and the next one from 1991 until 2014. This is where the solar polar mfs seemed to have changed direction.
[looking at what we get from the sun, the bending point of said hyperbola is the point when actual cooling started. Acc. to my data on max. and min. this was about 20 years ago. But you don’t have to believe that.
Seems to me many learned climate scientists are deliberately not looking at max. and min. because maybe they want to avoid discussing the results?]
something very odd happened in 1969-1970 if you look at the solar polar magnetic field strengths.
I don’t think so. The plot is based on very NOISY Mount Wilson data and the uncertainty is so great that one should not make anything of those minor wiggles. There are no little cycles hiding somewhere.
Henry,
I was too quick. Had forgotten that each ‘measurement’ is actually 30 separate observation at different latitudes, so the total number of data points is in excess of 4 billion.
lsvalgaard March 21, 2017 at 10:12 pm
I just love the way climate “scientists” insist in deriving linear trends through carefully cherry-picked portions of clearly cyclic functions and extrapolating them to Armageddon in order to “prove” whatever argument they’re peddling at the moment…
Well no, we won’t.
Because all the climate science will have been defunded.
The usual useful idiots will stil be peddling their nonsense
That’s good, Griff is back.
Got your internet connected up North now Griff?
“Because all the climate science will have been defunded.”
No Skanky.
All the post-normal climate “science” will hopefully have been defunded and replaced with good old classical science.
Not the same thing at all.
Now be a good child and go and apologise to Dr. Crockford for lying about her professional qualifications.
rbabcock
The Sun matters.
It is not clear exactly how much.
But – The Sun Matters.
Auto
We already know the sun doesn’t matter. The climate’s sensitivity to solar changes =~ 0.1 deg C/(W/m2).
Or just calculate from the 0th-dimensional energy balance equation
emissivity*sigma*T^4 = (1-albedo)*S/4
where S is solar insolation and sigma=Stefan-Boltzmann constant. Differentiating and rearranging gives
dT/dS = T/4S = 0.1 K/(W/m2).
where K = Kelvin, and because T = 288 K and S = 1365 W/m2.
The climate simply is not very sensitive to changes in solar insolation. GHGs easily counter it.
“We already know the sun doesn’t matter”
Tell you what, take the Sun away and then see how much it doesn’t matter.
No sun = no climate, nothing. No photosynthesis, no crops, no food, and you’re telling me the sun doesn’t matter? Get outta here!
rapscallion
March 20, 2017 at 5:48 am
“Tell you what, take the Sun away and then see how much it doesn’t matter.”
———————
rapscallion……..every thing matters even the sun……is a part of it all…. but when considering the point in question is not about the Sun perse, but more about the Sun’s variation over time……take that away and nothing much changes as per the basics of climate and climate change……..unless you got at some point to consider scientist like Leif….and their science, making the Sun and it’s variation still a probable means to explain further the Climate and the climate change, according to their scientific research……:)
cheers
rap: The issue is _changes_ in the Sun. Just as the issue is _change_ of climate.
crackers345: You’re wrong. Your calculation yields Dt/DS = .05K/Wm-2, not .1K/Wm-2. So according to you, the solar insolation would have to change 20 Wm-2 to get a 1 degC change in temperature. That is ridiculous!
Further, you take the temperature change with respect to solar insolation, but the earth is 106 degC COLDER than the equivalent black body temperature of a surface in equilibrium with TOA insolation. If DF/DT = 4 sigmaT^3, using the earth’s radiating temperature of 288K, the answer is .185K/Wm-2, or 3.7 times the answer you give when it is calculated correctly.
Further, the earth’s surface temperature would change at a level greater than just BB emissivity calculations as simple as this. If the solar insolation decreased by 2 Wm-2, the very minimum global temperature decline would be .37 degC. That’s not including probable effects of water vapor unspooling in the troposphere. That big of a change could easily cause a cooling double that or .74 degC.
According to what I’ve read about the solar magnetic connection to temperature, the Russians believe there is a 14 year look back in the temperature response due to thermal inertia in the oceans. That places us right about now as to whether the current decline in solar magnetic should cause a cooling of global temperatures. So we will see soon as to whether this is a plausible explanation of climate.
I’m not a solar physicist, but a meteorologist. So I don’t care to venture as to whether this theory is correct and frankly I don’t think enough is understood about the solar/earth climate connection to give a complete answer. But I do note that there is a statistical r squared correlation of global temperature to solar cycle length that is nearly perfect scoring .96 that I had seen.
So if I were a betting man, I would put my money on the emersion of a global cooling trend soon since I firmly believe the cO2 warming hypothesis is junk science and nonsense, based upon contradicting founding principles of atmospheric science coupled with failed climate models.
‘So according to you, the solar insolation would have to change 20 Wm-2 to get a 1 degC change in temperature. That is ridiculous!”
why?
***
not sure if you know calculus, but the derivative dT/dS is a line tangent to the T(S) curve. it exists at each point, but it cannot be turned into a delta(T)/delta(S) far from that point.
furthermore, dT/dS = T/4S is a simple, 0-dimensional model. heuristic. that is, not something intended to be rigorous science, but a simple example that shows why the climate model results (0.1 K/W/m2, in the 5AR) aren’t ridiculous.
So according to you, the solar insolation would have to change 20 Wm-2 to get a 1 degC change in temperature. That is ridiculous!”
No, that is about right.
I would say what gets my attention is how weak the sun is currently and yet the solar minimum is not expected until 2019-2020, so if it is this weak now what will it be like by year 2019?
All of my solar parameters will likely be in force at the same time in the not to distant future and then the climate cools due to an increase in global cloud coverage snow coverage and major volcanic activity which should in turn increase the albedo of the earth . Even a 1% increase in the albedo would have significant climatic effects.
What makes this even more interesting is the geo magnetic field is continuing to weaken which will compound given solar effects.
Sea surface temperatures overall should continue to decrease as UV light weakens.
As of today the solar cycle is running much weaker then forecasted and I think David Archibald was holding back some and being conservative as far as just how weak solar activity may become going forward.
The thing we must remember that this period of time in the climate is in no way unique when viewed against the historical climatic record and every time in the past a prolonged solar minimum period has taken place the global temperature response overall has been down without exception.
As weak as conditions are I expect a big step down in the solar wind speed, ap index values and the IMF going forward while sunspots continue to dwindle.
So the sun is weak and yet we still get years with record temperatures…
The sun isn’t driving climate change is it? Nor are we seeing the start of an ice age…
griff
your thinking that the sun is weak [when there is low solar activity] is wrong to start with..
the sun is super hot!
we have had very low solar polar magnetic field strengths over the past 5 years,
meaning more of the most energetic particles are able to escape.
Lucky for us, we have an atmosphere: meaning that more ozone, peroxides and N-Oxides are formed TOA,
which ultimately will lead to less UV into the oceans,
hence it is globally cooling
[which you could see if only you would not be so lazy as to measure the decline in Tmin in your own backyard…..
Yes, but the UK met office showed that the record year was due to the El Nino.
And if CO2 was such a huge driver then why have we had similar warmings since the 1800’s?
And the beloved models don’t show any plateauing of temperature is possible. Doesn’t this even pique the slightest bit of interest in you that there is something very wrong with the models? And if that is the case they why believe that they have any predictive value at all??
I believe the global temp avg over the past 600 million years has been 12 degrees warmer than now. As far as planetary history goes, what record? Yes, it’s the warmest it’s been in the past 137 years but as far as the planet goes, what record?
Griff: El Nino. But then you already knew that.
Dean March 19, 2017 at 4:59 pm wrote:
“And the beloved models don’t show any plateauing of temperature is possible. Doesn’t this even pique the slightest bit of interest in you that there is something very wrong with the models?”
They do. See this graph of the RCP projections to the year 2300:
http://www.easterbrook.ca/steve/wp-content/IPCC-AR5-Fig-12.5.png
Crackers,
Plateauing modeled 200 years from now doesn’t count. In objective reality, a plateau has already been in effect for the past 20 years or so.
“Plateauing modeled 200 years from now doesn’t count.”
of course it does. any calculation of agw’s future and plateau requires model. every one.
“In objective reality, a plateau has already been in effect for the past 20 years or so.”
then how do you can explain all the surface warming, ice melting, slr and ocean heating in the last 20 years?
Crackers,
“Surface” warming has not actually occurred. The so-called “surface data sets” are works of pure fantasy.
Ice melting, to the extent that it has occurred, is a purely natural phenomenon, nothing in the least bit out of the ordinary. Until the super El Nino of 2016, Antarctic sea ice was growing, not shrinking, which all by itself falsifies the CACA conjecture. Antarctic land ice is also growing.
Some glaciers are growing, some shrinking. To the extent that there has been retreat, that’s exactly what a rational person would expect coming out of the LIA.
There has been ocean heating only in the faked NOAA “data sets”. Actual observations show cooling to flat for the past 20 years.
The models failed miserably to predict the past 20 years, so how could they possibly hope to be accurate 200 years from now?
chimp: clearly, any data you don’t like you call fake, any data you do like are fine and dandy. do you not realize how easy it is to see through such excuses?
crackers345 March 21, 2017 at 5:24 pm
The paleoclimatic data in the studies I’ve linked for you are valid.
Use the Flux, Luke!
The Flux is the best proxy for energy actually reaching the surface of the Earth. See Penticton, Canada where the Flux is measured:
http://www.spaceweather.ca/solarflux/sx-4a-en.php
Global temperature -> -0.1 C/2.5 years when Flux is less than 80sfu.
As of today the solar cycle is running much weaker then forecasted
Actually, it is not. The forecast was for a cycle like cycle 14 [“the weakest in 100 years”] and SC24 is on track:
http://www.leif.org/research/TSI-SORCE-Cycle-24.png
We can reconstruction F10.7 and EUV back to the 1740s:
http://www.leif.org/research/w6yx-Talk.pdf
And the current cycle fits the historical patterns very nicely.
Time will tell.
Nothing in your case, that time can tell, Salvatore, because simply you do not even have a case…..to rely at…the best you can contemplate is the worse case of a conjecture…..if even that can be considered at some point… crystal balls can do better than that…
cheers
Like a GCM used to predict the end is nigh Whiten?
A reminder to Salvatore….be very careful….you were previously banned for bad behavior, and I sense a relapse about to happen.
Leif.
you are a treasure.
When Marconi in 1902 demonstrated that radio communication across the Atlantic Ocean at a distance of 2000 miles it became clear that an electric ‘mirror’ existed high in the atmosphere to guide the radio waves around the curvature of the Earth. Kennelly and Heaviside independently suggested that a layer of ionized gas, the ‘ionosphere’ at an altitude of 60-100 miles was responsible for the effect, but it was only more than two decades later that the existence of such a layer was firmly established by the British scientist Appelton for which he received the 1947 Nobel Prize in Physics.
Physicists long resisted the idea of the reflecting layer because it would require total internal reflection, which in turn would require that the speed of light in the ionosphere would be greater than in the atmosphere below it. It was an example of where the more physics you knew, the surer you were that it couldn’t happen. However, there are two velocities of light to consider: the phase velocity and the group velocity. The phase velocity for radio waves in the ionosphere is indeed greater than the Special Relativity speed limit making total internal reflection possible, enabling the ionosphere to reflect radio waves. Within a conducting layer electric currents can flow. The existence of such currents was postulated as early as 1882 by Balfour Stewart to explain the diurnal variation [discovered in 1722] of the Earth’s magnetic field as due to the magnetic effect of electric currents flowing in the high atmosphere; such currents arising from electromotive forces generated by periodic (daily) movements of an electrically conducting layer across the Earth’s permanent magnetic field.
Today, we know that solar Extreme Ultraviolet radiation is responsible for ionizing the air and that therefore the ionospheric conductivity varies with the solar cycle [e.g. as expressed by the number of sunspots]; so, observations of the Sun are vital in monitoring and predicting radio communications for Amateurs and Professional alike. Conversely, centuries-long monitoring of variations of the Earth’s magnetic field can be used to determine long-term variations of solar activity. The talk weaves these various threads from multiple scientific and engineering disciplines together to show the unity of scientific endeavor and its importance for our technological civilization.
Steven Mosher
March 19, 2017 at 6:55 am
Leif.
you are a treasure.
—————————
Mosher, hard to believe but that is a point that I totally agree with..
He is,, is he not. 🙂
cheers
Steven
About the total internal reflection thing. I was happy to be present in Toronto at a meeting of HAMS in the 1980’s where one of them presented the result of his research into the inexplicably high energy in radio signals travelling great distances around the world. He built a Yagi beam with the ability to inject the signal into the ionosphere at various angles so as to direct the signal in a way that he said proved it was being refracted, not reflected.
The difference is: reflection means the beam spreads, In school we were shown pictures of a bouncing radio wave that supposedly bounced up and down from the ground to the sky and back in a number of bounces. CB users report working ‘skip’ but it too is frequently channeled much to far and conserved to be ‘skip’ in the classic sense. This bouncing nothing like what happens, he claimed. There is far too much energy conserved and reaching very far away points, with nothing reaching the surface in between (tested using intermediary HAM stations and signal power meters.
His proposition was that the signal strength (radio wave energy) was being conserved in very narrow physical spaces, and reached the ‘other end’ highly conserved. This is not consistent with the idea that the signal is reflected, even reflected a number of times, sort of ‘surface to surface’. If that was happening, the signal would still spread out and the energy at the far end would meet the predicted value. It doesn’t, it is often much more than that, and there is none of the spread one expects.
He also found that by choosing the injection angle carefully he could make the signal emerge from the refraction (he called it) at a chosen point rather than at a series of points reached by a number of internal reflections.
Many HAMS will have noted that asymptotal contacts are often far stronger than contacts say, 2/3 of the distance away. I have been given two possible explanations for this, one being the refraction of the signal by multiple paths, the other being multiple bounces by different routes all converging at the asymptote. Bounces implies intermediary contacts are possible. Very frequently this is not so. One skip to ground but the rest is kept ‘up there’ for a long distance.
I don’t have a snappy answer to the phenomenon bit I do have a lot of experience with signals that are ‘far too strong’ to be internal reflections spreading out at the beam angle. They are not spreading, they are strongly conserved. Whether this is channeling within a wave guide or something guided by currents and magnetic fields, I would like to hear. Perhaps other HAMS can comment on whether this refraction idea ever gained and traction.
Thanks
Good post.
Ouch! It seems from: http://www.leif.org/research/Radio-Ionosphere-Magnetism-and-Sunspots.ppt embedded CRs and all …
Mosher – bad
The later talk is just an update of the earlier one to the same kind of audience. The abstract did not change.
Did you even study the talk carefully?
no
I was not interested looking at it;
Going by Jim’s comment I thought Mosher had just forgotten the citation marks [was he not quoting what you said?]
But you SHOULD be. You would learn something.
Ah, you are not interested in learning anything.
I learn(ed) a lot from you
but even you have been caught in stereo type thinking
@Crispin in Waterloo but really in Bishkek
1) Using 60 meter band today to talk 10 miles south of me; signals are in and out (SO not ‘ground wave’) … this is what is called NVIS, Near Vertical Incidence Skywave and most likely reflection and not refraction of energy approaching and having entered the ionosphere (comprised of excited free electrons). See: https://en.wikipedia.org/wiki/Near_vertical_incidence_skywave
Also note how ionograms are made using a vertical sounder:
http://lisn.igp.gob.pe/files/first_ionosonde_school/bullet_HF_sounding.pdf
Example of vertical sounder results showing one notable active layer for freq range 5 MHz +- 1 MHz:
https://lgdc.uml.edu/common/ShowIonogramPage?mid=25046192&ursiCode=AU930&time=2017.03.19%20(078)%2018:00:05.000
2) re: “signal strength (radio wave energy) was being conserved”, have you ‘run’ the Friis equation (so-called Free Space Path Loss equation) to know if sufficient energy WOULD have arrived on a straight line-of-sight path of 100 to 1000 or more miles? I have, and no consideration of energy need be made. It can perhaps be shown on some HF paths (including 160 meters) that ‘ducting’ involving multiple reflections off earth and sea work to ‘conserve’ some energy. This is a phenom that is apparent at low freqs in particular.
ALSO NOTE that Faraday rotation can change polarization of the signal at the receive site. This often accounts for signal fades that are experienced.
3) re: “asymptotal [asymmetric?] contacts” can sometimes be attributed to a poor efficiency antenna used on one end; we see this ALL the time on 160 meters where a station on 160 does not understand why he can COPY a distant station but cannot be HEARD by said distant station.
A low ERP on the part of the station with the poor performance xmit antenna is at a disadvantage when his signal ARRIVES at the distant station WEAK with respect to the ambient noise ALREADY PRESENT at the distance station.
Mosh, hope you don’t mind but I reformatted your post to remove the line breaks and increase readability. I did that in part because I agree with your ideas and wanted them to be easier to read.
My best to you,
w.
Willis, Mosh was quoting me…
Thanks for fixing Willis.
I shoulda remembered the quote marks ( phone posting from beijing)
The air here is unbelieveable
Willis Eschenbach: “Mosh, hope you don’t mind but I reformatted your post …”
Okay, succinct (compact, condensed, crisp, laconic, terse) this time.
<succinct>
As noted yet again, those were NOT his words. They were pilfered from a PowerPoint of Lief’s.
</succinct>
Total Solar Irradiance from the SORCE TIM instrument is still slightly higher than the last solar minimum which was about 1360.7 W/m2. In the last 3 months, TSI has touched that level a few times but it has generally been at 1360.8 W/m2. Close enough I guess but not lower than the last solar minimum yet.
http://lasp.colorado.edu/data/sorce/total_solar_irradiance_plots/images/tim_level3_tsi_24hour_3month_640x480.png
More up to date chart. WordPress is not using the latest.

http://www.leif.org/research/EUV-F107-and-TSI-CDR-HAO.pdf
Slides 57 ff.
” the reconstruction does not support the constancy of the calibration of the SORCE/TIM TSI-record since 2003, but rather indicates an upward drift, suggesting an overcorrection for sensor degradations”
I don’t think many here understand that, a Watt per meter-squared from the Sun is NOT equivalent to a W/m2 from a GHG. There are different physics involved. The climate sensitivities are very different.
Sorry guys
The source
“We can reconstruction F10.7 and EUV back to the 1740s:
http://www.leif.org/research/w6yx-Talk.pdf
And the current cycle fits the historical patterns very nicely.”
Steven Mosher
March 19, 2017 at 4:50 pm
Mosh, thank you for the link….:)
cheers
The primary cause of climatic variation on planet Earth, the Sun. Pointing that out does not make you many friends in certain circles. Funny, ham radio operators have been ringing the bell on solar activity since the mid/late 1990s, but who wants to listen to people who use antiquated communications equipment which is easily effected by, wait for it, solar activity.
The primary cause of climatic variation on planet Earth, the Sun
Actually, it is not the Sun, but the planet Jupiter.
I am stunned. You have converted to my faith? [i.e. influence of the position of the planets on the weather on earth/
Jupiter? How do figure that?
Jupiter changes the orbit of the Earth causing glaciations. see
http://www.indiana.edu/~geol105/images/gaia_chapter_4/milankovitch.htm
Eccentricity varies primarily due to the gravitational pull of Jupiter and Saturn
Thanks for pointing that out. I have found few people, even phd in other scientific disciplines, even consider that the planets have an affect on the sun. I found a nice graphical display that I forward that helps them understand. Once they see this graphic they start the process of understanding the concomitant effects.
http://astro.unl.edu/classaction/animations/extrasolarplanets/ca_extrasolarplanets_starwobble.html
I vote for Minerva.
==============
Found this. Sounds interesting.
http://www.earth-climate.com/
Leif
Please explain
https://en.wikipedia.org/wiki/Milankovitch_cycles
The planet Jupiter makes the wobbles in the orbit of the earth that produce glacials and interglacials. NOT the temperature of the last 60 yeaers or so…
Of course not. Neither has the Sun anything to do with that. Solar activity down, temperatures up.
So, “when the moon is in the seventh house and Jupiter aligns with Mars peace will guide the planet and love will steer the stars. This is the dawning of the age of Aquarius. ” it’s getting a little hinky around here me thinks.
Leif, now you’ve done it! Virgil waits to guide us to the seventh circle of hell, where we may find a useful climate model.
henryp
March 19, 2017 at 6:23 am
Allow me to express my point in regard to your comment.
I may bee entirely wrong but when it comes to Isvalgaard and Jupiter, I tend to think about that as more of it in the lines of taking a “piss” at Salvatore and it’s obsession with the “Sun is doing it”…..
You see I can contemplate a much more appealing case of climate change……with much more support than in case of Salvatore….more hypothetical in substance, more correlation over time, more conjecture shown, and even some support by the IPCC AR5 when at that……where my own grand mother will be considered as a case of climate change…..
You see no matter how much I did love my grand mother, I know that she is no where near a possibility to be considered as a case of climate change, even when I may try and be more persuasive than Salvatore…..when at it….still will be a waste of time…
Sorry Isvalgaard if I be wrong with this simplicity of mine…..just my opinion..
cheers
what is your point
where are your results?
[anyone except dr.S]
here is mine for Saturn – Uranus
http://tinypic.com/view.php?pic=5yxjyu&s=9
Neither Jupiter’s orbital variation nor other orbital fluctuations (e.g., Milankovitch) can explain how the Earth went from full glacial to full non-glacial in 100 yrs, then back to full glacial in a 100 years years, and then back to full non-glacial in 100 years. Orbital variations just don’t work–they can’t bounce back and forth so quickly with such high intensity.
Neither can the Sun.
Volcanoes can…
I’m also a ham and I didn’t notice that somebody rang a bell in the 90s. The cycle 23 was very normal and I rememeber very well that in 2002/03 during wintertime I made very excilting qso’s from Germany to Florida in the 6m band ( F-condx). My partners were very loude and stable and I used only a dipol and 50 W power out. The solar conditions were ok in 2002/03!
frankclimate
So why was a 6m signal emitted by a dipole conserved so much, travelling so far without dissipating to almost nothing? Are you talking about a 10 or 20 over 9 using that setup? What was the signal report? There seems to be no way that passage was by reflections originating from a (all but) non-directional dipole.
I was able to pick up in Swaziland a guy working 15m QRP (4 watts) with a dipole under his roof in New Jersey. No power, no direction, no free air, and the signal was moving the meter 16,000 km away. That is not reflections. That is a wave guide. What do you think?
re: “So why was a 6m signal emitted by a dipole conserved so much, travelling so far without dissipating to almost nothing?”
What kind of signal loss does the Friis equation give for an equivalent length straight-line free-space path at 6 meters?
Friis calculator:
https://www.pasternack.com/t-calculator-friis.aspx
Crispin, Jim: Of course it’s some kind of waveguide. The one wall of it is the earth surface, the other is the ionosphere. As more ioninsation there is as higher can be the reflected frequency. The sun is the engine in this case. In 2002/03 was so much ionisation that the frequency of 50 Mhz (6m) was reflected bei the F- Layer. For 15m it happens fare more often. These are the very fundamentals of ham-radio, I’m quite sure that you’ll find some more literature.
frankclimate : “Of course it’s some kind of waveguide.”
Um, no. Not really, because if EVERYTHING is waveguide then NOTHING is waveguide.
Neither the earth NOR the ionosphere is a good or perfect reflector or refractor. Sea water though, comes pretty darn close.
BROAD and waaaayy overly generalized response BTW; see the link in this thread for something a little more specific on this subject of the ionosphere and propagation.
BTW, I had multiple “spots” from 13 unique European stations in 5 different countries (a record for me) last night on the 160 meter band (1836.6 kHz dial freq) running the “WSPR” digital mode. Let me know when you can match that from a small, city-sized lot. I’m also waiting for my FCC Part 5 experimental license on the 630 meter ‘band’ to be renewed for a 2nd two years (the prev term expired March 3rd this year.).
.
2hotel9 wrote:
“The primary cause of climatic variation on planet Earth, the Sun.”
Sorry, no.
More important factors are CO2 and Milankovitch cycles. The Sun cannot explain the PETM or the ice ages of the Quaternary period.
lsvalgaard
I am glad to see you back again at WUWT, you had a bit of a holiday? Good for you!

I realized some time ago that I never asked you directly exactly what your opinion is as to what happened to the solar polar magnetic field strengths in 1971 and 2014 respectively
please let me know.\
The polar fields reversed sign as they also did in 1980, 1990, and 2000.
true/fair enough
but then in 1980, 1990 and 2000 there were no double reversals.
what is your explanation then, for the apparent double reversals in 1971 and 2014
The sun is a messy place and such random occurrences happen all the time.
http://www.leif.org/research/ApJ88587.pdf
“different times of polar field reversals is a general feature of the cycle”
It is not a ‘double reversal’, but simply reversal at different times in the two hemispheres, which is a normal occurrence.
The hype about the “double dips” of the polar fields came from some media which made a big story about this normal case ( for the edition and click-counts I’m afraid). Since then this myth is alive up to this post 😉
For the forecast of SC25 are the strength of the polar fields ( north and south and not only the avarage) of interest also:
http://kaltesonne.de/wp-content/uploads/2017/02/bem3.png
These are the data for the last 4 cycles after the zero cross during the maximum of the spots, clockwise. There was never a cycle observed where the fields of one pole were stronger during the whole period of 1400 days. It seems to be that the fields are more decoupled in the downswing of the SC 24 than in the cycles before. The fields swung in also perhaps, one could estimate. This would mean that the next cycle is 1/3 weaker than the SC24. It’s a little bit early, anyway the fields of the cycles before were also stable at this time.
PS: In the figure are shown the absolutes of the fields, filtered data.
Through what mechanism do solar magnetic fields influence Earth’s climate?
They don’t. Not to any sizable extent, at least.
They do aid in heating the upper atmosphere [above 100 km altitude], but that heat does not propagate downwards [the air is so thin that the amount of energy involved is negligible]
Leif Thanks for your March presentation linked above. Undoubtedly your comment re Jupiter and climate refers to the 60 year temperature cycle so obvious since 1880.(or more properly perhaps 3XSaturn /Jupiter lap cycle 3X19.859 = 59.577.) My latest climate forecasts were published in E&E http://journals.sagepub.com/doi/full/10.1177/0958305X16686488

Here is a section from an earlier blog version at
http://climatesense-norpag.blogspot.com/2017/02/the-coming-cooling-usefully-accurate_17.html
Fig. 12. Comparative Temperature Forecasts to 2100.
Fig. 12 compares the IPCC forecast with the Akasofu (31) forecast (red harmonic) and with the simple and most reasonable working hypothesis of this paper (green line) that the “Golden Spike” temperature peak at about 2004 is the most recent peak in the millennial cycle. Akasofu forecasts a further temperature increase to 2100 to be 0.5°C ± 0.2C, rather than 4.0 C +/- 2.0C predicted by the IPCC. but this interpretation ignores the Millennial inflexion point at 2004. Fig. 12 shows that the well documented 60-year temperature cycle coincidentally also peaks at about 2004.Looking at the shorter 60+/- year wavelength modulation of the millennial trend, the most straightforward hypothesis is that the cooling trends from 2004 forward will simply be a mirror image of the recent rising trends. This is illustrated by the green curve in Fig. 12, which shows cooling until 2038, slight warming to 2073 and then cooling to the end of the century, by which time almost all of the 20th century warming will have been reversed. Easterbrook 2015 (32) based his 2100 forecasts on the warming/cooling, mainly PDO, cycles of the last century. These are similar to Akasofu’s because Easterbrook’s Fig 5 also fails to recognize the 2004 Millennial peak and inversion. Scaffetta’s 2000-2100 projected warming forecast (18) ranged between 0.3 C and 1.6 C which is significantly lower than the IPCC GCM ensemble mean projected warming of 1.1C to 4.1 C. The difference between Scaffetta’s paper and the current paper is that his Fig.30 B also ignores the Millennial temperature trend inversion here picked at 2004 and he allows for the possibility of a more significant anthropogenic CO2 warming contribution.
3.3 Current Trends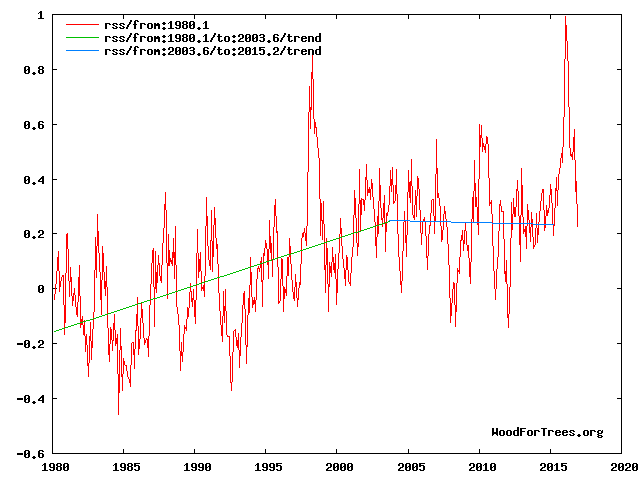
The cooling trend from the Millennial peak at 2003.6 is illustrated in blue in Fig. 4. From 2015 on, the decadal cooling trend is temporally obscured in the RSS temperature data by the recent El Nino. The El Nino peaked in February 2016. Thereafter to the end of 2019 we might reasonably expect a cooling at least as great as that seen during the 1998 El Nino decline in Fig. 4, or about 0.9 C. It is worth noting that the increase in the neutron count in 2007-9 seen in Fig. 10 indicates a possible solar regime change, which might produce an unexpectedly sharp decline in RSS temperatures 12 years later from 2019-21 to levels significantly below the blue cooling trend line in Figs. 4 and 5. This suggestion was also made in Easterbrook’s conclusions. (32)
Undoubtedly your comment re Jupiter and climate refers to the 60 year temperature cycle so obvious since 1880.
No, most certainly not. Milankovitch rules.
lsvalgaard (3/19, 9:08): do you mean that Milankovitch explains the 60-yr cycles?
Of course not. You should pay more attention and study the links I have provided.
a most excellent joke you have played Leif.
let me give you guys a clue.
When Leif cites something or refers to something, go away and read. Then read more. and still more.
Don’t make comments until you master the material he has referred you to.
Here is the simple choice you face.
A) you can take Leif at his word and BUILD upon what he says.. ( stand on the shoulders of a giant)
OR
B) devote years to catch up with him and MAYBE find yourself in a position to challenge his understanding.
here is what you cannot do
you cannot challenge his science with a blog comment. Science is improved by more science, by better science. By better data and better methods. It is not challenged or improved by blog posts and blog comments. The latter, without exception, only show how far you have to go to catch up with Leif.
Sorry. But its been 10 years of watching people flail around trying to show Leif wrong. Not a single one has succeeded. he is a treasure. Ask him questions. Learn. He gives his time freely. you are all blessed to have him here.
From the post: “It also looks like it will have a higher count than Solar Cycle 20 which caused the 1970s cooling period.”
The 70s cooling period was more from the internal variability of the oceans of the EARTH, the AMO had a dramatic downswing at this time (1971/72).
Indeed, and the high count at the last minimum occurred during the highest temperatures evah…
Yes, the behaviour of the sun in the current years is exciting enouph, one should limit to this in a post about the solar dynamo and so on…
Each and every quiet period of prolonged minimum solar activity has been and will be associated with a global temperature decline overall.
This time will be no different. Albedo increasing due to all the various secondary solar effects not to mention a slight reduction in solar irradiance itself will accomplish this and it will be fast not slow when it happens.
I expect the big fall off to be just after this latest El NINO ends. Sooner if the upcoming expected El Nino fails to form.
Just waiting for the solar wind /ap index to fall then all solar parameters will be in my criteria. I expect this is coming sooner rather then later.
Each and every quiet period of prolonged minimum solar activity has been and will be associated with a global temperature decline overall.
Not so:
http://www.leif.org/research/Solar-Activity-and-Temps-NOT.png
Salvatore: “I expect the big fall off to be just after this latest El NINO ends.”
The latest ElNino ended a few moths ago ( in june 2016, see: http://www.cpc.ncep.noaa.gov/products/analysis_monitoring/ensostuff/ensoyears.shtml )
Where is the “big fall”?
“Sooner if the upcoming expected El Nino fails to form.”
Hu? If the “upcomiing El Nino” fails to form there are other reasons for this, see the lack of fuel in the IPWP. It didn’t refilled due to the absence of warmer waters in the west part of the Pacific. Where should the warm water of an ElNino in the east- and central parts of this ocean come from?
It has NOTHING to doe with the sun, more simple physics!!
There is a 12 year delay between the High neutron count at about 1991 and the RSS temperature high at 2003/4 See above and
High neutron count at about 1991
Apart from it being a LOW neutron count [not a HIGH] the cosmic ray hypothesis operates without any lag.
Still showing that old incorrect reconstruction, Leif?
We already saw that Kaufman for the Arctic,
http://i.imgur.com/sgt4K51.png
And Kobashi for the Northern Hemisphere:
http://i.imgur.com/AEdaYwf.png
display the biggest millennial cooling for the 600-700 AD century.
that does not show the MWP? And is the best argument for AGW that I ever saw. People cherry-pick what fits.
“that does not show the MWP?”
It does show the MWP. The biggest millennial warming is between 900 and 1000 AD in both records.
Only in the eyes of a true believer. And shows no effect of the Spoerer minimum.
http://www.leif.org/research/No-MWP.png
Kaufman’s latest may be of interest:
https://www.nsf.gov/news/news_summ.jsp?cntn_id=127658&org=NSF&from=news
“The most comprehensive evaluation of temperature change on Earth’s continents over the past 1,000 to 2,000 years indicates that a long-term cooling trend–caused by factors including fluctuations in the amount and distribution of heat from the sun, and increases in volcanic activity–ended late in the 19th century.
The study also finds that the 20th century ranks as the warmest or nearly the warmest century on all of the continents, except Antarctica. Africa had insufficient data to be included in the analysis.
Global warming that has occurred since the end of the 19th century reversed a persistent long-term global cooling trend, say the researchers. “
Oops
re high/low goof/typo
Leif says, “the high count at the last minimum [2008] occurred during the highest temperatures evah…”
I’m still looking for a cosmic ray cloud. It’s clear skies here at the 45th parallel and no cosmic ray nucleated global cooling mothership cloud decks in sight anywhere during very high cosmic ray activity lately:
http://cosmicrays.oulu.fi/webform/monitor.gif
==>> $100 reward for verifiable real-time evidence of the Cosmic Cloud climate connection.
Temperatures dropped into 2008 because of low solar activity going into the 2008 solar minimum, and in 2008 were far below the ‘highest evah’ temps as of 2008 :
http://climate4you.com/images/SunspotsMonthlySIDC%20and%20HadSST3%20GlobalMonthlyTempSince1960%20WithSunspotPeriodNumber.gif
We expect a 0.1 degree solar cycle due to the cycle variation of TSI, but this is a second order, small, and cyclic effect, so not to worry about.
Leif,
“Kaufman’s latest may be of interest”
That’s the PAGES2K consortium article.
Ahmed, M. et al. (2013). Continental-scale temperature variability during the past two millennia. Nature Geoscience, 6(5), 339.
http://epic.awi.de/32886/1/PAGES2k_NGEO_inpress.pdf
It has multiple issues. Steve McIntyre run an entire series of articles on this:
https://climateaudit.org/?s=PAGES2K
Kaufman is pretty naive when he says:
“The predominant long-term cooling trend is common in proxy records we study in Alaska and elsewhere in the Arctic. Finding it at lower latitudes and especially in the southern hemisphere was surprising”
Only if one doesn’t read the relevant bibliography, because Tropical and Southern Hemisphere Neoglacial cooling has been described for decades. I have always had the suspicion that a lot of climatologists don’t do enough reading in their own field, and that is a capital sin in science.
The non-tropical Southern Hemisphere Neoglacial cooling is well documented in the many glaciers from the Southern Andes and New Zealand reviewed by Porter (2000), that demonstrates that Southern Hemisphere glaciers were smaller during the HCO, and that the early Neoglacial advance culminated between 5400-4900 BP. In southern Africa Holmgren et al. (2003) have shown persistent Holocene cooling since 10,000 yr BP. In Antarctica Masson et al. (2000), identify an early Holocene optimum at 11,500-9,000 BP followed by a secondary optimum at 7,000-5,000 BP. Shevenell et al. (2011), show that the Southern Ocean has cooled by 2-4°C at several locations in the past 10-12 kyr.
In the tropical areas, the fossil coral Sr/Ca record at the Great Barrier Reef, Australia, shows that the mean SST ~ 5350 BP was 1.2°C warmer than the mean SST for the early 1990s (Gagan et al., 1998). At the Indo Pacific Warm Pool, the warmest ocean region in the world, Stott et al. (2004) find that SST has decreased by ~ 0.5°C in the last 10,000 years, a finding confirmed by Rosenthal et al. (2013), that demonstrate a decrease of 1.5-2°C for intermediate waters. East African lakes show temperatures peaking towards the end of the HCO, followed by a general decrease of 2-3°C towards the LIA (Berke et al., 2012). Tropical glaciers at Peru (Huascarán) and Tanzania (Kilimanjaro) display their highest d 18O values (warmest) at the HCO, followed by a general decline afterwards (Thompson et al., 2006).
Why is Kaufman surprised? Has he not read all these articles?
“Kaufman’s latest may be of interest”
That’s the PAGES2K consortium article.
No. Did you even look at the article?
“Northern Hemisphere hydroclimate variability over the past twelve centuries”
Authors: Fredrik Charpentier Ljungqvist, Paul J. Krusic, Hanna S. Sundqvist, Eduardo Zorita, Gudrun Brattström & David Frank
Nature
Vol. 532, pp. 94–98
Published online 6 April 2016
doi:10.1038/nature17418
Leif . Re lag between solar activity and NH temperatrure see
Fig 3 at http://adsabs.harvard.edu/full/2005ESASP.560…19U
Invalid bibliographic code: 2005ESASP.560…19U
Leif tryhttp://adsabs.harvard.edu/full/2005ESASP.560…19U
I think it was Einstein who said: trying the same thing again and again and expecting a different outcome is a sign of insanity.
Same NOT Found response, of course.
Invalid bibliographic code: 2005ESASP.560…19U
Leif, what is the source of the top chart (global temperature) in your 9.05 am reply ?. It seems to show the MWP significantly higher than the current global temperature which I had thought was contrary to current thinking .
https://www.google.com/webhp?sourceid=chrome-instant&ion=1&espv=2&ie=UTF-8#q=loehle+temperature+reconstruction&*
https://www.google.com/search?q=loehle+temperature+reconstruction&espv=2&source=lnms&tbm=isch&sa=X&ved=0ahUKEwiNhYLDl-PSAhWBEpQKHXbWCGgQ_AUIBigB&biw=1646&bih=800&dpr=1.1
Try http://adsabs.harvard.edu/full/2005ESASP.560…19U
Sign on
SAO/NASA Astrophysics Data System (ADS)
Invalid bibliographic code: 2005ESASP.560…19U
Leif,
“Did you even look at the article?”
No, how could I?
Your link:
https://www.nsf.gov/news/news_summ.jsp?cntn_id=127658&org=NSF&from=news
Takes to a page from April 21, 2013.
The text that you display clearly refers to the PAGES2K article.
And Ljungqvist et al. 2016 doesn’t even include Kaufman as an author.
Are you sure you are getting your facts right?
Actually I know Ljungqvist et al. 2016 pretty well. Sometime ago I made a figure comparing Ljungqvist et al. 2016 hydrology with Ljungqvist et al. 2010 temperatures. The correlation is quite good except for two periods.
http://i.imgur.com/DyiE1cF.png
At the bottom of the page it says: Additional information about the study is available at the PAGES Website.
which gets you to the article I have in mind.
Leif,
How am I supposed to know that when you say
“Kaufman’s latest may be of interest”
and put a link to a page, I have to actually go to a different page through another link and look for an article that does not belong to Kaufman?
I don’t know about you, but my telepathic capabilities are still latent.
just checking if you even bother 🙂
I am not a fan of dueling references. As I said, people pick their cherries as they see fit and don’t listen to arguments that disagree and then pretend to be experts. Just look at the usual comments on solar influence. You are no exception.
I’m trying to get you to Fig 3 in this 2005 article ,with which I’m sure you are familiar.
usoskin i, schussler m, solanki sk, et al. solar activity over the last 1150 years,
but the code doesn’t seem to work .I don’t know why.
usoskin i, schussler m, solanki sk, et al. solar activity over the last 1150 years
You probably mean the last 11500 years. That paper is long obsolete. There is no good evidence that recent solar activity is unusual.
“people pick their cherries as they see fit and don’t listen to arguments that disagree and then pretend to be experts.”
An accurate description of yourself too. You are no expert in paleoclimatology.
Just an expert in solar and atmospheric physics. As for the cherry-picking, it is the blind leading the blind.
Norman,
Try this pdf:
https://www.researchgate.net/profile/I_Usoskin/publication/41624745_Solar_activity_over_the_last_1150_years_Does_it_correlate_with_climate/links/0deec51f5888866fa6000000.pdf
It is 1150 years, but I don’t think it is a worthy article.
“Just an expert in solar and atmospheric physics”
And when you talk about paleoclimatology you are as out of your area of expertise as me. And not particularly knowledgeable about it.
As I said: the blind leading the blind, but you do seem to have a case of the DK-syndrome.
Not at all. I just review the bibliography. I don’t add anything that it is not supported on scientific literature.
Leif
Thank you for the excellent links regarding the MWP. I will add those to the other 200 citations about the MWP that i have accumulated. I have a personal rule called the “200 Citation Rule”. When a subject has been referenced in over 200 scientific peer reviewed papers, I feel safe that the phenomenon exists. Now that I am over 200 citations for the MWP, I will ignore protestations from those such as Mosher who say there is no such thing as the MWP.
It isn’t just the linked study that was valuable but also the referenced supporting studies that are interesting to read.
Leif No I mean
Title: Solar activity over the last 1150 years: does it correlate with climate?
Authors: Usoskin, I. G., Schüssler, M., Solanki, S. K., & Mursula, K.
Journal: Proceedings of the 13th Cambridge Workshop on Cool Stars, Stellar Systems and the Sun, held 5-9 July, 2004 in Hamburg, Germany. Edited by F. Favata, G.A.J. Hussain, and B. Battrick. ESA SP-560, European Space Agency, 2005., p.19
Bibliographic Code: 2005ESASP.560…19U
There are both short term and longer term (Integrated over time) relations between the neutron count and climate. For short term see eg
http://www.astrophys-space-sci-trans.net/7/315/2011/astra-7-315-2011.html
“Abstract. The proposed influence of cosmic rays on cloud formation is tested for the effect of sudden intensity changes of CR (Forbush decreases) on cloudiness. An attempt is made to widen the investigated period covered by satellite observation of cloudiness. As an indicator of cloud cover, the diurnal temperature range (DTR – a quantity anticorrelated with cloudiness) is used. The superposed epoch analysis on a set of isolated Forbush decreases is conducted and the results for a region of Europe are presented. The effect of Forbush decrease on DTR is statistically significant only if the analysis is restricted to high amplitude FDs (above the threshold value of 7% with the respect to undisturbed CR intensity). The magnitude of the effect on DTR is estimated to be (0.38 ± 0.06) °C.)”
The longer term connection is more important . The trend of solar activity as it effects climate is best illustrated on the Lockwood Open Solar Flux and Usoskin CR modulation data at PPT slide at 48 http://www.leif.org/research/w6yx-Talk.pdf
For discussion purposes the most useful temperature time series for comparing these with solar activity is seen in Fig 5 at Christiansen B and Ljungqvist FC. Clim Past 2012; 8: 765–786,
http://www.clim-past.net/8/765/2012/
( Fig 3 at )
http://climatesense-norpag.blogspot.com/2017/02/the-coming-cooling-usefully-accurate_17.html
“I will ignore protestations from those such as Mosher who say there is no such thing as the MWP.”
huh?
A Large MWP is what you would expect if ECS is between 1.5 and 4,5.. The higher the MWP the Higher the ECS..
The higher the MWP from natural causes, the MORE concern we have about human warming.
Hi. Are there not periods of earth’s history during which co2 concentration and global temp estimates decouple entirely?
What two variables over long time periods are going to be perfectly correlated?
Gimme a break.
This is clearly man made. We need our governments to introduce a sun-tax to control our usage of this obviously reducing resource. Maybe it can be added to the carbon-tax line on utility invoices for those who choose to get solar-generated energy.
PJ – How about a Red Giant Tax? The politicians will love it, and it could last for billions of years!
The questions is who we should name this tax after – there lots of reds in warmist climate science, but how many of them are really tall?
We could also have a Red Dwarf Tax, named after a warmist climate scientist who is really short.
Nominations will be open for one week – please submit your candidates.
Thank you. 🙂
Leif says
Jupiter changes the orbit of the Earth causing glaciations. see
http://www.indiana.edu/~geol105/images/gaia_chapter_4/milankovitch.htm
Henry says
the article does not even mention Jupiter.
Leif says
Eccentricity varies primarily due to the gravitational pull of Jupiter and Saturn
Henry says
so how does that work? Who figured that out and when?
https://en.wikipedia.org/wiki/Milankovitch_cycles
“Eccentricity varies primarily due to the gravitational pull of Jupiter and Saturn”
so how does that work? Who figured that out and when?
Milutin Milanković. In the 1920s.
I admire your patience!
Slightly o/t perhaps , but there is much speculation about periods of flowing water on Mars . Would the possible effect of Jupiter on Earth climate be even more significant when addressed to Mars?
possibly. I’m awaiting the first ice core from Mars.
But Milankovitch orbital variations are far too slow to account for the way climate bounces back and forth between warm and cold with exceptionally high intensities.
I also have not been able to figure out a mechanism. Somebody must build a solar system on the right scale and time – computer model..
Mars has obliquity instability. Chaotic.
That overlays an unknown signal (obliquity) on top of another unknown signal (eccentricity) in the ice record.
How would you deconvolve that? At the likely epoch resolution of that ice core, deep uncertainties would arise. And just as in terran geology over billions of Earth’s, unconformities likely exist in Mars ice record.
So sorting out deep past Mars hydrodynamics from a Mars mission returned ice core sample would be insightful, but would likely give more questions than answers.
Still, it would be cool. And keep a small army of scientists and grad students employed for decades.
This is a gratuitous comment that detracts from the article. There is absolutely zero evidence that the cooling of 1945-1975 had anything to do with SC20. For a start it was a 25-30 year period cooling, while solar cycles are ~ 11 years. To follow SC20 had more activity than SC24. Where is the cooling caused by SC24, then?
Yes, as I wrote here: https://wattsupwiththat.com/2017/03/19/solar-update-march-2017-still-slumping/comment-page-1/#comment-2454922 . The claim of the article is BS!
Frank I was talking about a future El NINO happening perhaps by this summer. As far as solar activity versus El Nino, data shows that during periods of time of solar quiet El Nino’s seem to be more common.
As far as the drop in temperatures much of it will in the near term be determined by the state of ENSO which up to today has been the main determinate of the climate.
Javier
the decline is there, but you have to get your own data and only trust yourself.
From my results, you can see that the decline in minimum T has started.
“the decline is there, but you have to get your own data and only trust yourself.” This is not bad…if you produce a valid series of global mean temperatures. My personal hero is BEST, they calculate with thousends of data every month. You take 54 stations ( no ocean data??). I would not exchange the BEST data by yours…
frank
I have always been saying that we should concentrate looking at Tmin and Tmax
because there are too many factors influencing Tmean
Not one of your data sets is balanced to zero latitude, so they are all biased towards the NH,
i.e. the number of stations NH = no. stations SH [= means must be]
{if you look at the average change in K/annum, you don’t have to look at longitude, do you know why?]
we cannot trust the satellites either
from 2011 -2014 the solar polar magnetic field strengths were close to zero…..
You gotta be kidding me, right? We could argue that there has not been a significant warming from 2003 outside of the big 2015-16 El Niño, but a significant cooling???? Who knows about the future, but it ain’t happening so far.
Trying to establish a relationship between 11-yr solar cycle activity and temperatures won’t get you very far. It has been tried and the data just doesn’t support it beyond a possible small effect, more noticeable at the stratosphere.
I do not discount a significant climatic effect from solar variability, but it can only be significant at the multidecadal to millennial scale.
Javier
nobody can say for sure what is going on globally with Tmean
My data set shows NO warming in the SH and some warming in the NH in the past 4 decades.
So much for ‘”your global warming”
If there were any man made warming, it should affect Tmin.
My results show Tmin is dropping, since about 20 years ago.
-0.009 x 16 = -0.144
Significant?
When the rooms in my house easily differ by much more then that at any given time?
agree Javier,solar conditions in the 1970’s were not weak enough to have any major climatic impacts.
And a scotsman called James Croll in the 1880’s
https://en.wikipedia.org/wiki/James_Croll
Leif, if you are happy to accept Croll / Milankovich cycles as a source of variation due to changing earth orbit around the sun, what is it about shorter orbital cycle variations that does not convince you?
good point!
That there is no evidence for those having any effect.
Which shorter orbit variations do you mean?
Take a look at the many well documented and accurately dated abrupt oscillations between 10,000 and 25,000 years ago. There is no way these can be caused by orbital variations–it’s time to look for a new cause!
Nor by the sun.
Leif,
Cool, calm and collected does it. Don E is arguing out that orbital variations cannot / do not explain accurately dated abrupt oscillations. I don’t see from what you can surmise that he is suggesting these oscillations are caused by the sun.
If you knew a little bit about Don E., you would know that he is sun-enthusiast.
http://myweb.wwu.edu/dbunny/pdfs/dje_abstracts1.pdf
Leif–yes–I am a sun enthusiast, but that isn’t the question here. The question is how can orbital variations (e.g., Milankovitch) possibly cause the multiple, abrupt climate variations from full glacial to full nonglacial, back to full glacial, and finally back to full nonglacial in time intervals measured in hundreds of years? Obviously you can’t, so orbital variations don’t work. Something else was the cause of these glacial/nonglacial/glacial/nonglacial climate changes and that ‘something’ could just as easily have caused all of the Pleistocene glacials and interglacials.
I have great respect for your astrophysics expertise, Leif, but some of your statements about past climate changes, volcanic cause of glaciations, etc. show a lack of knowledge of the literature in these areas (not that you should, you can’t read everything). For example you cite Porter 2000 as a source, but are apparently unaware of a multitude of papers published in the past couple of years that document glacial and nonglacial isotope chronology, and you mention volcanism as a possible cause of glaciations even though that is virtually impossible because of the shortness of volcanic activity. The literature these days is so voluminous that I have a hard time keeping up with it myself, so I can’t imagine how you could do it in addition to all your solar work. What I’m suggesting is that when you stray into some of these areas you provide some evidence for your assertions.
As for being a sun enthusiast, there is a reason for that. Each of the solar minima (e.g., Maunder, Dalton, 1880-1915, and earlier) show a consistent correlation between SSN, TSI, solar magnetic strength, high production rates of 10Be and 14C (presumably due to increase in cosmic radiation), and global temperature. These correlations are far to good to be just coincidental. You’ve commented on these yourself–what do you make of them?
The question is how can orbital variations (e.g., Milankovitch) possibly cause the multiple, abrupt climate variations from full glacial to full nonglacial, back to full glacial, and finally back to full nonglacial in time intervals measured in hundreds of years?
Nobody says they did, so you are attacking a straw man.
Now, from what we know about the sun, it also cannot cause those swings.
That is all.
You’ve commented on these yourself–what do you make of them?
I don’t think much of them. The correlations are not good, and the proxies are often contradictory.
unaware of a multitude of papers published in the past couple of years that document glacial and nonglacial isotope chronology
You mean like the one cracker345 refers to:
“There were no globally synchronous multi-decadal warm or cold intervals that define a worldwide Medieval Warm Period or Little Ice Age.”
— “Continental-scale temperature variability during the past two millennia,” PAGES 2k Consortium, Nature Geosciences, April 21, 2013
when you stray into some of these areas
And I do not ‘stray’ into anything. I have researched everything I comment on. Some of the references may not be any good [in fact, most of them all are bad], but that is just a reflection on how disconnected and poor the field is.
Don Easterbrook March 19, 2017 at 1:47 pm wrote:
“Take a look at the many well documented and accurately dated abrupt oscillations between 10,000 and 25,000 years ago. There is no way these can be caused by orbital variations”
Evidence? Data?
Don Easterbrook commented:
“As for being a sun enthusiast, there is a reason for that. Each of the solar minima (e.g., Maunder, Dalton, 1880-1915, and earlier) show a consistent correlation between SSN, TSI, solar magnetic strength, high production rates of 10Be and 14C (presumably due to increase in cosmic radiation)”
So? The question is how they affect the Earth’s surface temperature.
Please provide the physics that shows this, and show that it has applied to paleoclimate changes as well.
Javier do you agree with my low average value solar parameters to promote cooling?
Javier I think you think they just will not last long enough during this current period of solar activity but if they were then I assume you would expect a climatic cooling to take place. Correct?
Javier are you surprised the sun is as quiet as it is currently?
No Salvatore, I don’t think there is nothing unusual going on with solar activity. Just a centennial minimum.
The link between prolonged very low solar activity and cold periods during the Holocene appears solid. It is just that this is not the moment for that, and it shouldn’t be for several centuries.
Yes the link between prolonged low solar activity and cold periods during the Holocene is solid and that we agree on 100%.
Let’s see what the sun does going forward.
We are finally at the end of the road of the idiotic climate wars. When there is the start of in your face scary cooling I will present a series of articles (one per week) to explain what the heck is happening to the sun. It is absolutely astonishing/unbelievable how many scientific issues are directly and indirectly connected to what is currently happening to the sun.
Has the earth’s climate change cyclically in the past? Yup. Why? Why the heck are there piles and piles and piles of ignored anomalies and paradoxes? Why the heck has no one bothered to examine the piles and piles of anomalies and paradoxes as a group rather than individually?
There must be a physical explanation for everything that has happened, that is happening, and that will happen.
http://wattsupwiththat.files.wordpress.com/2012/09/davis-and-taylor-wuwt-submission.pdf
Did anyone known notice over the last few years that the big long (a few weeks to a month) lasting sunspots have been replaced with short lived (a few days) groups of tiny sunspots (pores). What we are observing is not a slowdown in the solar cycle. The solar cycle has been interrupted.
Come on man. Why did the sunspots suddenly disappear, three years before the end of the solar cycle?
An example of an earth observation that cannot be explained is the observational fact that was discovered in the last 10 years through the analysis of fired pottery that there have been cyclic abrupt changes to the geomagnetic field that correlate with cyclic abrupt climate changes and which also correlate with solar cycle changes.
It is an observational fact that the geomagnetic field started to abruptly change in the mid 1990s. The B theory (Zombie theory) to explain the abrupt change in the geomagnetic field is that for some unknown reason a massive river of magma started to flow, in the earth. It is better to have no theory (this observation is interesting/weird/paradoxical and needs an explain) rather than to introduce an obvious Zombie theory.
As there is a back EMF generated in the mantel that resists rapid core based magnetic field changes and there is no mechanism that can cause cyclic abrupt changes in the flow of magma in the earth’s core these the new cyclic abrupt changes to the geomagnetic field observations are a paradox.
There are burn marks on the surface of the earth, 12,900 years ago, concurrent with the Younger Dryas abrupt climate change, and current with the largest C14 change in the atmosphere in the current interglacial period (abrupt weakening of the geomagnetic field causes an increase in high speed cosmic particles to strike the earth, this causes an increase in C14 to be formed in the atmosphere and causes an increase in cloud forming ions that causes the cooling, until the liquid core integrates the external change to the geomagnetic field.)
The delay in the earth’s liquid core in integrating the sudden solar change to change to the geomagnetic field explains how a relatively short abrupt change in the sun can cause the Younger Dryas abrupt cooling period, at which time the planet when from interglacial warm to glacial cold with 70% of the cooling occurring in a decade, with the cooling period lasting for 1200 years.
P.S. The YD abrupt cooling period occurred when solar insolation at 65N was maximum which is one of a dozen observations that supports the assertion that Milankovitch’s orbital changes of insolation theory at 65N being the cause of cyclic abrupt climate change and the glacial interglacial cycle is also a Zombie theory.
There are now more than 200 astronomical observation anomalies and paradoxes (burn marks on the surface of the earth and cyclic abrupt changes to the geomagnetic field is an example of one of the 200 anomalies) all of which support the assertion that the sun is a complex active object, not a simple fusion engine. The astronomical anomalies and paradoxes are structured, fit together like pieces in a puzzle when the most fundamental astronomical theory assumption is changed.
The discovery of multiple populations of stars in globular clusters (GC) is an example of one of the new astronomical paradoxes that has been discovered in the last 10 years, that supports the assertion that there are star like objects created in galaxies that are not simple fusion engines.
Globular clusters are regions of space where there is a super over density of ‘stars’. Globular clusters have a population of 10,000 to 1 million star like objects.
The ‘stellar’ density in the core of a globular cluster is the same as the stellar density at the core of a galaxy with the distance between ‘stars’ is roughly the same as the distance between the sun and Pluto as opposed to the normal stellar density in the galaxy of roughly a light year between stars, in our region of space.
‘Stars’ are assumed to be formed only from the initial collapse of a gas cloud. The stars in the collapse of the initial gas cloud have the same elemental content (in astrophysics they refer to stellar element content as chemical content) as the gas in the initial cloud is well mixed.
The new stars which form when the gas cloud collapses (particularly the massive short lived stars in the new cluster which exploded at the end of their short lives, roughly a million years) heat up the gas in the cloud and blowing it away with the super nova ejected gas. This explains why only about 5% of the initial gas cloud forms stars. The rest of the gas is blown away. This fact makes it difficult to explain why there is a super over density of ‘stars’ in the region where the globular cluster was formed.
Globular clusters have been found to have multiple populations of ‘stars’ which have enhanced amounts of light elements when compared to the first-generation stars. The second generation of star like objects (some globular clusters have as many as five separate generations of stars) are each enhanced with different amounts of light elements (each generation has the same amount of enhanced light elements) and have no change in heavy elements.
The second generation of stars in the globular clusters are the majority of the ‘stars’ in the cluster (Range of second generation stars 61% to 75% of the total cluster population, average 68%).
The big bang theory, stellar formation from the collapse of gas clouds theory, and the element changes in stars be caused by nucleosynthesis theory cannot explain Globular cluster stellar multiple population and a host of other Globular cluster observations such as heavy element variance based on Globular cluster location.
https://arxiv.org/pdf/1510.01330.pdf
The solar cycle has been interrupted.
As usual, this is complete nonsense.
“The same procedure as every year”. If one looks for gaps in the mainstream view one should be focussed on the sensitivity, not on the solar influence ( on shorter timescales). It makes no sense to defend an indefendible point of view against all the evidence. The warming since 1950 is definitely not caused by the sun, it’s caused by GHG. The more imortant question is: How much warming is due to GHG- forcing? After 1950 perhaps all…and this leads to a TCR of about 1.3 in contrast to the model mean of 1.85. The rest is internal variability, NOT caused by the sun.
There is no AGW.
I told you.
Can you prove it to me from your own results?
Yes, the solar cycle has been interrupted. A hint is the sunspots properties changed from large long lived sunspots, to tiny short lived pores? … and the sun is not a fusion engine. Science marks on.
The sun is an active objective. The physics are different for an active object. The sun can and does change in charge (There is evidence of massive charge change for other cosmological objects.) This explains the Younger Dryas, 12,900 years ago, burn marks (eighteen locations, two continents) and abrupt changes to the geomagnetic field (recent and past).
Anyway. I will provide a complete explanation of what is an active object if and when there is obvious evidence that the planet is cooling abruptly.
Hint for anyone who is interested in the next breakthrough in science. How would physics change for an infinite universe as compared to a fixed time (let say 13.8 billion years ago) universe?
sun is not a fusion engine. Science marks on
More nonsense. Pseudo-science marches on. The Internet is a fine vehicle for spreading nonsense. And you are a magnificent supplier.
if and when there is obvious evidence that the planet is cooling abruptly.
Go ahead. The temperature here abruptly dropped 5 degrees since yesterday. Archibald might join you.
lsvalgaard March 19, 2017 at 10:30 am
The solar cycle has been interrupted.
As usual, this is complete nonsense.
Don’t these people understand that for the solar cycle to be interrupted, an outside source would be required.
Anything the sun does is part of the cycle. It has happened before.
I know I am being simplistic but after you cover the basic physics the sun is limited to a very small variation.
Please no melodrama,
speculate theorize, but please don’t sensationalize.
No matter which side of the discussion you are on there is nothing “new” under the sun.
Respectfully to all
michael
henryp
March 19, 2017 at 2:06 pm
There is no AGW.
I told you.
Can you prove it to me from your own results?
————————–
Oh boy, hopefully you are not posing that question to Leif…..hopefully!
cheers
I live in NZ. My strawberries have failed due to the cold summer. Everyone we know tells a similar story. We see record cold all over the planet and now crop failure with cold as a common factor.
All of this is at complete variance with AGW.
My strawberries can’t read graphs, They don’t postulate, speculate or argue. Yet the story they tell is in complete accord with those scientists who have been warning us of the coming cooling due to solar activity, which from my observation started in mid 2015.
I suggest you study strawberries, for as I read your posts I conclude you belong to the vast army, who swamped with endless publications on this subject find it increasingly difficult to see the wood due to the extraordinary number of trees in the way.
We see record cold all over the planet
http://www.drroyspencer.com/wp-content/uploads/UAH_LT_1979_thru_February_2017_v6-550×317.jpg
Are you guys enjoying the snow
[as a result of AGW]
???
Frank,
Do you accept that there are other ‘human forcings’ than CO2 that have contributed to temp changes? Land use change, deforestation, aerosol pollution, etc. Why does the human ‘fingerprint’ have to be restricted to GHGs and GHCs alone?
William
good comment
My datasets show that the NH is warming whilst the SH is not.
How do I explain this [if only to myself – because most of the others WANT to believe in global warming…]
Go down here in a gold mine [in South Africa] and discover the elephant in the room///
The North Magnetic Pole moves over time due to magnetic changes in the Earth’s core.[1] In 2001, it was determined by the Geological Survey of Canada to lie near Ellesmere Island in northern Canada at 81.3°N 110.8°W. It was situated at 83.1°N 117.8°W in 2005. In 2009, while still situated within the Canadian Arctic territorial claim at 84.9°N 131.0°W,[2] it was moving toward Russia at between 55 and 60 kilometres (34 and 37 mi) per year.[3] As of 2016, the pole is projected to have moved beyond the Canadian Arctic territorial claim to 86.4°N 166.3°W.[2]
I am not stressed, but earth maybe stressed at a few points where there seemed to have been dead volcanos for a long time…..
henry: “My datasets show that the NH is warming whilst the SH is not.” My datasets say no to this:
http://www.woodfortrees.org/graph/hadcrut4sh/from:1980/plot/hadcrut4sh/from:1980/trend
Frank
like I said to you before
your data set is not balanced to zero latitude + the no. of weather stations NH is not equal to no. weather stations SH.
Apart from that, your data set does not look at the average rate of change in K/annum and hence the balance on longitude is also important…..[your data set is not balanced on longitude either]
henry: I don’t understand your argument: ” your data set is not balanced to zero latitude + the no. of weather stations NH is not equal to no. weather stations SH.” AFAIK the data sets use the anomaly and they also consider the latitude ( and longitude) of the station. You claim they do not. Do you have some evidence for this?
frank
I hope you are genuinely interested

here is a sample of unbalanced sample of mine
{I started at my home town in Pretoria}
I could not find any ‘global” warming here,
in South Africa…..
Exactly William and the evidence keeps mounting as solar cycle gets weaker and weaker way ahead of schedule.
There is no ‘schedule’ as the cycle is not predictable more than half of a cycle in advance.
” …gets weaker and weaker way ahead of schedule. ” Riiiiight. The solar cycle has a schedule. Now I’ve heard everything. Maybe it’s time to put Salvatore back in the bit bucket, because his comments are mostly garbage.
Interesting exchange of views.
I can see that the gravitational effect of Jupiter and Saturn on Earth’s orbit could have an effect, as per Leif’s comments, resulting in the major glaciations and that factor is way larger than any effect from solar variability.
However, the current climate ‘scares’ involve much smaller climate variations that,occur on shorter timescales such as the approximate 1000 to 1500 year cycling between MWP to LIA to the current warmth.
Recently, such variations have been declared to be caused by changes in CO2 quantities in the atmosphere but that may well be an error.
For that shorter periodicity, solar variations do appear to be relevant and many suggest that it is due to the effect of cosmic rays on global cloudiness attributable to cosmic rays providing more condensation nuclei for cloud formation.
I tend to be sceptical of that because there is no shortage of cloud condensation nuclei in any event. The atrmosphere is replete wiuth potential condensation nuclei and has no need of cosmic rays.
More likely, IMHO, solar variations have an effect on global cloudiness by altering the gradient of tropopause height between equator and poles so as to affect jet stream behaviour and global cloudiness:
http://joannenova.com.au/2015/01/is-the-sun-driving-ozone-and-changing-the-climate/
One also has to consider the effect of ocean cycles which can either offset or supplement the effect of solar induced climate variability so as to cause either an acceleration or significant delays in the solar effect. One could argue that ocean cycles supplemented the effect of low solar cycle 20 to cause a rapid effect but are now offsetting the effect of low cycle 24 to cause a delayed effect.
I have trouble with the complete faith that people have in milo. cycles. First, it is only an empirical relationship between global temps with both obliquity (41k period) and eccentricity (100k period). Based on peoples faith in that (milo) we should just toss C02 since it fails to lead temp.
Second, the mechanism between Milo cycles and climate is based mostly on variations in the northern isolation (oblq.) and TSI (ecc.) always have exceptions to the rules when compared to ice cores and other proxies.
The climate swings seem to have several strong control knobs, and with the crazy interplay with volcanoes, AMO, PDO and albedo it simple strikes me as a systems that is partially predictable but always surprising.
The single control knob theory, I don’t believe in, especially not C02, but we are still a long way off. I wouldn’t be surprised if the oscillation of the polar vortex causing a hugh winter storms about every 50k that struck both Asia and NA caused a large enough albedo swing to launch ice ages now and again.
“I have trouble with the complete faith that people have in milo. cycles.”
Probably because you haven’t looked at the data yourself. No doubt many factors affect whether there is an interglacial or no, but when there is one, it happens during the upswing of an obliquity cycle. And when obliquity goes down, interglacials end. No exceptions so far.
http://i.imgur.com/5h2TSo3.png
Anyone who still believes in Milankovitch cycles should go back to the original data and you will see that the critical correlation between orbital cycles and temp is based on circular reasoning. Then read up on the D/O cycles and other strong, abrupt, climate changes of as much as 20 F in 100 years or less, none of which are explainable by Milankovitch cycles. These are not just minor changes, they are from full glacial to full non-glacial and back. It just doesn’t work.
Nor by the Sun.
“Then read up on the D/O cycles and other strong, abrupt, climate changes of as much as 20 F in 100 years or less, none of which are explainable by Milankovitch cycles. These are not just minor changes, they are from full glacial to full non-glacial and back. It just doesn’t work.”
You don’t seem to know much about D/O events. Try here:
https://judithcurry.com/2017/02/17/nature-unbound-ii-the-dansgaard-oeschger-cycle/
Leif,
Don did not suggest it’s the sun. He doesn’t buy the M cycles, in which he is not alone.
Javier
March 19, 2017 at 11:54 am
Hello Javier.
Hopefully I am not wrong, but are you not the “guy” who produced a research that in essential contradicts and upsets the orthodoxy of climatology and the paleo climate data that it is based on…….and still rely so much and heavily in the ice core data, while your own “research” basically contradicts it!?
How is that a non contradiction!
cheers
“are you not the “guy” who produced a research that in essential contradicts and upsets the orthodoxy of climatology and the paleo climate data that it is based on…….and still rely so much and heavily in the ice core data, while your own “research” basically contradicts it!? “
You are completely wrong, Whiten. I am not a climatologist, so I do not produce any original research on climate. As a scientist interested in paleoclimatology, I read hundreds of articles on paleoclimatology, and I apply the scientific method to the evidence they present, and I accept what the evidence shows.
For example in my bibliographic review a few months ago of the glacial-interglacial cycle published here:
https://judithcurry.com/2016/10/24/nature-unbound-i-the-glacial-cycle/
I pointed that the evidence clearly supported several conclusions that although defended by a few scientists, are not clearly part of the consensus. They are:
– Interglacials respond most to the obliquity cycle, not to the precessional insolation cycle.
– There is no 100 kyr glacial cycle. It is an artifact of the data. In the Late Pleistocene interglacials usually skip one obliquity cycle. When eccentricity is very high they occur at every obliquity cycle. Last glacial was the first time 2 obliquity cycles were skipped.
A very recent article has shown that this is the correct interpretation of Milankovitch cycles, providing very strong support for the views that I have developed simply from analyzing the evidence presented by other researchers. That’s how the scientific method works. Sooner or later the evidence always leads you to the correct interpretation.
Tzedakis, P. C., et al. “A simple rule to determine which insolation cycles lead to interglacials.” Nature 542.7642 (2017): 427-432.
http://www.nature.com/nature/journal/v542/n7642/abs/nature21364.html
It gives a very warm feeling that the non-consensual hypothesis that I arrived to from analyzing the evidence receives such strong support by new research. It is also another example of how scientists can get it wrong for decades because they do not challenge the established paradigm on the light of new evidence. The 100 kyr cycle does not have a mechanism, it is supported by flimsy evidence and creates numerous contradictions like the 100 kyr problem, or the causality/MIS5/Termination II problem.
The only contradiction comes from researchers that refuse to take the data at face value and rather engage in hypothesis justifications.
Javier
March 20, 2017 at 12:13 pm.
Hello Javier….even that I did not say, imply or even consider that you were a climatologist, I think I was wrong about you…
I took you for some other guy……the ” the failed interglacial” guy, posting and commenting at WUWT few days ago…..who had redefined, to his own heart content, the ice ages and glacial periods and had his own very rounded up number of the thermal expansion of the atmosphere in a full climatic swing…….
Sorry Javier, mea culpa……
Thanks for the reply…..
cheers
Javier:
Probably some confusion about which one is meant. Perhaps Norman really wanted to reference
http://adsabs.harvard.edu/abs/2004Natur.431.1084S
“Direct observations of sunspot numbers are available for the past four centuries, but longer time series are required, for example, for the identification of a possible solar influence on climate and for testing models of the solar dynamo. Here we report a reconstruction of the sunspot number covering the past 11,400 years, based on dendrochronologically dated radiocarbon concentrations. We combine physics-based models for each of the processes connecting the radiocarbon concentration with sunspot number. According to our reconstruction, the level of solar activity during the past 70 years is exceptional, and the previous period of equally high activity occurred more than 8,000 years ago. We find that during the past 11,400 years the Sun spent only of the order of 10% of the time at a similarly high level of magnetic activity and almost all of the earlier high-activity periods were shorter than the present episode. Although the rarity of the current episode of high average sunspot numbers may indicate that the Sun has contributed to the unusual climate change during the twentieth century, we point out that solar variability is unlikely to have been the dominant cause of the strong warming during the past three decades.”
since he is interested in 1000-year swings.
In any case, that paper is no good either.
Javier March 19, 2017 at 12:36 pm
Not at all. I just review the bibliography. I don’t add anything that it is not supported on scientific literature.
You cherry-pick and think it is valid reviewing. The literature supporting AWG is much larger. Do you review that as well?
there is no AWG
nor is there any AGW
and neither is there any plausible theory to show that CO2 traps heat on earth.
There is a very LARGE literature on AGW. Does Javier review that to the same extent as he reviews the anti-AGW literature. If so, that would interesting.
you mean Tyndall; Arrhenius?
they looked at the closed box experiments…..
nobody looked how much CO2 cools the atmosphere?
That the CO2 is cooling the atmosphere is the reason why we can identify it on other planets…
http://astro.berkeley.edu/~kalas/disksite/library/turnbull06a.pdf
anyway, we are going OT here
Yes. I read articles about paleoclimatology regardless of whether they support AGW or not. That is irrelevant. What is valuable is the evidence that they present. The evidence is hypothesis neutral. It is the hypothesis that has to explain the evidence, not the other way around. In general I let the evidence speak by itself. When new evidence becomes available I change my mind if required. I used to think that solar variability could not cause a big effect on climate until I looked at the evidence.
I am also neutral to AGW hypothesis. I have nothing against CO2 being the main cause of global warming, I just don’t think it is supported by evidence. A significant contributor yes, but natural variability is also important.
I used to think that solar variability could not cause a big effect on climate until I looked at the evidence
That is the point. The evidence is simply not good. Hence the on-going flailing around. What you are doing is to interpret the lousy evidence to see if it confirms your changed viewpoint.
I have nothing against CO2 being the main cause of global warming, I just don’t think it is supported by evidence
In fact the graph you showed is the strongest evidence for AGW that I have seen for some time:
http://i.imgur.com/sgt4K51.png
“What you are doing is to interpret the lousy evidence to see if it confirms your changed viewpoint.”
That’s your opinion. As a trained scientist I do the opposite. I tried hard to disprove the evidence that most grand solar minima of the past, and specially clusters of solar minima do not correspond within dating uncertainties with periods of significant cooling and climate change during the Holocene, and failed. My argument used to be the the LIA was just one event and didn’t demonstrate much. Then I looked at every period when clusters of solar grand minima have occurred, and every single one of them had pretty good evidence of important cooling and hydrological changes associated. A very coherent picture emerged. Don’t miss my series of articles at Climate.Etc I will be showing it with detail.
“In fact the graph you showed is the strongest evidence for AGW that I have seen for some time:”
I do believe the evidence points that AGW is real. Cryology is pretty clear that current glacier retreat is outside Neoglacial trends. I have had discussions about it here at WUWT. If evidence shows it, then it must be real, whatever we think about it. But other evidence shows that an important part of the warming is natural, so the catastrophic part of CAGW is almost certainly not real.
Then I looked at every period when clusters of solar grand minima have occurred, and every single one of them had pretty good evidence of important cooling and hydrological changes associated.
Part of the ‘solar’ record is actually a climate-contaminated record, and we don’t know how to separate that from the real record, hence the evidence is not good. But I think you have invested too much emotion in your conversion to acknowledge that fact.
And I do happen to be an expert in solar activity and cosmic rays. Not just from reviewing hand-picked literature, but from actually doing research in those areas.
“Part of the ‘solar’ record is actually a climate-contaminated record”
We have discussed this several times already. Your contamination argument is not very convincing because we are talking about the periods of highest 14C production of all by a big difference. Therefore they have the biggest signal to noise ratio of the proxy. If it cannot be trusted that these periods correspond to the lowest solar activity periods then the entire proxy has to be thrown to the trash, and that is not what the scientific community believes. If they do correspond to the lowest solar activity periods then the climatic relation holds true. There is no other way around. We are not arguing here if some part of the 14C production reflects climatic contamination. We are arguing if 14C production reflects solar activity or not. If it does, then solar variability has an important impact on climate.
We are arguing if 14C production reflects solar activity or not
You very carefully used ‘reflects’ in order not to commit yourself. We are arguing whether climate has enough contaminating effect to make the C14 record unreliable as a pure solar indicator. You choose not to think so because that would undermine your view. Lots of people have a similar attitude so you are in good [?] company.
“We are arguing whether climate has enough contaminating effect to make the C14 record unreliable as a pure solar indicator.”
I beg to differ. It doesn’t mind if the 14C record is contaminated or not, or if it is a pure solar indicator or not. If the 14C record reflects solar variability, then grand solar minima identified in the 14C record represent periods of low solar activity. It doesn’t mind if part of the signal comes from climate contamination. However if grand solar minima identified in the 14C record do not represent periods of low solar activity then we should throw the proxy to the trash. Every proxy has noise or is contaminated. The only question if it reflects changes in the parameter that it represents.
And we have evidence that grand solar minima represent periods of low solar activity.
http://i.imgur.com/ubjPFYH.png
The only question if it reflects changes in the parameter that it represents.
No, you still use the evasive word ‘reflects’. The only question is if the contamination is small enough that it doesn’t matter, and there is good evidence that it is not small, e.g. that different reconstructions [ice cores, tree rings,…] disagree.
In addition, there is the issue of mechanism [if any] which is still unsolved.
“The only question is if the contamination is small enough that it doesn’t matter”
That it doesn’t matter for what? All depends on the conclusions that you want to extract from a proxy, because every proxy has its problems. To link solar variability to climate the only thing that is needed is that periods identified as solar grand minima in the 14C record correspond to periods of low solar activity. Not a very strict requirement.
“there is the issue of mechanism [if any] which is still unsolved.”
That only speaks of our ignorance. That we don’t know something, doesn’t change that it might be real, if the evidence supports it. Alfred Wegener had a lot of evidence from geology, geography, paleontology, and biology, yet no mechanism. It didn’t make the continental drift less real, it just made the theory shunned by the experts then, as you shun solar variability effect on climate.
All depends on the conclusions that you want to extract from a proxy, because every proxy has its problems
Indeed, it all depends on what you want to see.
It shows no evidence for co2 having anything to do with the climate. Zero
Javier shows pretty good evidence:
the best hockeystick I have seen in some time.
Come on Leif,
Take a carpenter’s level and run it from the black line high point under the B and AD400 to the highest black line point on the right hand side of the graph and you’ll see they’re at the same temp. Sun be damned but that certainly provides no evidence for a Mannian Hockey Shlock nor for the A or the C in the CAGW/CACC hypothesis.
Looks like a perfectly good Hockeystick to me:
http://www.leif.org/research/No-MWP-but-HStick.png
Due to Milankovitch cycles we are on our way to a new glaciation so the long-term trend is down [colder]
This should all be obvious. Unfortunately even a word like hockey becomes taboo if it spend any time bouncing around in echo chambers.
There are dozens of anthropogenic hockey sticks. Most of them have the bend around 1850.
Here are two more.
http://forum.arctic-sea-ice.net/index.php?action=dlattach;topic=1178.0;attach=14736;image
Leif:
Maybe not astrophysics experts like you, but we are not all idiots around here – your arrogance shines through again.
Stretch the scale and you’ll find nice hockey sticks between AD 300-400 and between AD 650-750. Have you noticed that the black line was well on its way down around AD 2000 [ roughly at the level of ca.1550]?
And that this graph tells us absolutely nothing in terms of the purported A in cAgw of cAcc?
we are not all idiots around here
Many make a pretty good imitation, it seems to me.
As for hockeystick:
http://www.leif.org/research/No-MWP-but-HStick.png
looks even more like a hockeystick than Mann’s original:
http://www.schuylkillcenter.org/blog/wp-content/uploads/2015/11/Hockey-stick-graph-1024×256.png
don’t you think?
Dr. S,
Did you actually read the article from which you lifted the bogus graph?
It is Mann’s HS on steroids. The perpetrators grafted thermometer data onto paleo proxy data.
You need to have a Science account to read the whole shebang, but here is the link:
http://science.sciencemag.org/content/325/5945/1236?variant=full-text&sso=1&sso_redirect_count=1&oauth-code=c04c2592-5a1f-4dcd-9fe4-1913106a7746
You should be ashamed of posting such utter garbage.
If memory serves, Javier served up that graph in support of one of his opinions. Perhaps you should try to pay more attention before you put foot in mouth…
How is pointing out that a graph is totally bogus and antiscientific putting my foot in my mouth. If Javier posted it, he too should be ashamed. But I doubt that he would stoop that low. I could be wrong.
I could be wrong.
Indeed. It is everybody’s prerogative to be wrong. It only becomes problematic if what you claim is ‘not even wrong’ https://en.wikipedia.org/wiki/Not_even_wrong
Whether his graph is garbage is another matter and Off Topic.
10 years ago and more David Archibald, author of this article, was confidently predicting global cooling due to reduced solar activity.
Reduced solar activity duly occurred; global cooling did not. In fact, further global warming occurred.
My question to David Archibald is simple:
Why do you believe warming continued during a period when you predicted cooling?
See Figure 6 above. A great mass of the ocean is cooling rapidly. The atmosphere has very little mass by comparison.
You are correct, Archibald.
And in addition :
We normally have a “pingpong” between warm effect and cold effect from peaks and lows in Solar Cycle activity.
The situation right now is essential because we had a warm effect from peak of SC23, then a cold effect from the minimum SC23-24, and then NO WARM peak activity, really from SC24.
So when we now enter the SC24-25 minimum period of cold effect, we are having TWO cold minimum periods in a row (SC23-24 and then SC24-25) without a warm period in SC24 in the middle.
THIS is why its NOW we should start seeing the more visible effect of Solar low activity. We are entering second cold period without a warm to balance it in between. Thus, a cooling mostly visible in the recent years make perfectly sense.
Thank you David for extremely interesting contributions year after year! You are a superb thinker 😉 and its always very interesting to follow your thoughts. K.R. Frank
So he was wrong in his initial prediction. You and others have probably pointed that out several dozen times over the years.There are multiple factors interacting to produce the climate as we see it. The oceans are still the primary agent of change for the short term cycles of 30+ and 60+ years, imo. That change is ongoing, although there is a solar connection it just isn’t with tsi or sunspots. Cooling will come when the ENSO regions turn strongly negative. That should take place over the next 2 years, imo. Then we will see just how cool it will get.
By the way the solar minimum is likely to arrive by early 2019 or late 2018 or potentially slightly earlier, imo. I was correct back in early 2015 when I said that the sunspot would drop down low by the end of 2016. I remember that some did not expect that to occur and said “We will see”. Look at the steep rise in the Oulo monitor over the last half a year.
goldminor
” Cooling will come when the ENSO regions turn strongly negative. That should take place over the next 2 years, imo. Then we will see just how cool it will get.”
and
“the solar minimum is likely to arrive by early 2019 or late 2018”
So if temperature continue to trend higher between say now and 2020 that would be pretty convincing evidence that neither solar activity nor ENSO fluctuations make much difference to the overall temperature trend? And that there must be some other factors at play?
goldminor
If you accept that this can be used to explain why David Archibald’s predictions have failed so far then you must also accept that it can equally be used to explain why some (but by no means all) of the CMIP5 models have shown too much warming so far.
We have pretty good evidence now that oceans have warmed over those time scales. How can the oceans be warming the surface with no net loss of heat themselves; indeed, with a net gain in heat?

And this during a period of reduced solar output.
@ur momisugly tony mcleod….yes, if the temp trend continued to rise over the years till 2020, then it would be evidence of some other factor at play, imo. At that point the solar minimum should have had its normal effect of slightly lower global temps. The ENSO regions should cool over the next 18 months approximately, before seeing a return to some level of positive temps.
@DWR54…imo, the heat gain in the oceans is the reason why the planet experiences periods of global warming, natural global warming. The slight reduction in solar output has little to do with the oceans cooling, except perhaps at the depth of the solar minimum.
DWR54
You mean the statistically not significant “global warming” that even the UK Met Office [hardly a bastion of skeptics] agrees has not occurred during the “pause” that’s coming up for 20 years? A 2015-2016 0.01C delta inside a 0.1C margin of error does not constitute evidence for anything – certainly not “CAGW/CACC”.
Leif,
Your knowledge of solar behaviour is very useful.
Your knowledge as to how solar behaviour impacts the Earth’s climate is, perhaps, less useful..
I am aware of your past involvement in climate research generally and so mean no disrespect but I really would like to know whether you accept that changes in solar activity could affect the balance of ozone creation / destruction above the tropopause differently between equator and poles. Recent data appears to suggest that a more active sun reduces stratospheric ozone above 45 km but increases stratospheric ozone below 45 km whereas a less active sun does the oppposite.
The point being that the amount of ozone in the stratosphere influences the height of the tropopause so if the solar effect is different above equator and poles then the gradient of tropopause height between equator and poles will be affected.
If one changes that gradient then the jet stream tracks between the establshed, permanent, climate zones will be altered and that results in changes in global cloudiness which will inevitably change the net balance of solar energy penetrating the oceans.
If one changes the net balance of solar energy penetrating the oceans then one can change the balance between El Nino and La Nina thereby affecting global air temperatures.
What do you say ?
What do you say ?
We have found how to reconstruct EUV [and TSI and magnetic field] back several hundred years and their variations do not match that of the climate, so there seems to be little support for the idea you are putting forward, unless you argue that Ozone production happens in other, unknown ways, perhaps driven by the climate processes themselves.
Leif,
I have referred to solar induced top down wavelength and particle variations affecting the ozone creation /destruction balance differently above equator and poles so as to influence jet stream behaviour and alter global cloudiness.
How does your reconstruction of EUV, TSI and magnetic field assist in view of the ability of ocean cycles to sometimes supplement and sometimes offset the thermal effect of solar variations ?
I suggested that ocean cycles supplemented the solar effect of cycle 20 for a rapid response but thus far they seem to be offsetting the effect of cycle 24 for a delayed response.
The entire climate system responds to the interplay between the top down solar effect on ozone in the stratosphere and the bottom up effect of ocean cycles in the troposphere.
What data do you have that negates any solar effect on that interplay ?
The heart of the issue is the gradient of tropopause height between equator and poles. That is critical to jet stream behaviour and global cloudiness.
We saw the period of active sun reducing ozone above the poles (the ozone hole panic) so that the height of the tropopause rose above the poles and the jet streams moved poleward with reduced global cloudiness.
With the quiet sun the ozone amounts above the poles appear to be recovering and the jet stream tracks have become more wavy with increased global cloudiness.
Thus far the changes have been sufficient to cause a cessation of warming (the pause) but not yet cooling.
What solar data do you have to rebut that hypothesis ?
How does your reconstruction of EUV, TSI and magnetic field assist in view of the ability of ocean cycles to sometimes supplement and sometimes offset the thermal effect of solar variations
They show that the 20th century has not been unusual, but rather much like the two preceding centuries, so presumably [unless you can show otherwise] the effect of UV on the earth has also been pretty much the same the last three hundred years, yet the climate does seem to have changed rather much, thus likely not due to changes in UV and its effects. If you argue that we cannot see the effect of UV because ocean cycles are actually the controlling factor, then we can forget about ozone and should concentrate on the ocean cycles. Not a bad thing, IMHO. I could accept that.
If you look at jet stream behaviour you can see that during the LIA the jets were very wavy with storminess down to low latitudes as evidenced by ship’s logs. During periods of high solar activity the jet stream tracks were less wavy and more poleward. During the MWP the Scottish Isles were more heavily populated with easy boat traffic between them which could not be entertained today.There was a TV programme a few years ago that said the jets streams were moving poleward and it was all our fault but since 2000 they have become more wavy again with the advent of quietish cycle 24.
I’m glad you can accept the ocean cycles as a controlling factor on the atmosphere but that begs the question as to what controls the ocean cycles.
If you go with me and accept that solar variations affecting jet stream waviness and global cloudiness are the ultimate driver of variations in ocean cycles then we can square the circle.
If you go with me and accept that solar variations affecting jet stream waviness
Except that there is no evidence for that, just speculation.
I’ll repost this:
They show that the 20th century has not been unusual, but rather much like the two preceding centuries, so presumably the effect of UV on the earth [and on ocean cycles] has also been pretty much the same the last three hundred years, yet the climate does seem to have changed rather much, thus likely not due to changes in UV and its effects on ocean cycles.
Agree with Stephen.
Does someone mind explaining this post to a newbie? Why aren’t we seeing are we seeing an increase in temperature if the Sun’s activity is falling? What am I misunderstanding?
The two are unrelated. How else can a lack of correlation be interpreted.
@Crispin
Here is an example for straight-line “Path Loss” between two stations in free (unobstructed) “space” along a straight line calculated using the well-known Friis Equation (see previous link supplied above for on-line calculator).
Assumption are 100 Watts, both stations using dipole antennas on 6 meters.
Transmitter Power: 50 dBm (100 Watts)
Transmitter Antenna Gain (dBi): 2.1 dB (dipole)
Frequency: 52 MHz
Distance: 5000 Miles (about 8000 km to Germany along great circle)
Receiver Antenna Gain (dBi): 2.1 dB (dipole)
Calculated Received Power: -90.61 dBm
For a relatively decent receiver, say 0.3 uv (about -123 dBm) for 10dB S+N/N ratio this means the SNR is considerably above the threshold for copying, in fact, about 32 dB better. AND this was just using a pair of dipoles over a free space path length of 8,000 km.
So, does the ionosphere *have* to work to “conserve” energy to allow you to make a contact? It does not appear to be strictly necessary, as a free space path gives you about 32 dB of ‘margin’ to work with, and the ionosphere can therefore be 32 dB _more_ ‘lossy’ than a “free space” path and still work as shown in this example.
I think my math is correct – let me know.