Guest essay by Alberto Z. Comendador
In two previous articles I made a point that seems inarguable but that advocates of emission cuts seldom acknowledge: the only worthy metric of progress in reducing emissions is the CO2 intensity of GDP, which one could also call CO2 efficiency. Looking at absolute emissions is absurd because absolute emissions depend largely or mostly on GDP and the growth thereof, which are of course unknown (especially if we’re making projections about the year 2100!).
In any case, climate policies aren’t supposed to reduce emissions by reducing GDP; sometimes advocates of emission cuts even brag about the economic benefits of their policies. So they can only work by reducing CO2 intensity, which is to say by increasing CO2 efficiency.
A second point hardly ever acknowledged is that CO2 efficiency isn’t static: it’s growing most of the time, in most places. It would have grown without the COP meetings and it did grow before the Kyoto agreement was signed – at a faster pace than thereafter.
Since CO2 efficiency is nearly always rising, using an absolute value doesn’t make much sense, especially for comparing progress across different countries and eras. Of course CO2 efficiency was higher in 2015 than in 1965, but that doesn’t mean the policies were better in the former year than in the latter. Likewise, the fact that Sweden is more CO2-efficient than India tells us nothing about the effectiveness of each country’s policies. What matters is the rate at which CO2 efficiency rises. The ‘rate of increase in CO2 efficiency’ is a mouthful, so instead I call it the rate of decarbonization.
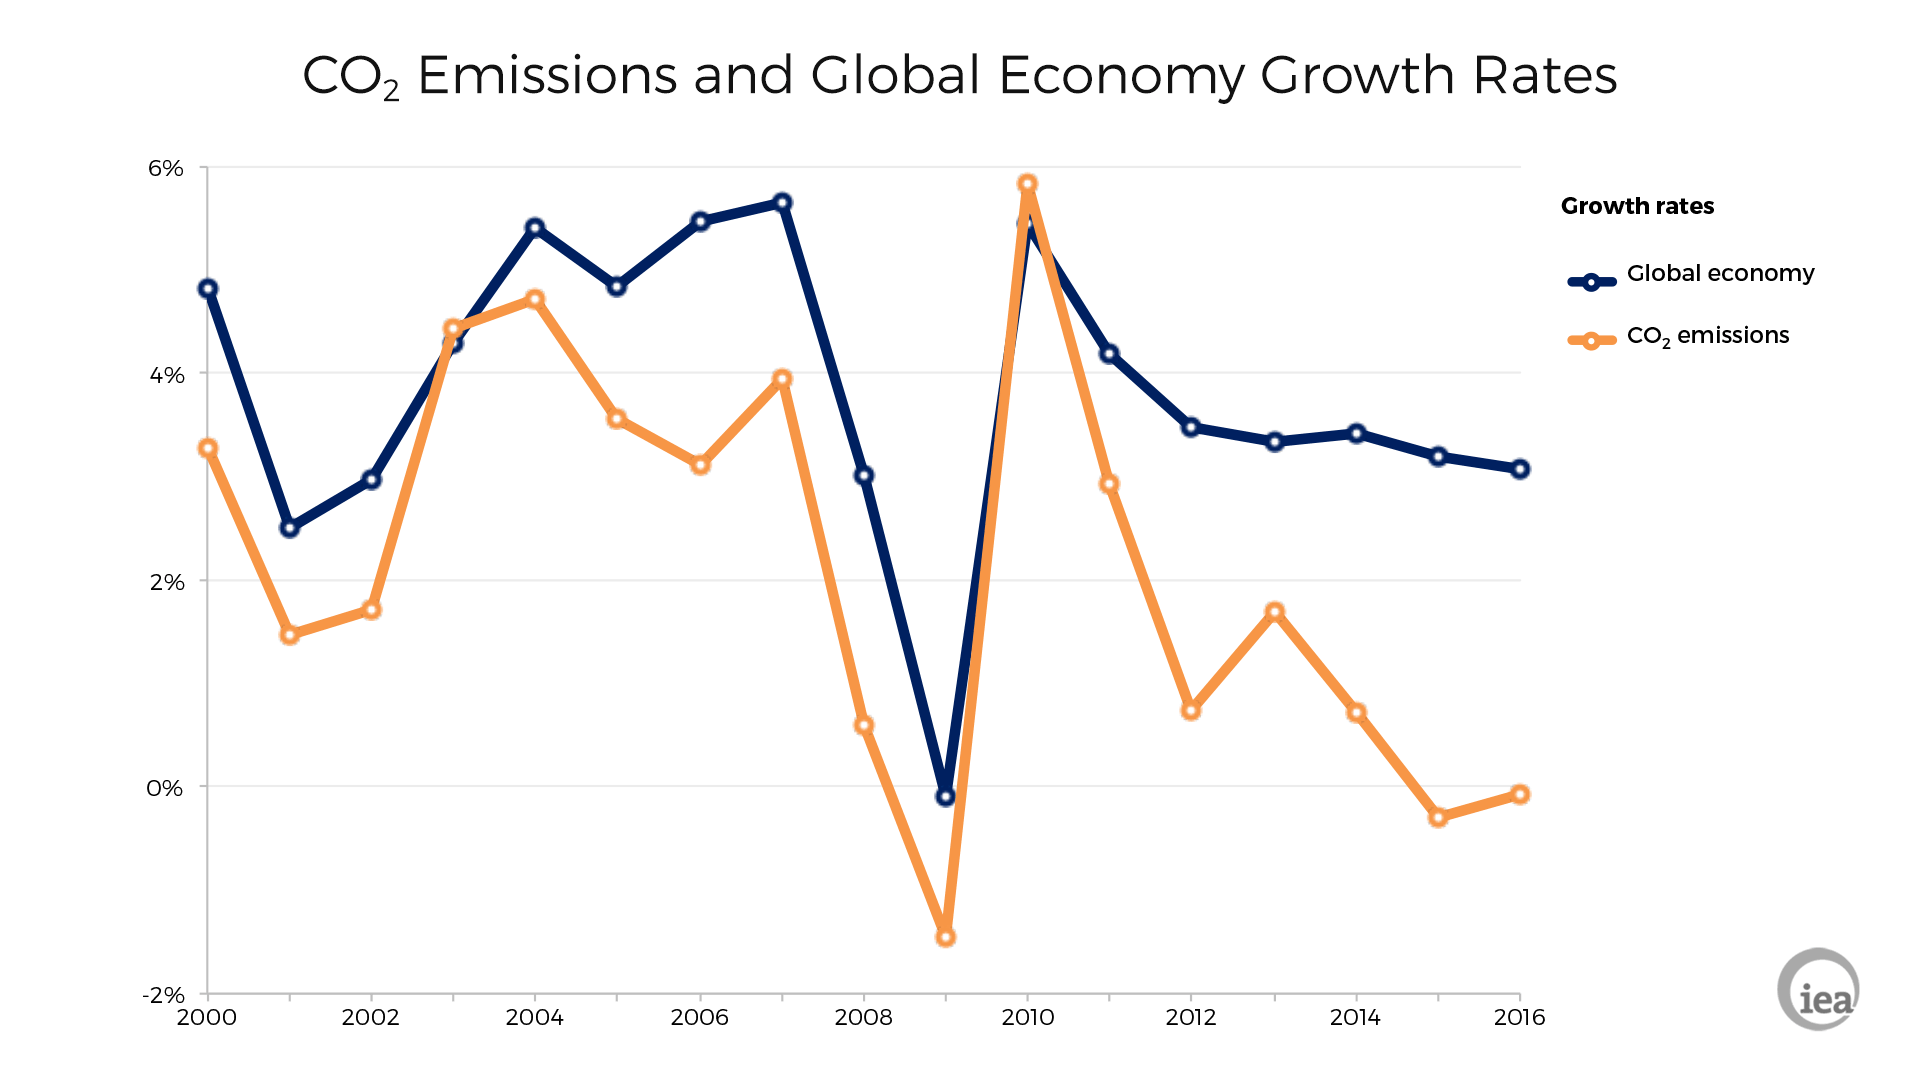
The last three years have had a high rate of decarbonization, which has prompted some bureaucrats to declare ‘victory’ over CO2. In particular, the International Energy Agency has just come out with this macro-cherry-pick:

They must think GDP was invented in 2000! Guess what happened before that year?

Ooops: turns out the decarbonization seen in the last three years isn’t that ‘abnormal’ by historical standards. It’s higher than the average, but then the 2000-2013 period had abysmal rates. And, no matter what starting period you choose (Kyoto 1997, Energiewende 2000, etc), the period during which decarbonization policies were implemented had a slower rate of decarbonization than the previous.
(I couldn’t update my chart with 2016 data because BP hasn’t published those emissions yet. But every time someone claims climate policies have achieved this or that, send them the second chart).
What will happen if we do nothing?
In the last article I estimated that climate policies could only avert 0.38ºC of warming by the end of the century. The assumptions behind this estimate were:
- GDP growth remains constant at the 2011-2015 average, i.e. 2.7%. In reality, GDP growth has been decelerating; constant per capita growth would make more sense. But I wanted to be ‘pessimistic’ emissions-wise.
- The fraction of emissions that remain in the atmosphere is 45%.
- There were two possible rates of decarbonization: ‘do nothing’ (1.1%) and ‘do something’ (2.1%)
- The transient climate response is 1.35ºC
Under the ‘do nothing’ scenario, concentrations reached 754ppm by the end of the century; that’s 22% more than under the ‘do something scenario’ (619 ppm) and, due to the logarithmic effect of CO2, it’s equivalent to 28.5% of a doubling of CO2; 1.35ºC x 0.285 = 0.38ºC.
What would have happened if we’d done something?
Here’s where it gets hilarious. Some claim not only that we could avoid the allegedly bad stuff that will happen by the year 2100, if we would only start decarbonization now. They claim that we area already seeing the impacts of our emissions – and that these could have been avoided!

Well, well, the Charney report came out in 1979 and was the first official assessment of climate sensitivity and anthropogenic global warming; hardly anyone outside the scientific community was reading on the topic before that. So let’s assume that, way back in 1979, the whole world saw the light and started decarbonizing. And let’s do the math.
Over 1979-2015, the world emitted about 890 billion tons of CO2 from fossil fuel combustion; the rise in CO2 concentration over the period was of 50 parts per million (roughly from 355 to 405). It takes 7.81 billion tons of CO2 to add 1 ppm to the atmosphere, so we actually ‘emitted’ 890,000 / 7,810 = 114 ppm; the airborne fraction, i.e. the emissions that remained in the atmosphere, was 50 / 114 = 44%. Or thereabouts.
Nobody knows what the airborne fraction would have been if we had emitted less CO2, so I will simply keep that 44%. Now, if the decarbonization rate had been 1% faster, we would instead have emitted 732 billion tons of CO2.
Wow! That’s 158 billion tons less! But wait a sec. All these tons add up to just over 20ppm. Even worse: with an airborne fraction of 44%, the actual difference in concentrations by 2015 would have been only 9ppm. Now you see why illustrating this with a chart would be rather pointless – it would show two lines running near-parallel.
Basically, if we had started to ‘mitigate’ warming back in 1979, instead of 405ppm we would have ended the period at 396ppm. And how much cooling is that?
An increase from 396 to 405 is a rise of 2.27%. Now, due to CO2’s logarithmic effect, this is in fact equivalent to 3.6% of a doubling in CO2 concentrations, because 1.0227^31 = 2 and 1 / 31 = 0.0326
We multiply 0.0326 by the airborne fraction of 1.35ºC and we get 0.04ºC.
That’s right. That’s not a typo. If the whole world had decided to ‘do something’ about CO2 way back in 1979, and we had kept that program going for 36 years, and the program had actually been successful (unlike the measures we did implement), then by now temperatures would be 0.04ºC cooler.
All I can say is these policies are, indeed, the height of folly.
DATA: I got global GDP data from the World Bank, CO2 emissions from BP, and CO2 concentration from NOAA. I put it all together in this file.
PS: it would a bit unfair to single out Justin Gillis without giving him the chance to respond. But perhaps he won’t see this article, and I suppose he gets many emails. Just to make sure he doesn’t miss it, you may tweet him @JustinHGillis
https://www.google.at/search?client=ms-android-samsung&q=iraq+saddam+Hussein+siege+of+Saudi+Arabia&spell=1&sa=X&ved=0
I was as opposed to cooling then as I later became to warming. One thing changed in the 1970s, statistics shifted from just studying averages to making simple trend analysis the fad: we still haven’t really got around to variation changes.
The Club of Rome used the simplest and most limited of data in the most archaic of computer models and coupled them with the simple trend analysis to produce “Limits to Growth.” Maurice Strong was the member of the Club of Rome who took all those simple ideas and built them into Agenda 21, the UNFCCC and the IPCC. The major difference with the cooling and warming trends was the use and misuse for a political agenda.
Thatcher started it in order to demonize CO2 to,promote nuclear power and reduce coal use things reducing the threat from her political nemesis, Arthur Scargillpresident for life of the coal miners union. Thatcher was the one who brought Sir John Houghton into the fray. Thatcher later recanted as she watched the exploitation of CO2 for another political agenda that expanded from coal to all fossil fuels.
The only ‘scientists’ directly involved in those early days were almost all bureaucratic scientists as Strong intended. The reality is it wouldn’t have mattered what a scientist said or did as a skeptic to what was being said and done. Once the political juggernaut was under way.science and scientists as skeptics were easily brushed aside. I won’t bother listing all the things that happened to me. Just one will suffice. They even got me fired as a monthly columnist for the farm magazine “Country Guide” after 17 years of explaining weather and climate in practical terms to people who are affected by the weather but also by government policy.
Sadly, the majority of scientists, whether trained in weather and climate or not went for the large amounts of funding and once on that train few ever got off.
People generally can’t, or won’t, go beyond what they are taught.
In the past, those scientist that did “go beyond” are the ones who are revered as being “ground breakers”.
Today the climate “ground breakers” in the US are coming face to face with the reality that “political science” isn’t really science. No more “green” to support it.
A return to science to support efforts to understand more of what little Man knows of our physical reality, rather than “science” being prostituted to support a desired political reality, is not welcomed by those who cash and/or sign the checks.
They are the ones who don’t care what it will cost “the children”.
“An increase from 396 to 405 is a rise of 2.27%. Now, due to CO2’s logarithmic effect, this is in fact equivalent to 3.6% of a doubling in CO2 concentrations, because 1.0227^31 = 2 and 1 / 31 = 0.0326”
Although it is unimportant in the context of your very good argument, the CO2 absorption and warming of the atmosphere DECREASES approximately logarithmically with increasing concentration. The 9 ppm increase/280ppm doubling gives 3.2%. This linear percentage is REDUCED by the logarithmic saturation effect.
Shucks: Here all along I had been thinking increased CO2 efficiency would provide for increased feed grain harvests and lumber sources. Sarc/2
So if natural variables continue to raise the earth’s temperature (as they have done for thousands of years ) that is OK as long as humans don’t have any effect . Is that basically the proposition ?
When natural variables conspire to once again cause global cooling that must be OK to because
no scientists propose that humans are now in charge of setting the earths thermostat or that pumping Co2 is a warming strategy recipe to counter cooling when it comes .
Conserving energy is a good thing on it’s own merit but pretending to micro manage the earths temperature by adjusting a trace gas isn’t even scientific fraud it’s a con job .
It is the rate at which human CO2 is changing the temps and the final extent of the temp rise which is the issue.
Humans make it hotter quicker and to a damaging extent… pace of change may be too rapid for adaption
Ah the rapid “pace of change”. Claimed anthropogenic temperature effects are only noticeable in anomaly terms. Actual temperature changes vastly greater than the anomaly change happen regularly on a daily basis and yet are adopted to easily. The idea that a *tiny* increment in temperature coming into effect over a *long* period of time is somehow too rapid to be adapted to is counterintuitive, to say the least. Where on earth has a climate so stable that a rise of 2-3C spread out over a *century* would represent rapid temperature change?
Even such a physically meaningless target as the global annual anomaly has year-to-year changes much steeper than the “rapid” pace of change attributed to anthropogenic forcing — yet what terrible consequences happen from that *much faster* change? If the slow-but-steady-CO2-forcing causes a pace of change “too rapid for adoption”, where are the bodies from the much larger changes happening over much smaller time?
The amount of carbon emitted per unit of energy has been declining globally at a steady pace since before Abraham Lincoln was elected president.
https://tierneylab.blogs.nytimes.com/2009/04/22/happy-earth-day/
Hubert Lamb, Director of CRU, Sep 8 1972: “We are past the best of the inter-glacial period which happened between 7,000 and 3,000 years ago… we are on a definite downhill course for the next 200 years….The last 20 years of this century will be progressively colder.”http://news.google.com/newspapers?nid=336&dat=19720908&id=AiwcAAAAIBAJ&sjid=0VsEAAAAIBAJ&pg=5244,2536610
John Firor, Excecutive Director of NCAR: “Temperatures have been high and steady, and steady has been more than high. Now it appears we’re going into a period where temperature will be low and variable, and variable will be more important than low.”
The CO2-intensity of GDP (or “CO2 efficiency” per the author) is not a reliable metric for true progress in reducing emissions for the USA (and likely other nations) for at least three reasons.
First, it follows the same trajectory as energy intensity across the arc of development of a nation. It rises as an agricultural economy become industrial, and it falls as a nation moves to become post-industrial, where much of its heavy industry has migrated overseas to developing nations. This is a natural phenomenon of development and globalization, and it really represents exported CO2 emissions rather than eliminated CO2 emissions. The U.S. carbon footprint is much higher if charged for the emissions of goods imported from China and the rest of the world.
The second factor at play that skews CO2 efficiency is the growth of the financial sector. In the USA, thjis sector, which was 3% of GDP in 1950 has grown to over 8% of USA today. Being essentially a giant money-skimming operation that extracts wealth from everything it touches, the money amassed in the financial sector really represents overhead cost to true producers rather than productivity itself. This sector should be excluded from GDP.
A third factor that drives the specious rise in CO2 efficiency is the doctoring of inflation rates (hedonic corrections, geometric weighting/chaining, changing basket of goods) that falsely trim about 4-5% from the official price inflation/GDP deflator number compared to empirical reality and how inflation was historically calculated before the mid 1980s in the USA. These manipulations artificially swell a real U.S. GDP which has been shrinking since 2000 (even including the financial sector) into a more politically-pleasing fantasy GDP with a 1-2% fudged annual growth rate.
If there was a more honest accounting of GDP, I believe the CO2 intensity and underlying energy intensity curves would be much flatter and show far less “progress” in increased efficiency.
Yes!!!! 10 out of 10. Climate science corruption is only one facet of the deception and distraction of the population required for the international Power Elite to maintain and extend control. Economic disinformation is a major leg of that strategy.
I agree but th n there is that very important metric… which is at odds with logic. That is reduce total emmisons to what they were in the past… and they somehow think they can fool us into thinking it is a job creator to do so.
There is no hope of leftists seeing what is logical to us who are able to see clearly as you do.
Here’s another contradiction to this article:
https://cleantechnica.com/2017/03/20/co2-emissions-flat-third-straight-year-still-decoupled-economic-growth-iea/
“CO2 Emissions Flat For Third Straight Year, Still Decoupled From Economic Growth, Says IEA”