A Correction – And Much More of the Answer

Guest essay by Mike Jonas
I think this post is a big deal. It’s not quite the answer to everything but, if I’ve got it right, it solves a lot of the climate riddle. It also shows that CO2’s contribution to late 20th century global warming was very minor. So here’s a request: please can the best brains on WUWT check it all very carefully – a serious online peer-review. If I’ve stuffed up, I want to know that right away, so please get a critical comment in asap. Most of the relevant data is in the spreadsheet absorptioncalcs_upper (.xlsx see also Appendix B).
1. A Correction from Nick Stokes
What seems like a long time ago, when I saw Nick Stokes’ comment on my How Climate Works – Part 1 post, I thought it looked significant and I should check it carefully. Well, silly me, I didn’t check it until after my last post, which asked where El Niño’s heat came from. In that post, I looked into the ocean at 10-100m depth, and found enough extra energy absorption caused by a 1983-2009 cloud cover decline to match the global warming claimed for CO2. There’s enough energy for that alright, but the trouble is, when I examined it further, there’s too much water down there and not enough extra energy.
What I had been doing in the post was to check whether the extra heat going into the deep ocean was enough to match the amount claimed for CO2. All the analysis in the post was correct for the part of the ocean I was looking at, so what had I missed? [Actually, one formula I was using was wrong; I use the hopefully correct one in this post.].
I went back and checked Nick’s comment, and it supplied the answer. It showed the daily cycle of temperature in the upper ocean:

Figure 1. The diurnal (day-night) cycle in the top few metres of the ocean. From Nick Stokes’ blog Moyhu. NB. The two panels have different scales on the x-axes (that’s not an issue at all, just be careful to see the panels correctly).
What this chart shows is that, on a daily basis, the solar energy absorbed into the top fraction of a millimetre of the ocean then mixes (conducts and convects) into the top 5-10m only, and nearly all of it stays in just the top 1m. But overnight, it is all lost, back into the atmosphere.
I was looking far too far down into the ocean. The answers are much nearer the surface. That’s the correction from Nick.
So the first clue that put me back on track was that the daily mixing was in the top 1m, not the top 10m that I had been allowing for. There’s longer-term mixing too, but that basically spreads the heat across a wider band of ocean. The heat retained from the top 1m will still be there, it will just be diluted.
The second clue, which confirmed that I had been basically on track, was that the surface skin is cooler, day and night, than the subskin. What that tells you is that the net heat flow between the skin and the subskin is one-way – upwards from subskin to skin. So no matter how much the skin may affect the rate at which the subskin warms or cools, it cannot ever give it a higher temperature than its own. If the subskin’s temperature is higher, then the subskin’s other heat sources have to be capable of providing.all of its temperature.
I’ll make one more comment on Nick’s arguments, before I move on: It is unreasonable to extrapolate, as Nick implicitly does, from a single day’s data, arguing that the net zero effect over one day applies to longer periods. The net effect over one day may simply be too small to measure, or disappear in “noise”. To see what happens over longer periods, you need to find a way to work with longer periods.
NB. While you’re reading this article, please don’t think that I’m criticising Nick. Nick’s information and ideas have been invaluable. It’s just that I have a different interpretation, and obviously it’s the differences that get most attention.
2. The CO2 argument
Nick’s argument re CO2 is simple: “On average, the surface loses heat, by evaporation and radiation (and some conduction to air). Incoming IR does not generally need to be absorbed. It simply offsets some of the emission. [] In a very technical sense, the sea is heated by sunlight rather than downwelling IR, as is the land. That’s just trivial arithmetic – the sun is the heat source. [] But downwelling IR does add joules to the sea just as effectively as SW “.
Here, Nick confirms that the sun is the heat source, but skates over the mechanism saying it’s “just trivial arithmetic“. We’ll do some of the arithmetic in a while, and see if it’s trivial.
First, I want to establish how effective CO2 is.
The IPCC say that a doubling of CO2 increases downward IR by 3.7 Wm-2, and that without feedbacks this would increase global temperature by about 1.2 deg C [at equilibrium]. I’ll use these numbers, and use average surface temperature 290 deg K, to relate temperature to radiation: for radiation R, temperature T, some k, we have R=k*T^4 so k*291.2^4-k*290^4=3.7 hence k=3.7/( 291.2^4-290^4)=3.14E-8. That’s different to the black body figure, but presumably we’re not dealing with a black body. NB. I’m not looking for extreme accuracy, just the ball-park.
From 1983 to 2009, the increased CO2 delivered a downward RF increase of +0.20 Wm-2 (see previous post Appendix A). That would raise temperature by dT where k*((290+dT)^4-290^4) = 0.2 which gives dT ~= +0.07 deg C. That’s only reached at equilibrium, and as Nick says, ““Equilibrium Climate Sensitivity. What has happened after everything has settled down, which takes a very long time.“. [my bold].
I think that +0.07 deg C at equilibrium is probably about right. And its contribution from 1983 to 2009 would have been much less.
3. The cloud effect
The argument about clouds is even simpler: Clouds affect upward and downward radiation roughly equally, so cloud changes have negligible effect on atmospheric temperature. NB. We’re looking at averages, not day vs night.
I think that’s probably about right, too. As I said in my last post, “Clouds have a minor overall effect on average atmospheric temperature“.
But does that argument extend to the ocean ?
Nick Stokes argues that solar radiation that penetrates the ocean is just re-radiated away. He puts it this way: “A large part of the insolation that penetrates the sea, to a depth of several meters, is later radiated in this way. It’s a big part of the thermal balance. Somehow, that heat is conveyed to the surface, and is emitted by the surface layer.“. And that one word that I have highlighted is the third clue – what is this “Somehow“?.
Let’s look at those “several metres” and see what goes on there:
Using all the same data as in the El Niño’s heat post , here is the absorption profile for the ITO down to 15m depth:

Figure 2. ITO absorption to 15m depth.
Most of the solar radiation is indeed absorbed in the top 1 metre, but for the ITO virtually none is in the top 1mm. The total energy absorbed from thee ITO in the top say 5m is 88 Wm-2. That definitely doesn’t look trivial.
What we are interested in is the effect of clouds. Clouds have little net effect on IR, but for the ITO the equation is different. A reduction in cloud cover lets more ITO into the ocean well below the surface skin. There is now an additional heat source inside the ocean. Using the same figures as before, but correcting the formula (see Appendix A), the 4 percentage-point reduction in global cloud cover from 1983-2009 would see an additional 2.0 Wm-2 absorbed in top 1m, and 1.6 Wm-2 absorbed into the 1-15m band.
That’s a lot more than the +0.2 Wm-2 from CO2 over the same period. Sure, it’s going to get to the surface Somehow, but in the meantime it is going to heat the ocean below the surface. In fact, it can’t (net) release any of its heat to the surface unless it has warmed to a higher temperature. Just like the CO2 change, this extra wattage isn’t a one-day wonder, it’s coming in every day while the cloud cover stays down.
The exact equations from here onwards get difficult, because the situation in the real ocean is fluid – pun intended – ie, the water can move, horizontally or vertically, and heat conducts through it, too, so there’s a lot more going on than just radiation. But the bottom line is that the radiation balance – the “Somehow” – comes from the top few metres of the ocean getting warmer. And if the the top few metres of the ocean get warmer then the globe gets warmer. So …..
4. How much of the Late 20th Century Global Warming was Natural?
We now have the necessary data to start to calculate how much of the late 20th century global warming was natural, and how much was from CO2.
Downward RF from CO2 increased by about 0.2 Wm-2 over the 1983-2009 period. All of that went into the ocean surface skin. Nick’s data shows that it then mixed into the top 5-10m of the ocean, but mainly into the top 1m.
Over the same period, because of cloud cover changes, the ITO increased by 4.5 Wm-2. About 80% of this was absorbed into the top 15m in the following distribution (the rest went into the deeper ocean).
| Depth (m) | Absorbed | Wm-2 | Cumul. |
| 0-1 | 44.7% | 2.0 | 2.0 |
| 1-2 | 9.3% | 0.4 | 2.4 |
| 2-3 | 5.5% | 0.2 | 2.7 |
| 3-4 | 3.8% | 0.2 | 2.8 |
| 4-5 | 2.9% | 0.1 | 3.0 |
| 5-6 | 2.3% | 0.1 | 3.1 |
| 6-7 | 1.9% | 0.1 | 3.2 |
| 7-8 | 1.7% | 0.1 | 3.2 |
| 8-9 | 1.5% | 0.1 | 3.3 |
| 9-10 | 1.3% | 0.1 | 3.4 |
| 10-11 | 1.2% | 0.1 | 3.4 |
| 11-12 | 1.1% | 0.0 | 3.5 |
| 12-13 | 1.0% | 0.0 | 3.5 |
| 13-14 | 0.9% | 0.0 | 3.6 |
| 14-15 | 0.8% | 0.0 | 3.6 |
Figure 3. Where the ITO’s 1983-2009 increase of 4.5 Wm-2 was absorbed.
The greater the depth of the mixing, the greater the contribution from the ITO, as shown in column “Cumul.” in Figure 3.
If we assume mixing to 1m only, the proportion of the extra RF provided by CO2 is 9% (0.2/(0.2+2.0). For mixing to 5m it’s 6.1% (0.2/3.2), for mixing to 10m it’s 5.5%.
Those percentages for CO2 are still too high, because
· CO2 increased linearly, while the ITO increase had all occurred by 2000. The ITO then stayed high.
· The ITO is supplying some additional RF to the next depths too, while CO2 is not.
We can state with confidence that the data shows clearly that CO2 contributed less than 9%, and probably less than 6%, of the global warming that occurred from 1983-2000.
5. Discussion
The global temperature increased from 1983 to about 2000, but then stalled. This matches the pre-2000 / post-2000 pattern of the ITO as controlled by clouds. The relationship is surely worth investigating very thoroughly. The next 5 years of ISCCP cloud data is due out later this year, and that should present a testing opportunity. By contrast, the CO2 pattern was quite different, CO2 levels increased steadily over the period.
We have seen, above, how clouds are a major driver of ocean surface temperature, and hence of climate, though more data over a longer data period is probably needed before the process can be understood in detail. All of the ocean oscillations (ENSO, AMO, PDO, etc) have a big impact on climate over timescales that range from a year to a few decades. Solar variation appears to have a long term effect on climate, and a possible mechanism has been shown to be via GCRs and clouds. It had been thought that clouds had only a minor effect on temperature, but by looking specifically at the ocean not the atmosphere I have shown how clouds do have a significant impact.
The ocean oscillations are not, as far as I am aware, caused by clouds. Clouds can affect the temperature of the water going into the oscillations, and this I think is the likely cause of the 20th century global temperature pattern. This pattern could be seen as a ~60yr cycle on a rising trend. The cycle seemed to match reasonably well to the Atlantic and Pacific oscillations, and the rising trend related quite well to solar activity for most of the 20th century (increased solar activity => less GCRs => less clouds). The sun is not the only driver of clouds, and clouds continued to decline in the late 20th century even though the sun then started weakening. We need to find why the clouds behaved as they did, but it is clear that the late 20th century global warming was driven mainly by clouds. We know that El Niño affects clouds, so it is likely that the other ocean oscillations affect clouds too. Climate is non-linear, which adds another obstacle to analysis – the same factors can have different results at different times, depending on the state of other factors.
I would postulate that the ocean’s chief influence on the weather (periods of days, weeks) is from the top few mm. That is the layer whose heat is lost fastest into the atmosphere. CO2 would have no influence here, because it doesn’t vary on those short timescales, but clouds certainly would. Factors such as winds would be be important too. An El Niño operates on a slightly longer timescale, and winds have been identified as a (or the) major factor. An El Niño can lift local ocean surface temperature by around 10 deg C, and there is a limit to the depth of water that can be heated by that amount. It therefore seems likely that the pool of warm water that feeds El Niño is not very deep. The multi-decadal ocean oscillations, such as the AMO and PDO, change temperatures by less but over longer periods, so their pools of warm water are probably deeper, and consequently are released over a longer period. But if the pool of warm water is deeper, then the proportion attributable to CO2 over the 1983-2009 period would be at the low end of the range. Over even longer timescales, solar variation via clouds would appear to be a (or the) major factor.
Climate scientists would benefit massively, in my considered opinion, by abandoning their absurdly detailed and desperately manipulated computer models driven mainly by CO2 and the atmosphere. I have explained in previous posts why, as currently structured, they can never work. Energy in Earth’s system is basically a one-way street : sun – ocean – atmosphere – space. (Please note that the ocean surface is warmer than the atmosphere, on average, so net energy transfer is indeed from ocean to atmosphere. See here, eg.). Clouds have a major influence, as they control solar energy entering the ocean. The sun, in turn, has a long term impact on clouds. Until we learn how to predict activity of the sun, clouds and the ocean, we will not be able to predict future climate.
I need to re-write some of my earlier documents, in light of what I have learned since. This will take a while. The concepts are generally unchanged, but some of the detail has changed.
Appendices
Appendix A. Cloud Formula
It’s not very clear in the Kiehl and Trenberth energy budget diagram (Figure A.1 in the El Niño’s heat post) what the effect of a change in cloud cover on the various radiation components would be. So I’ve made some assumptions. NB. I’m not looking for extreme accuracy, just the ball-park. The assumptions:
· At 71.2% cloud cover (the 1983-2009 average), solar radiation entering the ocean is 168 Wm-2. (Figure A.1 in the El Niño’s heat post).
· At zero cloud cover, solar radiation entering the ocean would be 72.5% of total solar radiation. (Figure A.2 in the El Niño’s heat post, “70-75% transmitted“).
· Clouds’ effect is linear with cloud cover.
From this, a 1 percentage-point decrease in cloud cover would increase solar radiation entering the ocean by ~1.12 Wm-2. For a 4 percentage-point increase, it’s 4.5 Wm-2.
This formula is a correction to the one I used before. The previous one gave too high a figure.
Appendix B. A very brief guide to AbsorptionCalcs_Upper.xlsx
Download: absorptioncalcs_upper (.xlsx)
Atmosphere and Ocean data is digitised from graphs shown in worksheets AtmosphereGraphs, OceanGraphs respectively. Atmosphere and Ocean calcs are in worksheets Atmosphere, Ocean respectively. Some energy budget data is taken fron Kiehl and Trenberth’s energy budget chart in worksheet EnergyBudget. The full combination is then calculated in worksheet 2003.
I use SORCE data for 2003. All years are almost identical.
In the SORCE data, total solar radiation is 330.5 Wm-2 based on Earth’s surface area – cell ‘2003’!D4 divided by 4. Total ITO is 236.5 Wm-2 – cell ‘2003’!E4 divided by 4. The 88 Wm-2 absorbed in the top 5m comes from cells ‘2003’!BC1:BG1. Cells ‘2003’!BC2:BQ2 give the percentagess in Table 3 above.
In the previous worksheet, absorptioncalcs (.xlsx), there was an error in a section labelled Bands for graph only: at cell ‘2003’!AD8009 (now cell ‘2003’!AZ8009). This section is not used for any calcs. The error is that the z axis in the Absorption graph in worksheet Graphs is out by a factor of 10. The section is not used anywhere else, so no calcs are affected.
Abbreviations
AMO – Atlantic Multidecadal Oscillation
CO2 – Carbon Dioxide
ENSO – El Niño Southern Oscillation
GCR – Galactic Cosmic Ray
IPCC – Intergovernmental Panel on Climate Change
IR – Infra-Red radiation
ISCCP – International Satellite Cloud Climatology Project
ITO – Into The Ocean [Band of Wavelengths approx 200nm to 1000nm]
PDO – Pacific Decadal Oscillation
RF – Radiative Forcing
SORCE – Solar Radiation and Climate Experiment
SST – Sea Surface Temperature
SW – Short Wave
Wm-2 or W/m2 – Watts per square metre
WUWT – wattsupwiththat.com
Is this going for publication?
If it is an explanation of the terms “RF” and “ITO” are in order. Now I get that “RF” may mean radiative forcing. But ITO is a total mystery to me.
abbreviations are at the bottom of the article
I think the first question that has to be answered is how does CO2 and IR between 13 and 18 microns warm the oceans? The oceans are warming due to high energy visible light, not back radiation of IR. Can someone please explain how LWIR warms the oceans? If you can’t explain how CO2 warms the oceans, you can’t explain how CO2 is causing global warming.
Antarctica isn’t warming, but the Oceans are warming
https://co2islife.wordpress.com/2017/01/16/climate-science-on-trial-the-forensic-files-exhibit-g/
No doubt Willis come along with his references to his article of Radiating the Oceans.
One question that needs to be answered is why can’t DWLWIR burn off dew? In mid to high Northern latitudes on a still winter’s day one may see a hollow entirely covered in dew. On the sunny side of the hollow the low winter winter sun can burn off the dew in a n hour, but on the shady side of the hollow, the dew can stick around all day even though an entire day’s worth of DWLWIR is more than 1 hours worth of low solar irradiance. I have seen this many times when I was a kid growing up in the countryside.
That analogy is exactly what I’ve been looking for. Thanks a Million. I make a similar analogy about the frying of an egg on a side walk. Try that is the shade, where you isolate the effect of back radiation, and the egg will do nothing,
I’m with both you guys on this one. No one has ever convinced me that DWLWIR is nothing more than a flawed effect (and tuning knob) in a non-physical model. Even if I’m wrong here then water vapor would be the main driver. The temperature cycles in deserts behave far differently from the tropics for essentially the same CO2 levels. I think it’s been implicitly understood that the direct effects of more CO2 are fairly negligible which is why the narrative if full of tipping points and triggers.
The ‘back radiation’ component from GHG’s and clouds is only about 140 W/m^2 while the peak solar input exceeds 1000 W/m^2 at the equator and even the mid morning Sun exceeds 300 W/m^2 in most places across the planet. And yes, the 140 W/m^2 is offset by net surface emissions, but just because it gets offset doesn’t mean it doesn’t exist. Many are confused because Trenberth claims a much higher value for ‘back radiation’. He arrives at his inflated value by conflating the radiative surface warming from GHG’s and clouds with the return of latent heat, thermals and solar energy absorbed by clouds and subsequently sent to the surface which are otherwise already accounted for by the net surface temperature and its consequential BB radiation. To me, this conflation is nothing but a slight of hand to make the GHG effect seem more important than it really is.
Excellent point. The physical properties of water (H2O) are quite marvelous and it is these physics that drive a spike through the AGW myth.
The daytime figure for SST temperature gradient is staring everyone in the face. Evaporative cooling is so powerful it creates an “S” shaped curve because it draws more energy out than can be pushed back to the surface through the natural rising of heat below the surface.
This “S” shape goes away at night not because evaporation is less powerful, but rather because the input (solar) has gone away and the natural rising takes on a more logarithmic shape by depth where output is the only variable.
Put more simply, the “S” plot is derived from the complex multi-variable (input & output) equation whereas the nighttime plot is reduced to an output variable. Thus, DWLIR (which doesn’t change at night) has no discernible ability to demonstrate input in the night time plot.
Further, the argument is then made that DWLIR “reduces cooling”. This is also unsupportable by the physics of evaporation. The pace of evaporation is a product of temperature, wind speed, and air/water saturation. The CO2 forcing from increased CO2 (pick your watts per meter number) is less than the evaporative power of a 2mph wind.
CO2 forcing has less power than a puff of wind.
While there’s downwelling IR, there’s also upwelling IR from radiational cooling that continues unabated (and actually increases) during the day. The upwelling IR is broadband radiation, so while some of it winds up getting blocked and returned from GHGs, other wavelengths escape fine.
Use a IR thermometer aimed at open sky, and you’ll be impressed at how cool the sky appears. While the value is semi-bogus since the sky doesn’t have a black body spectrum, the thermometer is accounting for what it’s radiating upward itself.
Right now it 41F outside, my Kintrex IRT0421 says the sky is equivalent to -30F.
This seems like an important observation so I will add my observation in support. As a kid growing up on the Northern plains in Western CanadaI I often went hiking in a valley near my home.In mid May the temperatures could easily be in the 80’s but it was not unusual to see snow on the shaded side of hills. More to the point, two months later and after many days in the 80’s and 90’s there was still snow
to be seen under overhangs where it was open to the air but protected from direct sunlight
Our planet is ‘warm’ thanks to our wonderful oceans. Minus that, we would be as cold as Mars.
why can’t DWLWIR burn off dew?
=================
because the object in the shade is still warmer than the atmosphere.
Yup, seen the same effect. In the mountains in southern Europe, in winter we would get a few weeks of freezing nights. I recall one spot on my road where the sun never reached, and this spot alone always had ice on it, despite daytime temperatures in the sun being so mild that no other snow or ice remained.
frost in the shade is another example.
I’m guessing a bit here but dew like snow and ice can be sublimated by incoming radiations as well as evaporation.
Solar Ovens become DWLWIR coolers or fridges at night. how can a “heat source” make an object colder than it’s surroundings.
Ask any warmist why DWLWIR can’t do any “Work” at the surface and they explain for it to do so the working object has to be colder than where the DWLWIR comes from. QED.
co2islife is right.
CO2 does not warm the oceans. The sun does. Any LWIR from CO2 to ocean is massively counterbalanced by IR radiation from oceans going the other way, plus evaporative cooling. The recent El Nino gave the atmosphere a one-time (in a score of years) injection of energy, raising temperature. Nearly all the energy was quickly lost. Irradiated to space. The temperature of surface atmosphere dropped 0.6ºC over 10 months (Feb 2016 to Dec 2016). Because the atmosphere is rubbish at holding in heat. If CO2 is 25% of the current GHG effect, and a doubling from 280 to 560 ppm contributes only 6% more to its effect then the expected climate sensitivity of CO2 = 33ºC × 0.06 × 0.25 = 0.495ºC ~ 0.5ºC.
Extra heat held in the oceans will not increase ocean temperature much. Not by any measurable amount. Because the mass of ocean is 272 × mass of atmosphere. The heat capacity of water is 4 × that of atmosphere. So any injection of heat from the ocean to the atmosphere (like El Nino) is nothing to do with any warming (i.e. warming does not cause the oceans to get too hot), and it is quickly lost to space; so has no long-term effect.
If the oceans are warming, the effect must be due to something else apart from CO2 in the air. Whatever is causing the oceans to warm is most certainly causing the atmosphere to warm.
Bingo, that is my point. To expain the warming, you have to explain how the ocean are warming, and it ain’t due to CO2. Game, set, match. No need to continue to pour trillions of dollars down the rat hole. Thanks for the comment.
CO2 and back radiation do not transfer heat to the ocean at all (by definition of heat transfer). They do transfer energy to the thin layer at the surface. The net effect of this added energy is a reduced net amount of radiation up (Thot^4-Tcold^4 effect), resulting in more of the absorbed solar energy being held in the water, so the surface and lower levels are warmer than otherwise. This is partially compensated by more evaporation and conduction/convection from the surface to remove the added energy, so that net energy balance is maintained over long times, but at an increased average surface and near surface temperature. The issue is not CO2 being or not being a greenhouse gas that raises the surface temperature, it is the net effect in the atmosphere, including change in water vapor concentration, cloud effects, etc., being positive or negative feedbacks, resulting in a different balance. The data appears to support some net negative feedback, so CO2 effects alone, which are small by themself, are made even smaller. While your analysis has some interesting information, it is irrelevant for the global warming issue.
Sorry, this is really a debate, ‘which came first, the chicken or the egg’. We base our CO2 ‘safe levels’ on conditions that was the Little Ice Age until today’s somewhat warming (compared to the Minoan super warm age).
We suspect CO2 is always low during cold cycles. It doesn’t cause it, it is a reflection of conditions. I am assuming that during Ice Ages, CO2 was very low due to the oxygen being locked in ice which is H2O, that is, one oxygen molecule and two hydrogen.
Back radiation cannot add energy to the ocean. That would violate the laws of thermodynamics: heat cannot pass from a cold body (the atmosphere) to a warmer body (the ocean).
Thanks Phillip, but I don’t think it is what easy. This is a “energy being changed in form” problem. EM radiation travels through the vacuum of space and never alters its temperature. It reaches earth and is converted from EM energy to thermal energy, so in that case, energy did go from a cold vacuum to a warm earth. Chemical energy can go from a cold match head to a hot flame. Energy can go from a cold falling meteor to a flaming shooting star. In this case, a cold CO2 molecule is activated by IR radiation, and that energy is “thermalized.” My understanding is that it is the conversion of energy in form that is the issue. Any insight would be appreciated.
Prevent (or slow) its loss would be a more accurate way of putting it. Heat can and does flow from cold bodies to warm bodies. NET heat cannot flow from cold to warm.
CO2islife. You are confused about heat and energy. EM from the sun consists of photons, which are packets of E = hv, the frequency v being dependent on the temperature of the sun. The photons do not have a temperature. That energy is thermalised when it is absorbed by an atom or molecule on the earth and raises its temperature. So there is a transfer of heat from the hot sun to the cold earth. The release of chemical energy by a burning match head produces a hot flame, which can then transfer heat to its cold surroundings. There is no heat transfer from a cold match head to a hot flame – the release of chemical energy by burning manifests itself as a hot gas (the flame). A cold meteor has a lot of kinetic energy. This kinetic energy is converted to thermal energy by friction with the atmosphere raising the temperature of the air molecules. The hot air molecules then radiate energetic photons in any direction, some of which transfer heat to earth. In the case of a CO2 molecule in the air, a photon in the form of IR from the warmer earth can be absorbed by the molecule and raise its temperature (its kinetic energy), ie heat has been transferred from earth to CO2. That molecule can in turn radiate IR, but cannot transfer heat to a warmer earth. It has to remembered that all molecules are trying to attain the lowest possible energy state by radiating away EM. If they are surrounded by other molecules at the same temperature, all they will achieve is the swapping of photons, no heat transfer and continued thermal equilibrium.
What about this?
Simple Experimental Demonstration that Cool Objects Can Make Warm Objects Warmer Still
August 26th, 2016 by Roy W. Spencer, Ph. D.
http://www.drroyspencer.com/2016/08/simple-experimental-demonstration-that-cool-objects-can-make-warm-objects-warmer-still/
Bindidon,
I’m concerned that Roy’s experiment is a little too simple. It presumably takes into account emissivity and reflectivity (which, strictly speaking, will vary with wavelength) for the ‘transmitter’ and ‘receiver’, but doesn’t address the reflectivity and conductivity of the intervening solid material (not a gas that is transparent at the ‘transmitters’ wavelength’ and an absorber at the wavelength of the re-emitted energy).
I think that one can better understand this as just throwing another blanket on the bed in a very cold bedroom and satisfyingly observing that one is no longer as cold as they were previously. Obviously, any insulator, between two objects at different temperatures will decrease the rate of energy exchange and slow down the temperature decline of the warmer object. Nothing surprising here!
I don’t see how LWIR from CO2 can heat the sea at all. Here’s why:
CO2 in the Earth’s atmosphere only absorbs IRR at around 15um. Wavelength is directly proportional to temperature and 15um occurs at -80C. CO2 can only emit IRR at the same 15um so radiates very low energy photons at -80C.
Now some simple quantum physics. Electrons orbiting a molecule can only do so at specific orbital heights. The higher the orbit, the higher the energy and the “warmer” (temperature is a measure of the kinetic energy of a substance) the molecule. When a photon hits a molecule, if it has too much energy, enough is absorbed to boost an electron to the next higher orbit and the rest is immediately radiated away.
If there isn’t enough energy to boost an electron to the next available slot in a higher orbit, the photon’s energy is immediately re-radiated leaving the molecule with the same kinetic energy (temperature) as before.
Radiation from a molecule at -80C therefore cannot provide enough energy in the form of photons, to warm molecules (by boosting electrons into higher, more energetic orbits) at -4C or above (seawater temperatures).
This is my understanding of what happens and is why I don’t see how CO2 can warm the oceans (or land).
Yep, not only that, the -80 degree C is the black body temp. CO2 isn’t a black body. It is emitting only a fraction of the energy of a blackbody of temperature -80 degree C.
Rod February 18, 2017 at 1:20 pm
I don’t see how LWIR from CO2 can heat the sea at all. Here’s why:
CO2 in the Earth’s atmosphere only absorbs IRR at around 15um. Wavelength is directly proportional to temperature and 15um occurs at -80C. CO2 can only emit IRR at the same 15um so radiates very low energy photons at -80C.
Sorry but this is nonsense. Emission is not ‘proportional to temperature’.
Spectral radiance at -80ºC (220K) is ~2.0 W/m2/sr/µm
Spectral radiance at +27ºC (300K) is ~6.7 W/m2/sr/µm
So increase the BB temperature by 36% and you more than triple the emission of 15µm radiation.
Now some simple quantum physics. Electrons orbiting a molecule can only do so at specific orbital heights. The higher the orbit, the higher the energy and the “warmer” (temperature is a measure of the kinetic energy of a substance) the molecule. When a photon hits a molecule, if it has too much energy, enough is absorbed to boost an electron to the next higher orbit and the rest is immediately radiated away.
A completely wrong understanding of the QM related to vibrational spectra; electronic spectra are in the UV, the IR involved in CO2 absorption/emission is due to vibrational/rotational motion of the atoms not the electrons. The discrete energy levels can only absorb the exact wavelength corresponding to their energy separation, they don’t absorb a photon which has too much energy and then discard the excess!
Solar variation appears to have a long term effect on climate, and a possible mechanism has been shown to be via GCRs and clouds.
Words are important, and shown should more accurately be replaced by speculated.
Similarly ‘appears‘ is just asserted without justification. The facts are that it has been very difficult to determine what the effect is over and above the expected 0.07C variation due to the cyclic variation of solar radiation. It looks to me that your assertions here are analogous to ‘and then a miracle happens’.
I love when I read posts like this!! THIS is peer reviewed science should work ……
oops, insert “how” between is and peer ….
The mind fills things in, I read it as “THIS is how peer…”, so when reading your correction I had to go back and see that the word “how” wasn’t there.
Yep .
Instantaneous and not just by pals .
The difference between Mike and our alarmist friends is that he isn’t simultaneously reaching for your pocket while he speculates and his speculation is conservative rather than apocalyptic.
well said – very true!
Mere assertions without justification? That appears to be a bit dismissive considering the theory is based on more than speculation.
As opposed to computer models (all of which have positive feedback variable)
The data do the dismissing as they do not support the speculation. So, it has not been shown that the theory works. It is speculation that the effect should be large.
http://www.leif.org/research/clouds.png
“The data do the dismissing as they do not support the speculation. So, it has not been shown that the theory works. It is speculation that the effect should be large.”
Ah, just like CAGW then, since the data consistently show that the speculation (models) are way off the mark, all running much hotter.
My university mentor tore a paper a wrote from a lab experiment. I wrote “it can be seen”.
Yes, words matter and are often inappropriately selected to promote a point of view. A recent NYTimes article claimed that intelligence agencies “determined that President Vladimir V. Putin’s government tried to interfere with the 2016 election on Mr. Trump’s behalf” when in fact the correct word is “assessed” and the motive was far more likely to be “to Hillary Clinton’s detriment.”
lsvalgaard on February 18, 2017 at 5:16 am
Thanks for the comment Leif… Each time I read things like “The sun drives the climate” or even “El Niño drives the climate” I have a quick look at this simple graph comparing surface temperatures, ENSO signal and Sun Spot Number:
http://fs5.directupload.net/images/170219/947ms94b.jpg
and ask me how these two lame ducks managed to push up surface temperatures.
No idea about the role played by GHGs! But I’m sure neither ENSO nor the sun will be the two major guys here.
Okay then what did prior to 1950?………….
Robert W Turner on February 18, 2017 at 6:04 pm
Okay then what did prior to 1950?
That’s on the chart. Maybe you meant prior 1880?
Well I have an issue with using global average as if the sun was shining 24/7. I am sure heat losses Do change day vs night. The whole 33C warmer than otherwise is the false starting point. Secondly, surface temperature is an artifact of stratospheric pressure. Follow tge drivers of pressure and the answer will be presented. Sorry I cant be more specific.
I have a gas cylinder at 200 bar pressure. The temperature of the gas in the cylinder is the same as the surrounding atmosphere a 1 bar pressure. Can you explain how temperature is an artifact of pressure in the light of this?
Google ‘adiabatic’
Leo, I know about adiabatic. It means a system is isolated and no energy leaves or enters the system.
From the first law of thermodynamics, Delta U = Q +W (change in internal energy = heat plus work).
In my cylinder, we imagine work being done to pressurize the gas to 200 bar, say from a piston. Since this adds energy, the temperature will rise.
In reality, my cylinder is not adiabatic. It exchanges energy with the surroundings. Heat is transferred from the hot gas to the cylinder walls and thence to the surroundings, which is why he temperature of the pressurised gas is the same as the surroundings.
So we need to have an adiabatic system for the temperature to be a function of pressure. Since the Earth is not adiabatic temperature will not be a function of pressure, just like in my cylinder. Adiabatic does not help you. If we pressurised the atmosphere the temperature would rise, then simply fall again as the energy were radiated away.
Incidentally, the adiabatic compression is isentropic – there is no entropy change. That means the process is reversible. We get back ALL the energy by expanding the gas again. Common sense tells us that this will never happen in practice, which is because no practical system is adiabatic.
It is the gravitational energy which maintains the pressure & temperature gradient . It cannot blithely be left out of the energy balance equations .
Are you saying that gravity is constantly adding energy to the atmosphere? That is an unusual claim. The first law of thermodynamics I quoted earlier insists that in an adiabatic system total energy equals heat energy plus work energy. From this we see that gas heats when pressurised. However, in a non-adiabatic system that temperature will fall again. The only way for the temperature to remain at the high level is for energy to be added. You are suggesting that gravity is adding this energy?
Are you saying that gravity is constantly adding energy to the atmosphere?
==============================
Gravity is removing energy, because kinetic energy (temperature) varies as linearly with height while radiation varies as the 4th power of temperature.
For example, say convection moves two parcels of air of equal mass, one up the other down. The distance will be the same, with opposite sign. This increases the temperature of one by 2C and decreases the temperature of the other by 2C due to the conversion between PE and KE. (PE = KE = m x g x H).
There is no net change in gravitational (kinetic) energy, because + (2) – (2) = 0. But say the average temperature of the air was 300C, the radiation change varies as:
+ (302^4) – (298^4) > 0.
Thus, during convection, gravity is slightly decreasing the energy of the atmosphere, by changing the radiation balance in favor of more heat loss from the descending air than rising air.
The car is in the parking lot.
The weight of the car is borne by the wheels. The deformation of the wheels causes an increase in the tire pressure.
The increased tire pressure causes a hardly measurable heating of the wheels, which is immediately removed again to the environment.
The removing of that slight warming hinders more deformation of the tires – eqilibrity.
For a massive body such as planet earth, the ‘hardly measurable heating’ is 33 ° C.
For the massive body planet earth:
surplus heat is transported to the environment – the interplanetary space.
So a further deformation of the self bearing column of atmosphere is stopped – equilibrium.
seaice you said , “I have a gas cylinder at 200 bar pressure. The temperature of the gas in the cylinder is the same as the surrounding atmosphere a 1 bar pressure.”
Would you have to take into account the amount of energy it took to fill the tank and pressurize it to 200 psi? After the tank sits isolated it will cool down to the outside temp. I have filled a few tanks and always had to very careful handling the valves they could be quite hot.
seaice1,
It is all about density. The atmosphere is denser near the surface (due to gravity) and therefore can contain more heat (kinetic energy). This means that it takes longer for it to lose that heat (cool) than the less dense atmosphere at higher altitudes. In your example of the gas cylinder, try this experiment: first fill the cylinder to 1 bar, then heat the gas using a constant heat source up to a specific temperature. Then let it cool to ambient again. Try the same thing with the pressure at 200 bar. This time it will take longer to reach the same temperature, and longer to cool back down. Higher density = more mass.
Global surface temperature calculations already multiply incoming solar energy by a factor of 1/4, the ratio of the area of the earth’s disk to its surface area. This effectively spreads the incoming solar energy evenly over the whole surface, both the day and the night side:
v’
“as if the sun was shining 24/7”
I thought it did. Back to school!
I have posted your fig 1 temperature profile plots a number of times on this site when arguing, particularly with Willis, the role of DWLWIR and the oceans.
One needs to bear in mind a number of factors.
Firsts, DWLWIR is omnidirectional. Thus DWLWIR is not perpendicular to the surface of the oceans. Much of DWLWIR will be impacting the ocean at low grazing angles, eg. less than 10deg, less than 20 deg, less than 30 deg etc. This impacts upon its vertical penetration into the depths of the ocean.
Second, the (optical) absorption characteristics of LWIR in water is that almost all LWIR is absorbed in just 10 microns, and given the omni-directional nature of DWLWIR, about 50% of DWLWIR is fully absorbed in just 3 or 4 microns.
Third, how much energy is thus being absorbed in 3 or 4 microns? K(T suggests the average figure for DWLWIR is 324 w/m2. If 50% of this is absorbed in just 4 microns, then some 130 w/m2 is being absorbed in that very thin layer. We do not have to consider solar irradiance since all but none of this is absorbed in the top microns (which is fortunate for us since if it were to be absorbed in the top microns, the oceans would have boiled off from the top down long ago). The point is however that 130w/m2 is a lot.
Fourth, what is done with the energy absorbed as above? How is it dissipated and diluted before it simply drives extreme amounts of evaporation from the top micron(s) layer? Can it be sequestered to depth, and if so at what speed so that it is diluted by volume before it boils off the top microns of the oceans?
It cannot be dissipated and diluted to depth by conduction since the energy flow is upwards, as Fig1 confirms. So unless we are wrong on our understanding of energy flow, conduction does not assist.
Some suggest that it is the action of ocean overturning, the action of the wind, waves and swell. However these are relatively slow mechanical processes. Ocean overturning is a diurnal event, and since the average wind speed over the oceans is little more than BF4, there must be vast swathes of the oceans where the conditions for long periods are BF2 or less when there would be very little ocean/top surface mixing by wind waves or swell. I have asked Willis to explain what happens in Caldera lakes where, due to topography, for the most part there is little action by way of wind, waves and swell. Why are Caldera Lakes not boiled off by the DWLWIR being absorbed by them in the top few microns?
There is an obvious problem with DWLWIR absorption IF this is more than a signal and is something capable of performing sensible work. On one of my exchanges with Nick, he calculated that the amount of energy absorbed in the top few microns was so much energy that it could theoretically evaporate enough water to lead to about 16m of annual rainfall! Obviously, we do not have 16m of annual rainfall so what has happened to this energy? How has it been sequestered to depth so that it has been diluted and dissipated by the sheer volume of the ocean itself. I have yet to see a sensible explanation for the processes involved. Our understanding of this is incomplete.
Whoops, 50% of 324 should be ~160w/m2
Yes, “John Harmsworth on February 18, 2017 at 11:53 am
No this is indicated as a continuous input amount.”
_____________________________________
To substract from this amount are:
1. The amount of moisture extracted from foodstuffs harvested annually from the fields which is not transported back into the atmosphere but directly into the canalisation.
2. The amount of humidity consumed by cattle that directly goes back into the water cycle down into the ground water. And finally
3. The amount of moisture that is carried away from the forests in timber and utility wood.
This virtual 16m rainfall may be just the global distribution of humidity in the atmosphere.
No this is indicated as a continuous input amount. The same amount would have to fall or the atmosphere would saturate and it would fall anyway. It means that this level of evaporation is not possible.
You forget that the sea-surface is at 270-300 K and radiating LWIR upwards. The net LWIR absorption is minimal or negative. The DWLWIR increases evaporation and decreases the net (upwards) LWIR, but does not really heat the surface.
Isn’t the obvious answer that the DWLWIR isn’t really there? If CO2 molecules in the atmosphere lose energy by collision with other atmospheric molecules then isn’t the energy thermalized so that no photon is emitted?
“Firsts, DWLWIR is omnidirectional. Thus DWLWIR is not perpendicular to the surface of the oceans. Much of DWLWIR will be impacting the ocean at low grazing angles, eg. less than 10deg, less than 20 deg, less than 30 deg etc. This impacts upon its vertical penetration into the depths of the ocean.” .
.
In physics, the mean free path is the average distance travelled by a moving particle (such as an atom, a molecule, a photon) between successive impacts (collisions),[1] which modify its direction or energy or other particle properties.
mfp =66nm at 0 altitude so escaping heat reflected from surface or moving >66nm will again get transferred on average in all directions. this occurs at every sufficiently long path length. On average 50% up 50% down
Richard I have spent some time measuring the surface (skin) temperature of the ocean with an IR gun, the temperature just below the surface and the air temperature just above the surface.
The skin temperature is always lower than (mostly) or equal (occasionally) to the temperature just below the surface and it is never warmer than the water below the surface.
The air temperature close to the surface is always close to the skin temperature, depending on wind speed.
My conclusion is that the net LWIR radiation between the ocean skin temperature and the atmosphere is zero since the skin and the air temps are apx. the same and exchange LWIR. The reason the skin temperature is lower than the subsurface temperature is due to Evaporation.
The temperature of the water below the surface can be considerably warmer than the surface due to SW radiation penetrating during the day and it tends to stratify.
Except for shallow water in calm conditions, it is very hard to find temperatures higher than 30˚C.
CO2 is largely transparent to solar insolation so it is effectively always in the shade.
Nearly half of the sun’s energy is in the near infrared which penetrates water to a depth of between one and one hundred centimetres and together with the rest of the solar spectrum warms the ocean very efficiently down to 100 metres. This energy is stored as heat to be moved around the globe by winds and ocean currents, also very efficiently. Evaporation together with its latent heat is the hidden means by which heat is moved from warmer places to cooler places very far from the source. Radiation in the far infrared from the air above cannot penetrate much beyond the surface skin of the ocean is therefore largely irrelevant.
” also very efficiently” Is this an expression of conservation of energy? It is of course efficient in ha no energy is “lost”, but I am not sure if that is what you meant.
“effectively” is perhaps the better word.
Mike, you came up with an estimate of CO2 contribution to global warming of about 9% in this piece. In your earlier series on the Mathematics of CO2, you came up with 10%, and Willy Soon’s estimate based on changes in solar radiation intensity was 12% (I may have the last 2 figures the wrong way around). Coming at the estimate from 3 different directions gives an average of about 10%. Is that just a coincidence, or are we on to something here?
Needs more study to determine if it’s a coincidence or “we’re on to something”. My guess is that was your point.
This is the problem the climate alarmists face, and what all of climate science should be focused on.
What is the energy of a photon of blue light (λ = 450 nm) and of a photon of red light (λ = 700 nm) in units of eV = 1.6*10-19 J?
Solution:
E = hc/λ.
Blue light: E = (6.626*10-34 Js)(3*108 m/s)/(450*10-9 m) = 4.4*10-19 J = 2.76 eV
Red light: E = (6.626*10-34 Js)(3*108 m/s)/(700*10-9 m) = 2.8*10-19 J = 1.8 eV
Photons have no mass, but they have energy E = hf = hc/λ. Here h = 6.626*10-34 Js is a universal constant called Planck’s constant
CO2 traps IR between 1,300 and 1,800. Do the math. The numbers simply don’t add up.
The specific heat of water is 1 calorie/gram °C = 4.186 joule/gram °C which is higher than any other common substance
It takes a whole lot of incoming radiation to keep the oceans warm. Energy is inversely related to wavelength. Back radiation of IR is already absorbed by H2O above the oceans, CO2 has no impact. The other issue is that IR is very very very low energy radiation, nowhere near what you get out of blue light.
I do not understand what numbers you think do not add up. Each photon of IR has lower energy than a photon of blue light. This is understood by all. The energy flux is given in W/m2, not photons/m2. This presumably means that equivalent energy in IR has more photons than in blue light.
This may not have been your point, but can you explain what doesn’t add up?
Look at the absorption/transmission spectra of H2O. IR between 13 and 18 microns is completely absorbed in what is called the microlayer of the surface. It doesn’t penetrate H2O, so it can’t warm the deeper oceans. In fact, it is believed to actually cool the ocean through evaporation. Second, warming H2O takes vast sums of continually incoming radiation in the blue end of the spectrum. Trapping outgoing IR is only a fraction of the heat that would be required to warm the oceans. As the recent post-El Nino collapse in temperatures proves, CO2 and the atmosphere don’t do a good job at holding in temperatures/heat. In fact, they are far better at transporting heat way from the earth, than keeping in in.
Climate “Science” on Trial; Evidence Shows CO2 COOLS the Atmosphere
https://co2islife.wordpress.com/2017/01/29/climate-science-on-trial-evidence-shows-co2-cools-the-atmosphere/
Nick’s and Mike’s articles both say that short wave radiation does most of the the heating. I don’t really see your point.
I have made this point before to Willis. When weather conditions are really rough say BF8 and above, and somewhere over the globe there are always large storms of that magnitude, one gets a divorced layer of the oceans. In really rough conditions the very top of the ocean is a divorced layer of windswept spray and spume and this divorced layer (of very fine water droplets) fully absorbs the DWLWIR and stops it entering the oceans. It acts like a parasol. A parasol blocks sunlight, this fine layer of water droplets blocks LWIR.
In this scenario some of this divorced layer eventually reconnects with the oceans, but much of it does not. The DWLWIR simply energizes it and powers evaporation taking water vapour upwards and into the atmosphere such that much DWLWIR never reaches the oceans, but instead it is (remains) in the atmosphere above the oceans.
I have suggested that that is material to the gross energy budget which Willis uses in support of the contentions set out in his article Radiating the Oceans. If just 1% or even just half a percent of DWLWIR never reaches the oceans because it is blocked by very fine water droplets of spray and spume and is carried upwards into the atmosphere (rather than reconnecting with the oceans), then long term (over millions of years) the gross energy budget falls out of balance.
You might also like to consider the point I raised in my comment above at 5:37am.
Yep, here is a article that shows how CO2 actually works best to pull heat away from earth instead of trapping it in. Conduction and convention are very slow, radiation is very fast.
Climate “Science” on Trial; Evidence Shows CO2 COOLS the Atmosphere
https://co2islife.wordpress.com/2017/01/29/climate-science-on-trial-evidence-shows-co2-cools-the-atmosphere/
So how does el Nino form? Heat accumulates in surface water in the Western Pacific because? A)-Cloud cover is reduced B)-Winds are reduced C)-Higher temperature water upwells D)-Upwelling is reduced or stopped E) Surface winds are reduced while winds aloft are strong enough to carry away humidity and prevent clouds and precipitation
The occurences of el Nino seem to affect the global temperature even more than adjusting data or pretending tree rings are ancient thermometers .Unsurprisingly, no one in the pretend science of climatology main stream seems interested in determining how these massive heat events get underway .
There could even be a geothermal El Nino explanation?
Fairly fundamental to try and discover the real mechanism(s) as pointed out above by John.
I might help to complete he “somehow” part/
“Somehow, that heat is conveyed to the surface, and is emitted by the surface layer.
That pathway is a mix of turbulent advection, conduction in the top few mm, and radiation in the top microns. All those mechanisms are bi-directional. If heat can be emitted, it can be absorbed.”
My nutshell thinking: The driver is a long term absorption/evaporation seasaw due to ocean heat capacity. When there is room for heat in the top ocean layers, fewer clouds form because there is less ocean surface evaporation that ordinarily leads to cloud formation (with less ocean evaporation the atmosphere over land is colder). When the top ocean layers reach heat capacity, evaporation kicks in leading to cloudier conditions (which also warms the air over land). This process takes 10s of thousands of years due to such a large body of water. Teleconnected atmospheric/oceanic/orbital systems causes rapid heat rise over land but jagged falls back to cold conditions, thus explaining the past 800,000 years of stadial/interstadial swings.
Think of it as a round toy made up mostly of the rechargeable storage battery. When the battery is fully charged all the interesting things begin to happen. When it goes into recharge mode it doesn’t do much but sit there. As long as there is still energy left in the thing we can get out and play and enjoy the warmth supplied by the toy. Othwise we have to hunker down and try to keep warm by other means while the battery is in recharge mode.
Pamela: “When there is room for heat in the top ocean layers”
WR: A very interesting way of looking at things. “When there is room for heat”. It indicates that certain ‘states of the climate’ (like an interglacial) have a bandwith within which complex dynamic interacting processes play their game. It must be something like this. With different players acting at different times. Influencing each other in an always changing pattern.
Yes. Which is why in my opinion, the pattern of ups and downs isn’t evenly spaced across 800,000 years that we have paleodata for. The overall pattern however clearly demonstrates heat kept in and then heat coughed out, a cycle seen on shorter ENSO oscillations and even daily time spans.
One of my inclinations related to natural science is to think that what causes small changes needs to be ruled out as a cause of larger changes before something more exotic is proposed. In other words, more often than not, there is nothing new under the Sun. And Earth is swimming with this observation.
This planet is a water world.
The vast amount of energy entrained within the system is to be found in the oceans, not the atmosphere and yet we presently have the tail wagging the dog.
Understanding the oceans, how they gain/lose energy and how they circulate energy in 3 directions (polewards and to depth), and how the oceans, coupled with the spinning nature of the planet, power the atmosphere is the key to understanding how our climate works.
In my opinion, the most likely explanation for short term variations in temperature is due to changes in patterns of cloudiness coupled with changes in particulates in the atmosphere both of which alter the amount of sunlight getting through to and being absorbed by the oceans.
Whilst I am not against solar variation playing a role, I agree with Leif that the evidence is far from convincing and there is much speculation. That said, it may be that we simply do not understand processes well enough.
.
Yes.
richard verney February 18, 2017 at 6:52 am
“Oceans are only heated by sunlight”
WR: The Glacial / Interglacial pattern seems to be connected to the total insolation at 65N/75N and the duration of the summer season on the NH. At 65N/75N there is not too much ocean water. As ‘land’ is loosing it’s energy more quickly than the ocean, a dive back into a glacial is being prepared in the same time temperatures are high on the NH ….. Oceans on the NH don’t ‘catch’ enough heat and the oceans on the SH don’t get that much insolation to catch heat either. In this way a general gradual cooling (!) of the ocean (!) system could be linked to high insolation at 65N when snow is disappearing and land warms fast.
At some moment the balance will ‘switch to a cooling pattern’ because of the cooling ocean and the loss of insolation at 65/75N which in the end together will result in more snow and ice.
Furthermore, as soon as ‘land’ is cooling down and seas are still relatively warm, the temperature gradient between those two rises. This must enhance ‘wind’. And as soon as this happens at ‘locations of potential [strong] upwelling’, a cooling pattern can start. First at the oceans and later for the Earth as a whole.
Pamela said before: ‘small time segments of climate should first be ruled out as the mechanism driving longer segments of the climate’. https://wattsupwiththat.com/2017/01/28/this-is-how-climate-works-part-1/#comment-2411499
WR: Indeed, we must look at small changes that cause big effects. It is my guess that something ‘small’ (enhanced wind) is causing a big effect by stimulating upwelling: cooling the surface of the ocean. While the reverse – no wind – causing less upwelling and so ‘warming’, is the other possibility. Small changes with big effects.
Do not make the mistake of disregarding fluid dynamics. Heat absorbed in one area moves to another quite readily. Also ocean discharge/recharge is a huge thing, not a small thing.
Pamela: “Do not make the mistake of disregarding fluid dynamics. Heat absorbed in one area moves to another quite readily. Also ocean discharge/recharge is a huge thing, not a small thing.”
WR: Fluid dynamics are impressing. I like to look at the images of http://cci-reanalyzer.org/wx/fcst/#GFS-025deg.WORLD-CED.T2_anom , using the image slider.
But, for understanding ‘climate’ the longer time scale is more appropriate. Understanding the way ENSO acts is important, but what can we learn from the longer (10.000 year) trend as seen in http://i.imgur.com/iTjpFQf.png ?
That sounds plain wrong, and it doesn’t cover the case where clouds shield the ground from radiation but carry heat away and upwards in convective terms to radiate heat away beyond much of the atmosphere.
Nor does it cater for the effect that temperature – diurnal temperature – can have on clouds.
I think you are guilty of gross oversimplification here, which is a shame – the rest looks good
I agree that that the quoted statement appears erroneous.
Oceans are only heated by sunlight (or predominantly by sunlight) and thus clouds during the day are the paramount factor. Cloudiness at night cannot and does not impact upon temperature at depth.
Indeed, simplistic hand waving dismissal of something as being “negligible” is usually a good way to get to one’s preconceived conclusion. I think I made similar criticism of the last post.
This is the kind of mentality which has led climatology astray for so long. The effectsof clouds ( plural because there are many types and heights of cloud each having various effects sometime opposing each other ) can not be put to one side that lightly.
Uncertainties in the effects of cloud are the joker in the pack Equally erroneous and unfounded assumptions fed into climate models are a major cause of the current problem.
How much ocean heating is related to the earth’s core?
“Indeed, simplistic hand waving dismissal of something as being “negligible” is usually a good way to get to one’s preconceived conclusion.”
Excellent point, ref IPCC AR5. The IPCC assume that all changes in climate forcing since 1750 are man-made! This is stated in Figure TS.6 of the report from WG1 of AR5. The climate models and the role of CO2 are based on this assumption, ie that there has been no natural climate change since before the end of the last Little Ice Age.
This assumption is so obviously incorrect that all their conclusions should be disregarded.
Oldman on February 18, 2017 at 7:52 am
How much ocean heating is related to the earth’s core?
The average geothermal heat flow through the earth’s crust is roughly 0.1 W/m²; the average annual solar radiation arriving at the top of the Earth’s atmosphere is roughly 1365 W/m². About 25% of this reach the surface in average.
IOW: less than 0.1%.
The parameter that tells the story is the dew point temperature, rather than air temperature. The skin surface temperature will always approach the dew point. This is true for the surface of the ocean, as well as ice crystals in the tops of thunder clouds. Much more energy is transferred via the processes of evaporation/condensation and freeze/sublimation at relative constant air temperature than can be accounted for by changes in air temperature. I remember as a kid, taking an early morning swim in a lake after a calm clear night and feeling how much colder was the water on the surface.
I remember learning how to float in Wallowa Lake. You couldn’t get in it till the afternoon and then if you let your butt hang you would immediately feel the cold water below the top 6″ or so. Learning how to float on your back was thus accomplished in about 10 seconds.
I could never float – my feet sink like rocks, lol.
What I find is that there is indeed a correlation between atmos CO2 and surface temperature although this correlation could be interpreted in terms of causality in either or both directions.
https://papers.ssrn.com/sol3/papers2.cfm?abstract_id=2861463
but the real agenda in climate science is not to prove that atmos CO2 radiative forcing can overwhelm nature but to reduce or eliminate fossil fuel emissions and thereby migrate to renewable fuels. this agenda requires that a Lacis Control Knob type relationship must exist between emissions and warming. the required relationships for this argument are a correlation between emissions and changes in atmospheric CO2 and a correlation between emissions and surface temperature.
neither of these correlations can be found in the data.
https://papers.ssrn.com/sol3/papers2.cfm?abstract_id=2862438
https://papers.ssrn.com/sol3/papers2.cfm?abstract_id=2845972
the problem lies in the IPCC carbon budget. i find that it is flawed and that the truth is we can’t measure natural flows well enough to actually make a carbon budget. we con’t know where the emissions go. maybe they go very quickly to the biota and do not just accumulate in the atmosphere.
https://papers.ssrn.com/sol3/papers2.cfm?abstract_id=2873672
also no evidence that they accumulate in the ocean (a process that would violate Henry’s Law if the oceans are warming)
https://papers.ssrn.com/sol3/papers2.cfm?abstract_id=2669930
your comments appreciated. my email address appears at the bottom of page 1 of every paper.
CO2 recycling in teh system the atmosphere-the ocean-the biosphere together with anthropogenic emissions can be simulated with the semi-empirical model, which gives results in line with observations both in the ocean and in the atmosphere. Link:
http://www.journalrepository.org/media/journals/PSIJ_33/2016/Aug/Ollila1132016PSIJ27004.pdf
A shorter blog presentation: http://www.climatexam.com/single-post/2016/08/29/The-residence-times-of-carbon-dioxide-are-16-and-55-years
The problem is even simpler, the IPCC assume that there have been no changes in natural climate forcing since 1750, the end of the last Little Ice Age.
Mike Jonas.
A text on Heat Transfer will show that the “somehow” is called convection.Research has determined heat transfer coefficients for convection to a water surface—for example, at a wind speed of 3m/s a value of about 400W/m^2 K has been measured.This is relatively large and results in the skin temperature being close to the subsurface value.BUT, this aside, until you perform a proper quantitative surface energy balance, you will struggle to explain the phenomena of interest to you.
If it’s wind driven it is not called convection.
It is called “forced convection”.
Of course it’s called convection.
Anthony Mills – I think you have missed the main point. Heat cannot be convected unless it exists.
If there is ice on water, can far IR penetrate that ice to heat the water beneath it? Then maybe that water would sink as warmer water (39F) water is denser than 32F water. I’ve seen very thin ice form on large lakes overnight when the water is 40F and the lake is very calm and there is a full view of the night sky.
Or maybe the same thing happens wiith cold water on still nights with little evaporation.
“If there is ice on water, can far IR penetrate that ice to heat the water beneath it?”
No, but light can. The emissivity of water is >0.99, so if it is dead calm the surface can lose a lot of heat in a single night.
As I pointed out in your last thread IIRC, this is neither conduction nor convection. Wate is a very poor conductor of heat which is why electrical immersion heaters remain hot at the top and not mixed to a uniform temperature.
Secondly convection can only happen at night when there is the temperature inversion shown in your graphs. The mixing is mainly wind and wave driven turbulence.
You mentioned not tracking the day-night cycle of clouds. I think this would be a very important aspect to investigate. Clouds form more frequently during the day (helping to block incoming radiation) and form less frequently at night (allowing more energy to reradiate back into space).
You mentioned the correlation to heat capture and winds. With gentle winds, the energy received by the upper layers of the ocean would behave something like a boundary layer with very little mixing of ocean water between layers. The primary heat transport mechanism would be conduction / diffusion. As wind speed increased, the amount of mixing between layers and heat transport into deeper layers of the ocean would increase due to turbulent mixing. Heat transported deeper into the ocean would increase its long-term residency in the Earth’s hydrosphere *and* decrease the temperature of the surface layers of the ocean which would decrease the amount of energy available for radiated back into space.
This may be somewhat offset though. As wind speeds continue to increase, ocean spray would separate from the surface. This effectively increases the surface area of the ocean but I do not know how to calculate its effect to determine whether this is a net increase or decrease in heat transport (larger effective surface area but lower temperature due to mixing with lower layers). My WAG is that the temperature effect would dominate. Someone has probably done research along these lines so there may be empirical data available.
Love it. The more diurnal focus over daily or annual average, the better. All the steady stste crap hides too many false assumptions to the point of fiction over reality.
Excellent post Mike. Thanks!
Mike Jonas Great to see your scientific exploration following Richard Feynman’s “bending over backwards to show how you’re maybe wrong” high standard of scientific integrity
You say: “clouds are a major driver of ocean surface temperature, and hence of climate” – yet say “The ocean oscillations are not, as far as I am aware, caused by clouds”.
Yet could they be? Here is some unquantified brainstorming.
1) Is there quantifiable interaction between the sun’s varying magnetic fields impacting the helical heliosphere which interacts with earth’s magnetic fields to impact clouds via Henrik Svensmark’s Cosmoclimatology theory due to Galactic Cosmic Rays modulated by the solar magentic field. E.g., ftp://130.226.216.191/pub/Henrik/FB/Svensmark2009(Forbush).pdf
2) The east/west ENSO “sloshing” of the Pacific ocean causes E/W variations in ocean temperatures and thus in regional humidity and thus in clouds which causes feedback to ocean surface temperature. Similarly the summer/winter “monsoons” (=winds) cause oscillating weather north/south which interact with the E/W pacific sloshing-temperature-humidity-cloud interactions. Both factors coupled with the heliosphere/GCM impact will change clouds which in turn affects the ocean currents.
When the Pacific’s E/W sloshing reaches the western Pacific, I expect the Indonesian Through Flow between Indonesia – Australia – will have an “overflow” / valve type impact from the Pacific into the southern current of the Indian Ocean.
http://www.indonesianthroughflow.com/wp-content/uploads/2013/02/indonesiathruflow-300×203.gif
While nominally dissipative, could that Indonesian flowthrough further contribute to exciting the Arctic ice driven sequential Stadium Wave discovery by Wyatt and Curry?
Such heliosphere – GCM – cloud – Indonesia – Australian flow interactions might become amplified by resonance to the Pacific E/W oscillation /stadium wave events.
David L. Hagen – Noted, thanks. I did contemplate the possibility, but didn’t have enough data to investigate this aspect. Worth more investigation.
Regarding: “From 1983 to 2009, the increased CO2 delivered a downward RF increase of +0.20 Wm-2 (see previous post Appendix A)”:
What Appendix A in the referenced post says is: “Mauna Loa CO2 in 1983 averaged 342.7ppm, in 2009 averaged 387.2 (Data downloaded from here in Feb 2012). That gives an RF increase of +3.7*(log2(387.2)-log2(342.7)) * (1.66/1.62) = +0.20 Wm-2.”
That being equal to .2 W/m^2 is incorrect. The answer is .2 using log10 instead of log2. Using log2, the answer is .66 W/m^2.
Donald L. Klipstein – Thanks, I’ll check.
Do you have any results from checking yet?
Log2(x) = loga(x)/loga(2), where a is any constant including 10 or the natural log base e.
Log2(342.7) = 8.4208
Log2(387.2) = 8.5969
These can be checked by verifying that 2^8.4208 = 342.7 and 2^8.5969 = 387.2.
“I use SORCE data for 2003. All years are almost identical.”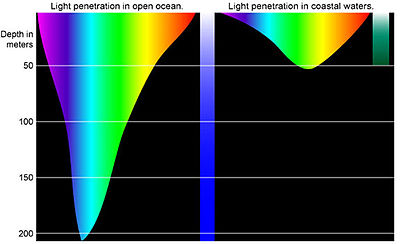

All years are not ‘almost identical’ in solar activity, and nowhere here is there any appreciation or analysis regarding what happens to OHC/SSTs during low solar activity vs high solar activity cycle periods.
Year 1au SORCE TSI
2015 1361.4321
2014 1361.3966
2013 1361.3587
2012 1361.2413
2011 1361.0752
2003 1361.0292
2016 1361.0073
2004 1360.9192
2010 1360.8027
2017 1360.7902
2005 1360.7518
2006 1360.6735
2007 1360.5710
2009 1360.5565
2008 1360.5382
“…the solar energy absorbed into the top fraction of a millimetre of the ocean then mixes (conducts and convects) into the top 5-10m only, and nearly all of it stays in just the top 1m. But overnight, it is all lost, back into the atmosphere.”
But overnight, it is all lost, back into the atmosphere. How is that known?
A practical question is how long does it take for varying solar energy deposited at depth to resurface?
And that is just one angke of incidence. Now fir equatorial versus polar…..
About that graph with 3 curves for penetration depth of solar radiation through water:
The depth figures stated in meters in a liquid water absorption spectrum are actually centimeters. I think someone did not notice that such a graph is usually plotted with a Y scale of cm^-1, and not m^-1.
Also, the magenta curve looks like depth at which 25% is transmitted and 75% absorbed, not 75% transmitted. And the purple curve looks like the depth at which 10% is transmitted and 90% is absorbed, not 99.9% transmitted. (If the Y scale is changed from meters to centimeters. The purple curve is the depth for 99.9% absorbed if the Y scale is meters.)
“CO2 cannot heat the oceans.”
Of course not, CO2 is not a heat source. Water vapor cannot heat the ocean. Of course not. Clouds cannot heat a desert at night. Of course not, as water vapor is no heat source. But why do you freeze in Sahara, under clear sky at night? Why have farmers for hundred of years made fires to prevent crops from freezing under clear sky in autumn nights? (it is not the heat from fires) It is about longwave radiation. Think of an answer.
“It is about longwave radiation” – ultimately, yes. But for the most part it’s about energy dissipation in all forms. Less of the radiative myopia please, that’s how this bunk got started in the first place. Never mind ocean thermal capacity, what about the rest of the planet? Does that not enter into the supposed equilibrium that cannot possibly exist, except within roughly characterised bounds evolving over indeterminate time periods – the very definition of climate change!? Rulers and linear bullshit are good for laying garden paths but not for characterising shifting weather patterns in an attempt to pin causality on the back of an almost infinitely complex chaotic system. Treat applied numerology with the distain it deserves and live with it.
In the summer time, when surface temps are over 100F, you don’t. Lows may only be in the 70’s/80’s as happens in *any* desert. You can freeze in the Sahara when it is winter time & you have cold air advection blowing in colder air (and some snow for effect) 😉
If you are claiming summer deserts freeze at night, better back that up with some official observations & not just anecdotal climatology.
Operation Torch was the British-American invasion of French North Africa during the North African Campaign of the Second World War which started on 8 November 1942. Wikipedia
And it was a freezing experience.
The Western Regional Climate Center in Reno NV reports “The freeze-free season varies from less than 70 days in the northwest and northeast” part of Nevada, and that “freezes begin early in the autumn and continue until late in the spring.” They were talking about night-time temperatures.
The military of 130 countries, including the US, use these northwest and northeast regions of Nevada for training soldiers for the Iraq and Afghanistan wars because of the high desert heat during the summer day and cold at night. A US soldier who told me about this (he’d just got back from training there), and said some soldiers had died from the cold during nightime exercises. I don’t know if those cold nights were flukes but according to this soldier who experienced this firsthand, they occurred during summer nights, when the daytime temp according to him was over 100F.
MRW,
I can believe the statement. The Sahara is known for daytime highs over 100 and below freezing at night.
well…I only know what is reported & forecasted. here are some NWS forecasts for some desert spots around the SW US.
NWS Forecast for: 13 Miles S Furnace Creek CA
Issued by: National Weather Service Las Vegas, NV
Last Update: 2:38 am PDT Jun 16, 2015
Excessive Heat Watch
This Afternoon: Sunny and hot, with a high near 122. South wind around 8 mph.
Tonight: Mostly clear, with a low around 93. South southwest wind 8 to 13 mph becoming light and variable after midnight.
Wednesday: Sunny and hot, with a high near 124. Light southwest wind.
Wednesday Night: Mostly clear, with a low around 94. South wind 3 to 7 mph.
Thursday: Sunny and hot, with a high near 125. Light and variable wind.
Thursday Night: Mostly clear, with a low around 94.
Friday: Sunny and hot, with a high near 127.
Friday Night: Mostly clear, with a low around 96.
Saturday: Sunny and hot, with a high near 128.
Saturday Night: Mostly clear, with a low around 97.
Sunday: Sunny and hot, with a high near 128.
Sunday Night: Mostly clear with a low around 97.
Monday: Sunny and hot, with a high near 127.
Just west of Barstow, ca.
NWS Forecast for: 10 Miles NNW Helendale CA
Issued by: National Weather Service Las Vegas, NV
Last Update: 2:38 am PDT Jun 16, 2015
Excessive Heat Watch
This Afternoon: Sunny, with a high near 102. West southwest wind around 16 mph, with gusts as high as 23 mph.
Tonight: Mostly clear, with a low around 68. Southwest wind 10 to 18 mph, with gusts as high as 25 mph.
Wednesday: Sunny, with a high near 102. West southwest wind 8 to 13 mph increasing to 16 to 21 mph in the afternoon. Winds could gust as high as 29 mph.
Wednesday Night: Mostly clear, with a low around 69. Southwest wind 14 to 18 mph, with gusts as high as 25 mph.
Thursday: Sunny, with a high near 103. West southwest wind 11 to 17 mph, with gusts as high as 24 mph.
Thursday Night: Partly cloudy, with a low around 69.
Friday: Sunny, with a high near 103.
Friday Night: Mostly clear, with a low around 70.
Saturday: Sunny, with a high near 104.
Saturday Night: Mostly clear, with a low around 69.
Sunday: Sunny and hot, with a high near 105.
Sunday Night: Mostly clear, with a low around 71.
Monday: Sunny and hot, with a high near 105.
Near Lake Havasu, Az.
NWS Forecast for: 20 Miles NNE Lake Havasu City AZ
Issued by: National Weather Service Las Vegas, NV
Last Update: 2:38 am MST Jun 16, 2015
Excessive Heat Watch
This Afternoon: Sunny and hot, with a high near 110. South southwest wind around 16 mph, with gusts as high as 23 mph.
Tonight: Mostly clear, with a low around 76. South southwest wind 5 to 13 mph becoming east southeast after midnight.
Wednesday: Sunny and hot, with a high near 111. Southeast wind 5 to 15 mph becoming southwest in the afternoon. Winds could gust as high as 21 mph.
Wednesday Night: Clear, with a low around 77. South southwest wind 5 to 10 mph becoming light south in the evening.
Thursday: Sunny and hot, with a high near 113. Light and variable wind becoming west around 6 mph in the afternoon.
Thursday Night: Partly cloudy, with a low around 79.
Friday: Sunny and hot, with a high near 115.
Friday Night: Mostly clear, with a low around 79.
Saturday: Sunny and hot, with a high near 116.
Saturday Night: Mostly clear, with a low around 81.
Sunday: Sunny and hot, with a high near 117.
Sunday Night: Mostly clear, with a low around 81.
Between Phoenix & Tuscon, Az.
NWS Forecast for: 9 Miles SE Florence AZ
Issued by: National Weather Service Tucson, AZ
Last Update: 2:17 am MST Jun 16, 2015
This Afternoon: Sunny and hot, with a high near 106. West northwest wind around 9 mph.
Tonight: Mostly clear, with a low around 77. Northwest wind 5 to 9 mph becoming east southeast after midnight.
Wednesday: Sunny and hot, with a high near 108. South southeast wind 5 to 14 mph becoming northwest in the afternoon.
Wednesday Night: Mostly clear, with a low around 78. Northwest wind 5 to 9 mph becoming light and variable.
Thursday: Sunny and hot, with a high near 108. South southeast wind 6 to 14 mph becoming west northwest in the afternoon.
Thursday Night: Mostly clear, with a low around 77.
Friday: Sunny and hot, with a high near 109.
Friday Night: Clear, with a low around 76.
Saturday: Sunny and hot, with a high near 110.
Saturday Night: Mostly clear, with a low around 77.
Sunday: Sunny and hot, with a high near 109.
Sunday Night: Mostly clear, with a low around 77.
Monday: Sunny and hot, with a high near 108.
Monday: Sunny and hot, with a high near 116.
Northwest of Las Vegas, Nv.
NWS Forecast for: 14 Miles NW Tonopah NV
Issued by: National Weather Service Elko, NV
Last Update: 12:45 am PDT Jun 16, 2015
This Afternoon: Sunny, with a high near 94. West wind around 6 mph.
Tonight: Mostly clear, with a low around 57. North wind 6 to 10 mph.
Wednesday: Sunny, with a high near 94. Light and variable wind becoming west southwest around 6 mph in the morning.
Wednesday Night: Clear, with a low around 57. Southwest wind 5 to 8 mph becoming calm in the evening.
Thursday: Sunny, with a high near 95. Calm wind becoming south southwest 5 to 8 mph in the afternoon.
Thursday Night: Clear, with a low around 59.
Friday: Sunny, with a high near 94.
Friday Night: Clear, with a low around 59.
Saturday: Sunny, with a high near 95.
Saturday Night: Clear, with a low around 60.
Sunday: Sunny and hot, with a high near 96.
Sunday Night: Clear, with a low around 60.
Monday: Sunny and hot, with a high near 96.
Jkrob,
Those were not normal highs and lows. An extreme heat wave hit the region during the last two weeks of June that year and the month of July, and I think, the first two weeks of August. The last time a heat wave of that calibre hit the region like that was 1994.
The heat wave was in southern Nevada mainly and the Mohave Desert, Barstow, etc. Brutal.
Mojave Desert. Fat fingers.
To MRW, etc.,
Again, if you are claiming summer deserts freeze at night, better back that up with some official observations & not just anecdotal climatology. I did my part, you didn’t do yours…
MRW –
>Northwest of Las Vegas, Nv.
>NWS Forecast for: 14 Miles NW Tonopah NV
>Issued by: National Weather Service Elko, NV
>Last Update: 12:45 am PDT Jun 16, 2015
>
>Friday: Sunny, with a high near 94.
>Friday Night: Clear, with a low around 59.
I disagree…
“If you are claiming summer deserts freeze at night, better back that up with some official observations & not just anecdotal climatology.”
I can speak from personal experience. The coldest I have even been was sleeping in the deserts behind San Diego.
The difference between the hottest and coldest temperature records in Death Valley is 119 degrees (134 minus 15).
The desert averages seven nights a year of freezing weather, which can occur in December, January and February.
The key to your puzzle is an understanding of enthalpy. Cool moist air can contain more heat than warmer, drier air. Moisture condensing at altitude reduces the cooling of the air. This reduces heat loss at surface. At this point I am not convinced that the climate establishment understands the relevance of this either
As I understand it the difference in the heat capacity of moist and dry does not amount to much, as the average percentage of water vapour in air is only about 2%. 4% in the tropics.
However evaporation removes heat from the surface to WARM the air progressively as it condenses by 3.3ºc/km. Which results in the observed lapse rate reduction from the gravitational 10ºc/km. With a tropopause at 10km high this means that the air at that height is 33ºc warmer than it should be. NASA knows this and so can say with confidence that “greenhouse gases” warm the air by 33ºc. What they forget to mention is that this warming is not by radiative means but simply by the latent heat in water vapour stolen from what would have been a warmer surface.
173,000 terra watts of solar radiation reaches the earth all the time.
A lot of that is absorbed and stored in tropical waters as a warm layer floating on top of the cold ocean. This storing of heat and its redistribution moderates the polar to tropical gradient.
The main obstacle to this process is cloud cover which always ultimately cools the surface. The only meaningful radiative process going on here is a slowing down of radiative cooling of the surface at night and slowing of the warming of the surface during the day by water vapour and clouds. Water in its various forms acts as parasol, storage heater, central heating and air conditioning system for the world. If CO2 is added to the mix you have the potential for life.
Pablo,
173,500 terrwatts is the flux at the top of the atmosphere for a disk of the same average radius as Earth. However, much less than 30% of that reaches the surface and is available for surface heating because of scattering and absorption by the atmosphere and scattering by clouds; it is probably even lower for the oceans because of equatorial cloudiness and plankton using light for photosynthesis instead of it resulting in heating of the water. Further, the amount of sunlight reflected by the oceans is dependent on the angle of incidence and is, on average, greater than usually reported, as I have previously demonstrated here on WUWT
True… the point being that its a hell of a lot more incoming than the 0.1W/m2 outgoing from the core.
The heat capacity of the ocean is 3000 times that of the atmosphere and despite all the vagaries of cloud cover, angles of incidence etc. the fact remains that it is a very efficient storage tank for solar energy and luckily for us the warmer water floats on top.
Pablo,
You said, “…the point being that its a hell of a lot more incoming than the 0.1W/m2 outgoing from the core.”
I suspect that the number being used is a lower-bound for the amount of heat released by the oceanic crust because it represents the typical surface heat loss of the great slabs of relatively cool basalt and gabbro. I doubt if the 45,000 miles of active spreading centers, hydrothermal vents, and underwater volcanoes are being evaluated adequately (probably only the Dept. of Defense knows where most of the shallower volcanoes are). With a massive linear source of high-temperature heat sources (with no similar active sources on land), and an unknown number of point sources, I seriously doubt that we have a good understanding of the heat regime of the oceans.
Even so, Ben Wouters claims “You’re definitely looking in the right direction. Although small, the average 100 mW/m^2 flux through oceanic crust is sufficient to warm all ocean water 1K every 5000 years or so.” So, again, if what Ben claims is true, and the 0.10 to 0.15 values are a lower-bound, then it does help address the “missing heat” problem.
When one is balancing financial books, it is common practice to try to balance to the nearest penny. I think that balancing to the nearest $100 and ignoring everything else may lead to missing someone skimming the account. That is, if we really want to understand what is going on globally, we need to take into account even small contributions and not just wave our hands and say it is negligible until such time as we can be certain the claim is valid.
How does this relate to the apparently predictable and patterned air temperature change recorded since 1880 (alternating 30 year periods of warming and pause in warming)?
Changes in planetary motions and configurations alter the climate on Earth, as does solar activity. We are in last few hundred years of our present 11,000yr interglacial. This has given mankind the warmth and breathing space for our rapid development to the present day. The ice will return.
The felling of forests, draining of swamps, building megacities and overgrazing with our livestock etc. does affect local climate sometimes dangerously. The clean and efficient burning of fossil fuels from centralised utilities less so I suspect.
The demonising of CO2 is a distraction from the very real environmental challenges out there and to the credibility of science and politics in general.
Ironically the promotion of diesel cars by our misguided European politicians, as a green alternative to petrol, has resulted in real and deadly pollution from carbon particulates and nitrous oxides.
If this is true it should be evident in mortality statistics. I am not aware of any figures that support your claim. The EPA rules that govern fine particulate are based on enviro-religious speculation. No better than global warming. Your assertion appears to be equally unscientific.