
From the missed target department and STANFORD’S SCHOOL OF EARTH, ENERGY & ENVIRONMENTAL SCIENCES
Without a significant effort to reduce greenhouse gases, including an accelerated deployment of technologies for capturing atmospheric carbon and storing it underground, and sustained growth in renewables such as wind and solar, the world could miss a key global temperature target set by the Paris Agreement and the long-term goal of net-zero climate pollution.
The finding, published in the Jan. 30 issue of the journal Nature Climate Change, is part of a new study that aims to track the progress and compare emission pledges of more than 150 nations that signed the Paris Agreement, a 2015 United Nations convention that aims to keep global warming below 2 degrees Celsius of pre-industrial levels — the threshold that scientists have marked as the point of no return for catastrophic warming.
“The good news is that fossil fuel emissions have been flat for three years in a row,” said Robert Jackson, chair of the Department of Earth System Science at Stanford’s School of Earth, Energy & Environmental Sciences. “Now we need actual reductions in global emissions and careful tracking of emission pledges and country-level statistics.”
In the new study, Jackson and his colleagues developed a nested family of metrics that can be used to track different national emissions pledges and thus global progress toward the objectives of the Paris Agreement.
Applying their method to the recent past, the researchers found that global carbon dioxide emissions have remained steady at around 36 gigatons of carbon dioxide for the third year in a row in 2016.
“The rapid deployment of wind and solar is starting to have an effect globally, and in key players such as China, the U.S. and the European Union,” said Glen Peters, senior researcher at the Center for International Climate and Environmental Research – Oslo (CICERO) and lead author for the study. “The challenge is to substantially accelerate the new additions of wind and solar, and find solutions for effectively integrating these into existing electricity networks.”
However, wind and solar alone won’t be sufficient to meet the goals of the Paris Agreement. When the researchers examined the drivers behind the recent slowdown, they found that most of them boiled down to economic factors and reduced coal use, mostly in China but also the United States.
In China, the decline in coal use was driven by reduced output of cement, steel and other energy-intensive products, as well as a dire need to alleviate outdoor air pollution, which is responsible for more than 1 million premature deaths annually.
The reasons for the decline in the United States were more complex, driven not only by a decline in coal use but also by gains in energy efficiency in the industrial sector and the rapid rise of natural gas and wind and solar power. “2016 was the first year that natural gas surpassed coal for electricity generation,” said Jackson, who is also chair of the Global Carbon Project, which tracks the amount of carbon dioxide emitted by humans each year.
Looking to the future, the researchers predict that the greatest challenge to meeting the goals of the Paris Agreement is the slower than expected rollout of carbon capture and storage technologies. Most scenarios suggest the need for thousands of facilities with carbon capture and storage by 2030, the researchers say, far below the tens that are currently proposed.
Jackson notes that carbon capture and storage technology will prove even more crucial if President Donald Trump follows through with his campaign pledge of resuscitating the nation’s struggling coal industry.
“There’s no way to reduce the carbon emissions associated with coal without carbon capture and storage,” Jackson said.
Jackson is also a senior fellow at the Stanford Woods Institute for the Environment and the Precourt Institute for Energy.
###
Other authors on the study, titled “Key indicators to track current progress and future ambition of the Paris Agreement,” include Robbie Andrews and Jan Ivar Korsbakken of CICERO; Josep Canadell of the Global Carbon Project; Sabine Fuss of the Mercator Research Institute on Global Commons and Climate Change; Corinne Le Que?re? of the University of East Anglia; and Nebojsa Nakicenovic of IIASA, the International Institute for Applied Systems Analysis.
Funding was provided by the Research Council of Norway and the National Environmental Science Program-Earth Systems and Climate Change (NESP-ESCC) Hub.
The question is, should we be worried about the warming caused by GH gases and of course by CO2? No, we should not.
According to IPCC the RF (Radiative Forcing) is related to the surface temperature according to a very simple equation dT = CSP * RF, where dT is a temperature change at the surface and CSP is a climate sensitivity parameter (lambda). According to IPCC the value of CSP is 0.5 K/(W/m2) and it is almost constant. IPCC has used a lot of of work and money for composing AR5 and showing that the RF value of 2.34 W/m2 has been caused by the anthropogenic drivers (98 %) and by the sun (2 %). But surprise, surprise, in AR5 IPCC does not inform what is the dT value of RF value of 2.34 W/m2. Missing calculation skills are not the reason. There are 1552 pages in the Physical Science Basis of AR5, but this information cannot be found. I have challenged many people to find it but no results so far.
Well, the connection between the RF and dT is as simple as it could be: dT = 0.5 K/(W/m2) * 2.34 W/m2 = 1.17 K = 1.17 Celsius degrees. The error between the IPCC model and the observed temperature is 1.17 C – 0.85 C = 0.32 C, which means a substantial error of 38 % in 2011. What is this error in the end of 2016? NOAA a very IPCC-minded organization and they publish the annual RF values of GH gases. The increase from 2011 to the end 2016 is 0.15 W/m2. It means that the estimated RF value of 2016 would be 2.34+0.15 = 2.57 W/m2 corresponding to the global temperature increase of 1.27 C. This value is 49.4 % higher than the observed temperature 0.85 °C, which has stayed about constant since 2000. This is illustrated in figure below.
Aveo–
Very nice discussion and graph. However, you state that the IPCC value for lambda is 0.5, but I think that AR5 finally punted on a value for lambda. Previous reports had always estimated climate sensitivity at 3K per CO2 doubling, but AR5 chose to present only the range (1.5-4.5K) without selecting a best value. No doubt they were seeing the handwriting on the wall from Otto et al, Nic Lewis, etc. showing that the climate sensitivity was lower, perhaps half of what they said previously. In that case, they are no longer making an error as large (32-50%) as what you show. Perhaps they are right on! This would be a first for IPCC.
If emission models do not correlate with direct measures then the current paradigm has false parameters. Those parameters could be any number of things, even that human emissions have no affect on the rise in CO2, leaving the null hypothesis in place, that is that the measured trend in CO2 is from natural processes.
Brilliant observation, Pamela!
Thanks for using your intelligence!
Pamela. This claim is easy to prove to be wrong. The percentage of anthropogenic CO2 in the atmosphere is 8 %. Where does it come from? It is very obvious that it is there, because there are human emissions into the atmosphere every year. They cannot disappear directly into the ocean or into the biosphere.
aveollila @January 31, 2017 at 8:19 am
“It is very obvious that it is there, because there are human emissions into the atmosphere every year. They cannot disappear directly into the ocean or into the biosphere.”
They surely can, and they do. I outlined a toy model that describes how it can do so here.
There is very little doubt about it. Concentration does not track anthropogenic emissions.
Pam that’s exactly what the record of co2 and temperature showed. ( before they started changing it) . I’ve been saying something like this for a year and a half now. Thank you, it is well said.
You are probably familiar with the early arguments that they could tell anthropogenic co2 from natural by the isotopic ratios. Meaning that since anthropogenic co2 came from burning buried fuels it would have have less isotopes. Then the greens forgot about this argument in favor that anthropogenic co2 was producing co2 that was higher in isotopes than normal co2. They don’t know. ( it was a major point in that gas leak near Los Angeles, they included in all anthropogenic co2) it’s also the reason they put up a satellite to measure co2 world wide.
If emissions plateaued, that’s the rate of the rate of increase (I repeat: rate of rate; acceleration) that gets reduced. The rate of increase keeps the same instead of getting stronger, getting linear instead of quadratic, but that won’t show in just three (or even 10!) years.
Well spotted Anthony.
I rather fancy that the Stanford School of Climate Clowns will now realise that their asylum is a crock. They probably do not even realise how much their nonsense is detested, especially when you get to know how much grant money they have sucked out of the eco-tard-approved system.
Millions and millions of OPM.
Well, look who’s in charge (of OPM) now. Let their “carbon-waling” begin. Yippee !
https://youtu.be/nLuBgZ1bgoY
LMofBr has rumbled their little game (yet again). Bloody marvellous !
I love the chart by co2islife, comparing dollars spent on the “CO2” scientific chart. However, the chart is doing a great disservice by not expanding the CO2 side of the chart to the actual dollars spent. If this chart reflected CO2 concentration to dollars spent properly, it actually would look more like Al Gore’s hockey stick, with spending starting below 100 PPM and showing CO2 concentrations above 750PPM currently. (The left side of the chart should correlate with the actual dollars spent, not stop at 400 PPM). If this chart was placed side by side to Al Gore’s hockey stick I think it would be a stunning wake up call to the vast waste of taxpayer dollars.
Until someone explains how Russ George’s iron seeding experiment couldn’t be replicated around the world, expanding fisheries and feeding hundreds of millions, I will continue to view atmospheric CO2 as a resource, not a problem.
I like how those per capita emissions graphs always seem to ignore those nations who have similar or higher per capita emissions than the United States.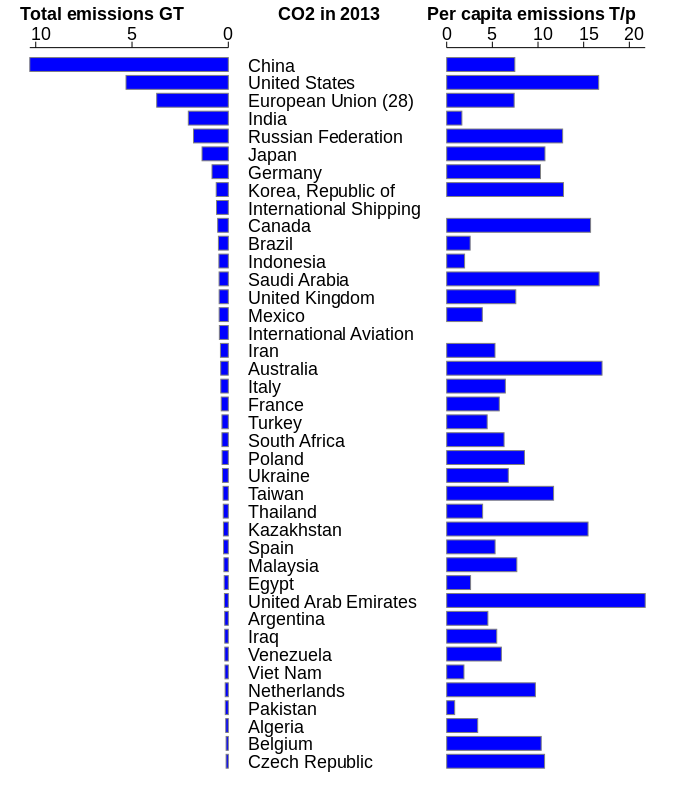
Among those nations are Australia and Canada (along with most of OPEC). The common connection between these nations is the continent width and an effective desert in the middle. This increases transportation costs relative to other nations as good or fuel are moved from one coast to the other. (Ironically, Luxembourg and Montserrat are among the highest per capita nations),
“The finding, published in the Jan. 30 issue of the journal Nature Climate Change, is part of a new study that aims to track the progress and compare emission pledges of more than 150 nations that signed the Paris Agreement, a 2015 United Nations convention that aims to keep global warming below 2 degrees Celsius of pre-industrial levels — the threshold that scientists have marked as the point of no return for catastrophic warming.”
What scientists have determined this 2C is a tipping point? I keep hearing it quoted but have never seen any evidence it has even been considered by scientists. It was originally dreamed up by WWF as a point of political motivation. has anyone questioned these authors about their source for this statement?
According to a study reported in The Economist a few months back, renewables have not yet achieved any reduction in C02 emissions. (No I wont go looking for it, take my word for it). One can usually find these articles by using different key words in a search
This relates to R&D, installation, and inefficient manufacturing as compared to the hydrocarbon industry. Remember that all those modern materials used in renewables have to be mined, and/or processed. Composites are usually manufactured from hydrocarbons
A wind farm was erected nearby from where I write. The earth works alone was substantial – powered by diesel (bring on the electric bulldozers!). A whole new access road was formed. The heavy equipment coming in stuffed our existing road, much of which had to be re-sealed. With what? bitumen. If we could calculate all the diesel alone used in that development it has an awful lot of catching up to do. I wonder if ever will, given that its lifetime is (apparently) 30 years
I don’t think that you will find a factory producing the alloys used in a wind turbine blade being powered by wind turbines 🙂 – or a renewable-powered cement factory that is required to build the substantial concrete foundations
The Economist study predicts that any savings “should” show up from here on in
I have also been told about a study that shows a gas-guzzling 1960 Chevy V8 has a lower environmental impact throughout its manufacture and lifetime than a modern electric car.
These are the issues that need to be exposed to the public
All peer reviewed data that I have found show that CO2 is coming from the ocean and not from Fossil Fuels. https://www.researchgate.net/publication/257343053_The_phase_relation_between_atmospheric_carbon_dioxide_and_global_temperature?enrichId=rgreq-9cd45871f5c4b32573881229a9638562-XXX&enrichSource=Y292ZXJQYWdlOzI1NzM0MzA1MztBUzozMzg4NzQyODM5MDUwMjRAMTQ1NzgwNTMzMzYyOA%3D%3D&el=1_x_3&_esc=publicationCoverPdf being the moat recent of such correlational studies.
Murry Selby uses the figure of approx. 30% of atm CO2coming from Fossil Fuels. https://www.youtube.com/watch?v=rCya4LilBZ8&t=1205s around 45 min point.
Why do we constantly hear that all CO2 is coming from Anthropogenic sources. Anyone? Because this obviously is no where near being factual!
CO2 LAGS temp both historically AND currently. Please, lets change the research focus. At least if we are serious about mitigation and not simply funding LIBERAL AGENDAS.
Stephen: You have misunderstood the message of the article published by Humlum et al. I am very well aware about the results of this study. The message is that there is about 11 months delay between the temperature change of the ocean and the corresponding change in the atmosphere. It does not mean that all the CO2 entering the atmosphere originates from the ocean. It looks like that you are not familiar with the basic fluxes in the recycling process atmosphere – ocean – biosphere. About 25 % of the CO2 content of the atmosphere is changing every year. Figure below shows these huge fluxes.
Aveollila
The conclusions of the Humlum paper include:
“(6) CO2
released from anthropogenic sources apparently has little influence on the observed changes in atmospheric CO2,and
changes in atmospheric CO2are not tracking changes in human emissions.
(7) On the time scale investigated, the overriding effect of large vol-
canic eruptions appears to be a reduction of atmospheric CO2
presumably due to the dominance of associated cooling effects
from clouds associated with volcanic gases/aerosols and volcanic debris.
(8) Since at least 1980 changes in global temperature, and presumably especially southern ocean temperature, appear to represent
a major control on changes in atmospheric CO”
I think 6 and 8 confirm Stephen’s contention. This aligns with Salby’s presentations and Hertzberg and Schreuder, 2016. Ellis and Palmer, 2016 ,Marohasy and Abbot, 2016 , and Easterbrook, 2016 have results that imply the same in that they show a lack of correlation of fossil fuel emissions and warming.
Forrest. IPCC says that all the CO2 increase in the atmosphere (850 – 600 = 250 GtC) from the year 1750 to this years originates from human emissions. If you look the figure above, you can see that it cannot be true. The ocean absorbs any CO2 molecules – not only human emitted. On the other hand this mean that the mixing layer of the ocean is getting more and more anthropogenic CO2 and it is recycling back into the atmosphere. The total process is much more complicated than you think.
Aveollia, explain the sinks. There are no negative numbers from 1750 to 1900. Today the sink is sinking 1 1/2 times the amount of all co2 produced in 1965. How is that ? Colder oceans and certainly huge forests, both temperate and tropical existed then. Did plants change ? Did the nature of the ocean chemistry change ? According to all the warmist, it shouldn’t be doing that, should it ?
And that’s the offical calculation. If you do the math the amount produced and the amount that is unaccounted for the last 10 years is an additional 17 to 30 % that is going somewhere other than the atmosphere. For example, in 2011 34.75 BMT was produced, co2 ppm rose 1.88 for that year, leaves 7.46 BMT short. A variation ? No every year is short.
2013 came in with a higher short at 7.49 BMT, even though co2 ppm rose 2.05. The reason is that 36.63 BMT were produced.
All numbers are/were from NOAA.
If you are really interested in to find out, what is going on in this CO2 recycling process, here is a link to my web page:
http://www.climatexam.com/single-post/2015/07/22/Simulation-proves-that-the-anthropogenic-CO2-portion-in-the-atmosphere-is-77-not-28-as-argued-by-IPCC
This is merely narrative, aveollila, plausibly consistent with some data points, but not uniquely explanatory so as to exclude other possibilities. See earlier comments interspersed above.
Thank you all so much. I am a Neuroscientist and as such an expert at many stats. I now spend a few hours a day studying CAGW and have learned much with the help of this site and others. THANK YOU sooooo much!
It looks like that answers and comments are linked to the wrong person or comment.
I replied to this comment:”Stephen, I can’t recall anybody saying that all CO2 is coming from anthopogenic sources”. I commented that there is somebody who says so and it is IPCC. IPCC says that the whole increase of CO2 in the atmosphere is anthropogenic.
Yes, you are rigth, I do not know how well you know the CO2 recycling process.
To rishrac. I just give few numbers according to my studies. These numbers are cumulative figures from 1750 to 2013. The CO2 emissions have been 394 GtC, 67 GtC stayed in the atmosphere, 181 GtC came from the ocean into atmosphere, 87 GtC of anthropogenic CO2 was absorbed by the ocean and 59 GtC of anthropogenic was intaken by the biosphere. Yearly flux values in 2013 for the anthropogenic fluxes: emissions 9.9 GtC, into the deep ocean 5.6 GtC, into the biosphere 2.5 GtC, and the increase in the atmosphere 1.8 GtC.
From 2000 till now, not one year should have been below 3.0 ppm. They are were except for 2016.
You can hide information in long time spans and gross amounts.
Beyond any doubt at this point, I am totally convinced that co2 follows temperature. Temperature has little to do with co2. And that is the co2 record. The amount claimed that was produced in each of the last 10 has not matched the rise in co2 ppm . So much co2 is missing that it is not a fluke.
Additionally, co2 level are also dependent on both the interaction of solar cycles and cosmic ray levels.
The major problem I have is getting you to understand it.
So alveollila are you also saying that observed greening is thus also anthropogenic? You seem to be using models as observation or direct measures. They are not. Direct measures should trend with models, else the model assumptions, at least in part are wrong. Since they do not trend together, what part of the emission models do you think need tweaking? That is the only direction this discussion can go. So speculate or move on to birds of a feather where no one is challenged to defend their particular thesis.
Good information
The obvious conclusion is that concentration is not significantly dependent upon fossil fuel emissions.
Forrest – it’s probably a pretty good measurement. Energy is heavily taxed the world over for the same reason Willie Sutton robbed banks. So, the quantities are tracked with all the vigor the tax authorities can muster.
GEOCARB III: A Revised Model of Atmospheric CO2 over Phanerozoic Time
http://www.ajsonline.org/content/301/2/182/F13.large.jpg
Current levels of CO2 are very low compared to prior epochs. 500 mya CO2 levels (even taking the most conservative reconstructions) were far above Dr. Hansen’s tipping point. So the “runaway greenhouse effect” is bunk. Or we’re all living in a simulation with some flaws.
From the press release stuff in the above article.
I tried to track down some of the information regarding this article.
Wasn’t free and I ain’t going to buy it.
That said, read their words:
“nested family of metrics”
“applying their method”
It is a model!!
Fill in your assumptions and estimates, then Voilà! It’s magic.
Where, I wonder, did they obtain their estimates for China, Russia and many other countries that are not investing much effort into seriously tracking emissions of any sort.
Nor have we heard that Beijing’s smog is flat lined.
Imagine that, their url includes Pangea. I wonder why.
Robert Jackson, chair of the Department of Earth System Science at Stanford’s School of Earth, Energy & Environmental Sciences, is also a fellow at “Stanford Woods Institute for the Environment” and “Precourt Institute for Energy.”
Doctor Jackson is apparently quite the activist.
What do you think is being fudged FG? Human emissions or environmental sources?
If I cease all weed control, never again cut back the chaparral, and stop pruning and thinning the timber … thaaaaaaat’s the ticket. That will increasing carbon fixing. Sounds like a plan all I need to do is convince my wife and neighbors. 😉
No wonder there are problems.
Now Griffith University is saying the cause of rising CO2 is climate change.
“Researchers from Griffith University have made a grim discovery; the Great Barrier Reef will be slowly poisoned by algae as carbon dioxide levels continue to increase due to climate change. ”
http://naturalsciencenews.com/2017/02/04/the-great-barrier-reef-may-be-further-stressed-by-poisonous-seaweeds/