Guest post by David Middleton

The folks at the logical fallacy factory must be working overtime…
According to Nasa, in 2016 the Earth’s surface temperature shattered the previous record for hottest year by 0.12°C. That record was set in 2015, which broke the previous record by 0.13°C. That record had been set in 2014, beating out 2010, which in turn had broken the previous record set in 2005.
If you think that seems like a lot of record-breaking hot years, you’re right. The streak of three consecutive record hot years is unprecedented since measurements began in 1880. In the 35 years between 1945 and 1979, there were no record-breakers. In the 37 years since 1980, there have been 12. The video below illustrates all of the record-breaking years in the Nasa global surface temperature record since 1880.
Firstly, according to the satellite data, the record had stood since 1998 and 2016 was technically a statistical tie with 1998…
Globally, 2016 edged out 1998 by +0.02 C to become the warmest year in the 38-year satellite temperature record, according to Dr. John Christy, director of the Earth System Science Center at The University of Alabama in Huntsville. Because the margin of error is about 0.10 C, this would technically be a statistical tie, with a higher probability that 2016 was warmer than 1998. The main difference was the extra warmth in the Northern Hemisphere in 2016 compared to 1998.

Secondly, “in the 35 years between 1945 and 1979, there were no record-breakers” because the Earth’s climate was cooling…

Thirdly, from 1937-1945, there were four “record-breakers” in 1937, 1941, 1943 and 1944. Back then, we were breaking global temperature records once every two years…

Conclusion
So what? Even if we were “now breaking global temperature records once every three years,” it wouldn’t be unprecedented and we actually had more frequent record breaking at a time when atmospheric CO2 levels were in the range of 305-310 ppmv…

- Record pace of record-breakers with 305-310 ppmv CO2

The folks over at SS can’t help themselves. Their level of knowledge is short, only encompasses last 8 years. There was life prior to that period…………………Wasn’t there?
A simple, brief list of previously warmer periods:
The Medieval Warming Period
The Roman Warming Period
The Minoan Warming Period
The Holocene Optimum
And of course, most of the Eemian..
Not to mention the 1930s.
In any given week here in Sunnyvale California, my local temperature can vary during the day, by a greater amount than the entire globe has changed during the last 650 million years.
So do you think I care about climate change or global warming; it isn’t even noticeable.
G
George,
Where I live (USA) the temp can vary 100 F from winter low to summer high. That’s only 6 months!
perhaps also the Adjustocene Period !
LOL. Love your coinage. Might even steal it. 🙂
This is strongly indicative of a major case of ADD (Attention Deficit Disorder) further complicated by medium/long term memory loss. Their Short Attention Span can only hold information for a maximum of 8 years back and their medium/long term memory loss prevent them from drawing the Big Picture from memories that they can no longer access
In this context ADD might mean Anthropocene Digital Disfunction
SS, manage to overlook the PER DECADE warming rate………., gee I wonder why?
The IPCC say at least .20C (the minimum) , .30C average rate.
NONE of the surface (Not important to the AGW conjecture, reach the minimum rate even with all those warming adjustments they have been making,while Satellite show about .12C per decade since 1979.
Typically misleading tripe from SS klub.
Pathetic!
According to the BBC scientists want to reset the starting date for measuring temperatures as they consider that global CO2 emissions had started to rise by the 1850s. Maybe they want to use the temperatures from the 1600s when the Thames froze over and they held ice fairs on it. That would give them a head start in claiming record temperature increases.
Just thinking about “ice fairs” on the Thames makes one long for the good old days before global warming when folks could frolic together and enjoy the midwinter windswept icy wonderland.
“Their level of knowledge is short, only encompasses last 8 years.”
Indeed. Most of the “new media” is written by, and for, twenty-somethings, with limited scientific or mathematical knowledge.
Sorry, but one course in statistics in the second year of a “Gender Studies” degree qualifies them for little more than baristas. Or science blog writer, which pays about as much.
Lets face it, they are counting on the increasing innumeracy of society. Do you think they’ll actually spend any time explaining error bars and how they might be related to changes of tenths of degrees?
As I learned from WUWT that many years ago, something that is so simple and obvious that most people don’t even think about it: records always go up.
So what?
‘Their level of knowledge is short, only encompasses last 8 years.’
If only they were honestly that stupid. Does anybody really believe they don’t know better?
It’s dishonesty, not stupidity. And contrary to popular belief, you CAN fix stupid. Dishonesty? Not so much – that’s a character trait.
AND, there still isn’t a scrap of empirical evidence that the temperature increase has a thing to do with CO2 levels, or the minuscule human contribution thereto. So once again, the response to the blather from (NON)SkepticalScience is “So what?!”
This shows water vapor via rel humidity regulating clear sky nightly cooling.
The water vapor concentration adjacent to the surface is not much more at night than it is during the day even according to this graph. A 20 degree F cooling roughly doubles relative humidity with constant concentration of water vapor. The cooling rate slows when the surface gets cooler than the air a few hundred meters above. Also, when the temperature drops enough to make the relative humidity in the air adjacent to the surface 100%, dew forms and dew formation releases latent heat.
It isn’t equilibrium, you can see here in the optical window, it’s still about the temp difference all night even as air temps drop. The result though is that water vapor at night, as it goes into the high rel humidity ranges the rate of outgoing radiation from the surface drops. Rel humidity changes with temperature, this is a temperature effect, temperature regulating cooling at night. Excess warming during the day is just radiated to space prior to the slow down, as if the temp didn’t go down, it wouldn’t slow down at all. Deserts prove this, as the tropics prove the opposite of this. That’s why min temp follows dew point averages.
Here’s the missing chart of the optical window
When air drops below the dew point, water vapor starts condensing. This releases a lot of heat into the atmosphere.
That’s why the rate of temperature drop reduces dramatically when the dew point is reached.
As one on the possibilities I’ve thought of, yes. But the end results are that min temps follow dew point temps. When rel humidity gets over about 70% (at the absolute humidity levels I’ve seen data from) cooling starts to slow down, even though it is still clear out and it’s still night time. Again point is the effects of co2 has little to no affect on cooling, as the surface air temps have to dump any excess to space before it slows.
Im not sure that graph supports your point.
Why?
Miniscule human contribution? Atmospheric CO2 concentration has increased about 45% from pre-industrial times, and it would have increased about 90% if nature didn’t do any net sourcing or net sinking. CO2 increased 45% despite nature being a net sink.
“human contribution”—how much is nature putting in?
Slight correction. Loss of latent heat leads to dew formation; NOT the other way round.
The Temperature does NOT rise, because dew formed.
The vapor has to LOSE the heat, BEFORE it can become dew; it doesn’t WARM anything.
G
Surely those percentages are based on absolute measurements published in a reliable source and, thus, you can provide the reference.
The planet-sized metrology of pre-industrialised times is fascinating. Particularly because the prevailing scientific consensus then was that burning creates phlogiston*, which has negative mass. Same stuff we call carbon dioxide today. It must have complicated the concentration measurements those days.
*https://en.wikipedia.org/wiki/Phlogiston_theory
DLK,
Your remark is really a non sequitur. Assume that there was some inert constituent in the atmosphere that was contributed by humans and had an initial concentration of 1 PPB. If it increased to to 2 PPB, that would be a 100% increase. However, since it is inert, it would have no consequences. Therefore, neither the absolute abundance or relative increase in something is important unless it has an effect. It just SOUNDS important to say that something has increased by some big factor.
“…despite nature being a net sink.”
Dumb pseudo-mass balance argument again. Nature is not a net sink on its own. You cannot put all sink activity on one side of a ledger balance when it responds to, and is thereby dependent upon, both natural and anthropogenic forcing. You have to separate it, so that you have all anthropogenic forcing and induced sink activity on one side, and all natural forcing and induced sink activity on the other.
It does not matter that sink activity is overwhelmingly by natural mechanisms. Those mechanisms respond dynamically to all forcing from all sources.
micro6500
January 25, 2017 at 12:14 pm
Your comment and related discussion is very worthy of a lead post. Excellent graphs! Very interesting/important topic.
I hope someone will pick up on this. Depending on how it plays out it could end up as a “sticky” for awhile.
Thank you so much for putting that picture up of the cover of Science News. In a heated discussion about 13 years ago the climate alarmists were adamant that never happened. It was never reported in Science News.
Thank you, thank you! I even described the picture of the ice towering over the city. Oh, I was delusional, it was science fiction, not real science.
Who knows if it’s the hottest. They can manufacture any temperature they want. Besides where are all the catastrophic events that were to take place ?
The alarmists got hit with the mother-of-all catastrophic events on 8 November 2016… 🙂
Yes. And the “error bar” of the opinion polls should have been something like “accurate to within 0% 0 times out of 10”.
It was a great example of people looking only at data they wanted to as it buttressed their beliefs.
And all that is without even addressing the issue of error range.
….”or error change”
Mike B –
Is that the key?
Certainly, there have been some ‘adjustments’.
I do not know the truth.
Possibly ’45’ will enable us, the public, to see what – if any – effect the said adjustments have had.
Trivial – or otherwise.
Auto
Here is a link to that particular issue
https://www.sciencenews.org/sn-magazine/march-1-1975
Note: Unfortunately the article requires paid membership to view.
https://www.sciencenews.org/archive/climate-change-chilling-possibilities?mode=magazine&context=1262&tgt=nr
You can read the article (without graphics) here:
https://www.sott.net/article/266751-1975-Science-News-Climate-change-Chilling-possibilities
Thanks ! I think there were other articles as well. I believe most of the science journals of the day covered it. It’s easy for CAGW to deny, its harder to keep the physical issues ssomewhere to prove otherwise.
IOW, they love to conflate “warming” with “caused by human activities,” when they have never established such a connection scientifically. It’s still just more hyperventilating about HYPOTHETICAL BS.
Skeptical Fiction year in, year out.
I can’t tell if you are saying the skeptics are creating fiction or the alarmist. If you are saying the skeptics are creating fiction, let me remind everyone that not one skeptic is in charge of temperature or carbon records. And yet both have been adjusted, again, in the past year. This is at least the third time for temperature and I think they adjusted the carbon record twice since 2015.
rishrac
January 25, 2017 at 12:22 pm
I totally agree with you.
I should have been clearer, I was referring to the Skeptical fiction coming out of the junk science warmist rag Skeptical Science a crooked group of climate mafia that have created a data fudging adjusters paradise!
Tom Nelson @tan123 Jan 16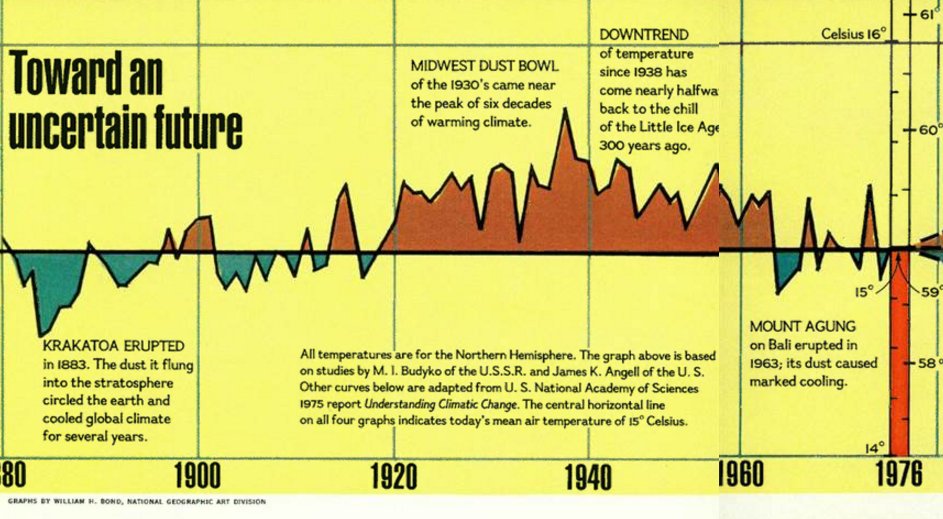
Massive Data Tampering Uncovered At NASA – Warmth, Cooling Disappears Due To Incompatibility With Models: https://twitter.com/tan123/status/820982878142103553
Note: in 1976 @NatGeo showed zero warming from 1880 to 1975:
So What? Ask Globalist Prime Minister Trudeau and you get this “Game Changer: http://www.ottawalife.com/article/canada-s-life-cycle-clean-fuels-policy-game-changer?c=9
Looks like planned Eugenics to me.
Thanks, David. The “So what?” in the title made me laugh.
Cheers.
1934 was warmer than 1998. So said none other than James Hansen in 1999.
Is 1934 still the unadjusted record holder?
TonyL.
You asked “Is 1934 still the unadjusted record holder?
No, that would have been during the Oct. 1873 -May 1879 “Long Depression”.
(See the WoodforTrees.com HADCRUT4 graph of temperature anomalies).
“The streak of three consecutive record hot years is unprecedented since measurements began in 1880”
Wow! That’s a lot of data!
That’s like 6% of the years in this era alone!
That’s like 2% of the data since the known start of civilization 5116 years ago!
I mean, it only takes something to be 5% of something to make it statistically significant, but this is SOMETHING!
IMO, nothing short of a notable decadal temperature downturn will stop the alarmist Juggernaut. To the general public (including politicians and the media) a record is a record. They neither have the wish or the inquiry to investigate in quantitative terms.
Many centralist governments around the world are signing in to the Paris Agreement. This is driven mostly by a “need to demonstrate global responsibility”. The list of undertakings by sovereign governments to comply with directives from global institutions (e.g. WHO, UN) is now long and growing. Science or economic considerations play no part in these ratifications. Repealing laws is awful lot harder than creating laws.
I still put the chances of a decadal temperature downturn within the next 5 years as 50:50. Even if, it will take at least 20 years for such an event to influence the cost about to be imposed on our various economies.
This battle is to be long – 2050 before the fog begins to clear (IMO). We should also consider that maybe the alarmists are right i.e. continued accelerating rise. I would no bet on that.
I just can’t get past the blatantly exaggerated use (misuse/abuse) of adjectives, and how this cannot be the very FIRST point of objection to statements such as …
“shattered” ? … Seriously ?! … 0.12° C. counts as “shattered” ? …. 0.13° C. counts as any significant sense of the word, “broke” ? A whole TENTH of a degree !!!!!!!!!!!!! … Oh. My. God. No !!!
Well according to NASA, no one knows the ‘Glowbull’ temperature of the Earth.
So why worry about fractions of degrees of an unknown quantity.
See last Q/A here.
http://data.giss.nasa.gov/gistemp/abs_temp.html
Not to mention that according to the Glow Bull Alarmists, 2016 was a whole 0.04 degrees C warmer than 1998.
Not much shatter there.
Nice snappy post, DM. As you note SKS is long on nonsense and very short on logic and fact. Contortions mostly good for amusment.
Plus, as Mark Van Biezen at the Daily Wire reported:
Here’s the years that continental records were set:
The World : : Hot 1913 Cold 1983
Europe : : Hot 1977 Cold 1978
Asia : : Hot 1942 Cold 1933
Africa : : Hot 1931 Cold 1935
Australia : : Hot 1960 Cold 1974
South America : : Hot 19o5 Cold 1907
North America : : Hot 1913 Cold 1947
Antarctica : : Hot 1974 Cold 1983
It depends on how you define “unprecedented”. Restricting the frame of reference will improve accuracy, but expanding it to universal proportions will force a social shift.
Anthropogenic or organic? Mother Nature is notoriously opaque outside a limited frame of reference.
Catastrophic or tolerable? Perhaps even beneficial.
Global or contextual? Regional and local conditions vary widely, and global conditions more so, without an overwhelming driver or unmitigated confluence of events.
Sustainable or temporal? The world is going to end! Carbon credits for sale.
Sequester a carbon-based life form, today. The narrative leaves the tracks from there.
“Catastrophic or tolerable? Perhaps even beneficial.”
So are you just crossing your fingers? Because the chances of any of those is non-zero.
Crossing fingers Tony ? To be the most successful psychic ever, all I would have have had to to was take every prediction by the IPCC and say just the opposite.
I’ve pointed out many times that to get every single prediction wrong is impossible unless you are you using the wrong math. Besides that’s fear mongering. You should keep your fingers crossed that the earth doesn’t go into another LIA, cold is far worse than warmth.
“cold is far worse than warmth”
Slow change, like 2C over ten thousand years and you’re probably right. Probably.
Where I live now will be covered by about a mile of ice. About the only thing worse, for this area, would be if Yellowstone blows.
And how will that be affecting you in the year 7100?
Me personally? Not much at that time. But today, being taxed to death while money is being bled to opportunistic thieves, all to try to keep the earth from “runaway glow bull warming”, is, very much.
We are clearly nearing the end of the Holocene. Winters where I live can be brutal. Any warming we can muster is welcome, indeed.
Lol, you wont see the end of the holocene.
Of course I won’t. But I do see stupidity today worrying about things that will not come to pass, such as Man Made Runaway Glow Bull Warming, which is really just an excuse for the Gore and his ilk to bilk.
Circa 50 million years ago, the Arctic Ocean was a swamp. 500 million years ago CO2 was at 8000 ppm.
If this planet ever had a chance to go into a runaway warming due to CO2, why hasn’t it yet?
Releasing trapped CO2 is good. Plant life is good. Warm is good. Find another windmill to tilt.
Tony, temperatures drop rapidly and quickly. It’s not a long slow process. In many systems, take a ballerina or an electrical wave, of the entire cycle time is almost 2/3 of the time going up, the ballerina appears to float. The fall is 1/3 of that time. You can see that in the temperature reconstruction of the past ice ages.
Climate history is replete with temperature falling extremely quickly. How quickly ? Animals eating and frozen while chewing. How cold is it that can flash freeze a 2 ton mastodon, outfitted for surviving in cold climates ? Um, was it warmer then or now if they found them still encased in ice ?
AGW as far as knowing and preparing for the future is absolutely the worst event that has occured. I put the system of climate science above communism in terms of being bad. It will get colder no matter what and nothing has been done. And the chief obstacle to knowing about the climate is the IPCC and associates. You know why ? They lie, hide facts, and confuse the issue all for the sake of a political agenda.
As for “So are you just crossing your fingers” …
No chances of anything is non zero, according to some modern theories..
But, lots of things accurately modeled, rapidly approach zero. For example, the likelihood that you will grow up, wear a pair, and take on a career that benefits mankind.
Go ahead, Don. Take another tilt.
If SkS use NOAA data, they are looking at record “adjustments™”, not record temperatures.
Certainly Nasa has set a record for the level of adjustments™ to the US record: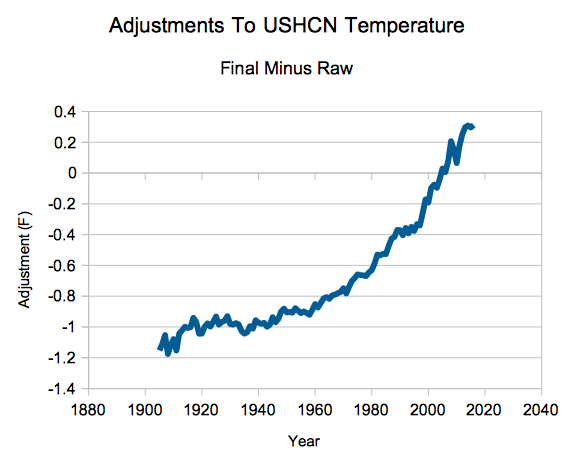
Globally, I’m sure it’s the same. I’m just not finding a graphic right away on that.
Are you suggesting the adjustments are finished? I think the title should be Latest Minus Raw.
In this case, final means the output of the adjustments.
Final…… until the next adjustment.
Gunna be fun watch the NOAA shenanigans as the temperature starts to ease off over the next few years 🙂
I’m pretty sure Trump will not tolerate any further adjustments. So we have, what, an eight year reprieve?
Once more with feeling – correlation is not causation.
Just saying it is getting hotter gets us no closer to WHY it is getting hotter
No John but where there is causation there is always correlation and there is a strong correlation. From my reading they can cause each other.
So what’s the causation. It can’t be CO2 because over the last 100 years temperatures have gone up, gone down, and stayed the same while CO2 has been going up.
Where I come from ice cream sales correlate with the number of drowning accidents, but not many insist they can cause each other.
“It can’t be CO2”.
I don’t think you can say that. May not be – is all you can say. Regardless of which is the cause and which the effect, I wouldn’t necessarily expect them to change in lock-step over yearly timescales, there are plenty of other aspects that fluctuate. ENSO and PDO for example.
But the correlation is pretty tight and there is some suggestion they can both be a cause: CO2 lagging temp in ice cores, plenty of evidence showing GHG radiative forcing effects. Jury is still out as to the which is more causative and by how much.
You seem to think it is a coincidence temperature has risen (since the LIA) and CO2 has risen concurrently, I hope you are right.
Where I come from ice cream sales correlate with the number of drowning accidents, but not many insist they can cause each other.
Obviously not without any evidence of causation. What is your point?
If rising CO2 caused rising temperatures, then rising CO2 would lead rising temperatures.
Rising temperature leads rising CO2, by about 200 to 800 years.
If there is direct causation between the two, it is temperature that drives CO2.
That is the case myNym, the ice cores appear to show
“Rising temperature leads rising CO2, by about 200 to 800 years.”
But that does not mean rising CO2 has no affect on temperature.
All of the evidence shows that temperature leads CO2.
If Earth was capable of Venus-like runaway glow bull warming, why didn’t that happen when CO2 was at 8000 ppm?
That’s not actually true, You can have causation without correlation.
I read a very good example a month or so ago, and will try and dig it up.
“myNym January 25, 2017 at 7:04 pm
If Earth was capable of Venus-like runaway glow bull warming, why didn’t that happen when CO2 was at 8000 ppm?”
There is no such thing as “runaway” warming on Venus. The temperature of Venus is what the temperature is FOR Venus. Nothing to do with CO2, but mass and pressure of the atmosphere. The first Russian probe, sent in 1950-summat, lasted a short time before being crushed in to oblivion. But before that it was able to transmit surface pressure, and was measured at ~90Bar, 90 times the pressure of the Earth. That is 90 times ~14PSI, or ~1250PSI.
Patrick MJD. Can you explain why the atmospheric pressure of Venus makes any difference to surface temperatures without the greenhouse effect? If the atmosphere of Venus was totally transparent to radiation it would have no ability to keep the surface hot, whatever the pressure.
Sorry Patrick, I should have said ALLEGED Venus-like warming.
You are entirely correct. Venus surface temperatures are driven by the weight of its atmosphere.
seaice1, the ability of CO2 to capture returning LIR is limited. It may have some minor contribution, but it is minor. It was once hypothesized that CO2 levels may be why Venus was so warm. Newer theories no longer hold that to be true.
myNym. What theories? There are no such theories that make sense. The weight of the atmosphere does not cause continual heating. If we pressurize a gas it heats up, yes. Then if we leave it at that pressure it cools down. That is basic physics. How can Venus remain hot? The only way is the greenhouse effect.
seaice,
The reason the pressure of the atmosphere at the surface of a planet has an effect is related to the MASS. A thicker atmosphere has more mass, and therefore can hold more energy. It is also denser at the surface (because of gravity), so it will hold more energy there. No gas is completely transparent to all radiation, so your hypothetical question is nonsense. The sun emits radiation in a broad spectrum of frequencies, and some of that will be absorbed by the atmosphere and converted into kinetic energy (heat). Depending on the amount of atmosphere involved, and to a much lesser extent the exact composition, some of that incoming radiation will reach the surface where it will be absorbed and converted into kinetic energy. That energy will then be transferred to the atmosphere via radiation (mostly IR) and conduction. Internally the gas molecules in the atmosphere will eventually transfer that energy to the top of the atmosphere via radiation, conduction, and convection. From there it will be radiated out into space, mostly on the night side of the planet. In the long term, the amount radiated out will equal the amount received from the sun, otherwise conservation of energy is violated. The amount of energy retained in the atmosphere at any one time is dominated by the total mass of it; the exact composition of it makes a negligible difference. The temperature gradient by depth (the lapse rate) is a function of density (gravity). This is basic radiative physics.
Don’t get caught up in the minor radiative differences of different gases. Sure they can be measured in the laboratory, and may even matter in some industrial processes, but they don’t make any meaningful difference in the energy balance of the atmosphere.
Diamonds are created in intense heat. And pressure. All of the heat, is caused by the pressure.
Pressure causes heat. That’s Physics 101.
I defer to Mr. Penrose’s more complete and far more eloquent response.
myNym. Compress a gas and it heats. leave it and it cools down. Pressure does not generate continuous heating. Pressure cannot explain the temperature on Venus.
Paul. “A thicker atmosphere has more mass, and therefore can hold more energy.” But where does it get the energy from?
“The sun emits radiation in a broad spectrum of frequencies, and some of that will be absorbed by the atmosphere and converted into kinetic energy (heat).”
OK, so the atmosphere gets its energy by absorbing radiation. How much incoming radiation does the atmosphere absorb? Indeed, how does the gas absorb at all? Diatomic molecules can increase rotational and vibrational energy levels. “Nitrogen absorbs only in the extreme ultraviolet of which there is very little in the Sun’s radiation. Oxygen absorbs more strongly than nitrogen and over a wider range of wavelengths in the ultraviolet.” So atmospheric gas absorbs only high energy radiation in the UV part of the spectrum. If we had a monotomic gas like argon it would absorb almost nothing, since there is nothing the atom can do to absorb the energy. The only degrees of freedom it has are changes in electronic energy levels, and these are very high energy. These gases absorb nothing in the longer wavelength part of the spectrum which is where most of the sun’s output lies.
So it is clearly wrong to suggest the composition of the atmosphere has little effect. Argin would clearly be different from nitrogen.
The far UV absorption happens in the high atmosphere. Lower down it is ozone that is responsible for absorbing UV radiation.
below 10km there is little heating of the atmosphere from incoming solar radiation. Instead, below 10km the atmosphere is heated by radiation form the Earth. The Earth has a temperature much cooler than the sun, and consequently emits radiation at a longer wavelength, principally in the IR part of the spectrum. N2 and O2 cannot absorb this radiation as there are no mechanisms for it to do so. To be absorbed, the energy in each photon must match a change in energy level of the molecule and there are no energy level changes available in N2 and O2 that match the energy of the photons. However, H2O and CO2 do have energy level changes available that mathch the energies of IR photons. hence these gases can absorb photons emitted from the earth. this causes warming of the atmosphere.
“Don’t get caught up in the minor radiative differences of different gases. Sure they can be measured in the laboratory, and may even matter in some industrial processes, but they don’t make any meaningful difference in the energy balance of the atmosphere.”
The exact opposite is the case. Imagine a body such as the moon with an argon atmosphere at 1000 bar pressure. Incoming radiation would pass straight through as there are no energy level changes that argon can make to absorb photons. The ground would heat up and emit in the IR region. All this radiation would pass straight through the argon atmosphere as there is no mechanism for argon to absorb this radiation. The surface of the moon would be the same as it is now, with no atmosphere. The atmosphere would make no difference to the temperature of the surface of the moon, and the atmospheric pressure does not matter.
If you think it would make a difference, please explain how this would occur.
If not, then you must accept that the properties if the gas in the atmosphere make a huge difference to the surface temperature.
From there we are just arguing details.
seaice1 – So, why is the Earth’s core at 6000 C? Simply residual heat from the magma ball? Or does compression lead to atoms sharing a tighter space, therefore interacting more, therefore having a greater vibration? Isn’t molecular vibration heat?
myNym. From Scientific American:
“There are three main sources of heat in the deep earth: (1) heat from when the planet formed and accreted, which has not yet been lost; (2) frictional heating, caused by denser core material sinking to the center of the planet; and (3) heat from the decay of radioactive elements”
You will notice that pressure is not one of the reasons.
Why are the interior of the gas giants all hot? How does a collapsing cloud of atomic hydrogen get hot enough to fuse?
I may or may not agree with some of Scientific American’s publishings. Thank you seacice1 for your citation. I will ask, for your own future edification, what you think happens when two molecules are pressed too close to each other. Do the protons get excited? Do they not vibrate? Is not molecular vibration, in the aggregate, what we call heat?
seaice1
January 26, 2017 at 7:01 am
If Venus were hot because of the GHE, then so too would be Mars. Both have atmospheres of 95-96% CO2. The difference is that Venus’ atmosphere is dense and massive, while Mars’ is thin and wispy.
“where there is causation there is always correlation”
Wrong.
As usual.
And from RSS
2016… 0.559
1998… 0.550
HUGE difference !
“it wouldn’t be unprecedented and we actually had more frequent record breaking at a time when atmospheric CO2 levels were in the range of 305-310 ppmv”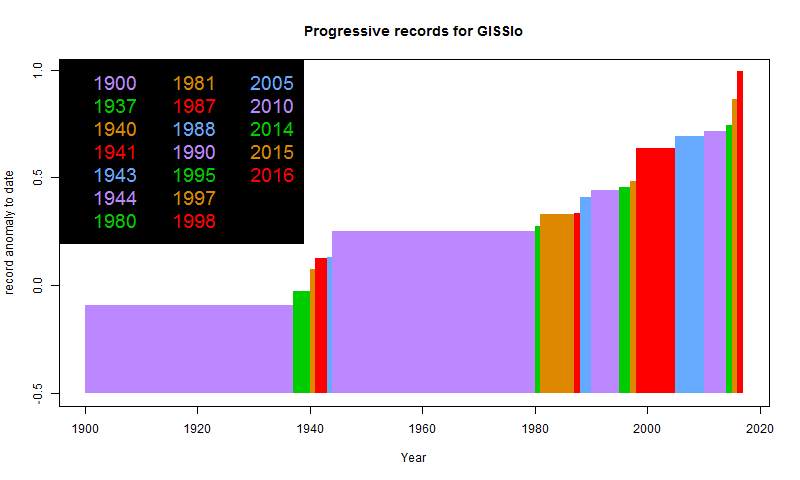
Well, they weren’t doing it annually. And the rise wasn’t as steep. Here is the history of GISS record setting.
SkepSci doesn’t have temperatures “doing it annually” either.
The climb can stop at any time unless there is absolute proof CO2 “causes” this and there is not. A trend line is not reality—a trend line going up is just that, a line with an upward slope. There is no rule that once records are being broken that must continue or the trend must continue upward. There was a downward trend going into the LIA. Yet the trend changed. Means nothing.
Three or 30 records in a row mean only there are three or 30 records in a row. People simply refuse to believe that a record or trend is not some magical prediction tool. I guess they have to “believe” no matter what.
Theory says temperatures will rise with CO2. Temperatures rise. Sheri says that people have to believe “no matter what”. Evidence in line with prediction is not “no matter what”, it is exactly the sort of supporting evidence that should strengthen your belief.
Sheri, the prediction of rising temperatures did not come from extrapolating the ine but from a physical theory if climate. I know many people here prefer to simply look at the past data and find patterns in the past to predict the future, but that is not the way the scientists do it.
@seaice1, Figure 3a from Hansen et al., 1988 with GISTEMP annual average temperature anomaly. GISTEMP tracked scenario C for 50 years and then spiked up to Scenario B during the recent El Niño. Scenario A accurately forecast the rise in CO2.[/caption]
 Figure 3b, Hansen’s 5-yr average temperature anomaly extrapolated to 2060 with GISTEMP 5-yr overlay. Any more questions?[/caption]
Theory says that a stabilization of atmospheric greenhouse gases at there 2000 levels would lead to the Scenario C (bottom) 5-yr avg temperature curve…
[caption id="attachment_162665" align="alignnone" width="1280"]
[caption id="attachment_162666" align="alignnone" width="1280"]
The evolution of atmospheric greenhouse gases since 1988 had followed a tragectory just below Scenario A (too curve), with CO2 almost exactly following A.
David, you are using a paper from 1988, which as you show is remarkably close to what has happened. You are using CO2 only and ignoring the total forcing, which was closer to scenario B. The red line is now very close to the appropriate projection. Thank you for providing supporting evidence.
Anyway, we know Hansen’s estimate of sensitivity was too high, so we wold expect this paper from 1988 to not be entirely accurate.
seaice1: The “proof” of theory came from extrapolating the line. The “physical theory” was done in a black box, not in the real world. The models are not in the real world, either. There is virtually nothing in global warming that is in the real world. The only thing we know is CO2 raises temperatures in a black box and we extrapolated from there. People messed with forcings and feedbacks until CO2 became the boogeyman that was desired. There simply is no proof of the theory. I’m not sure there can be—there’s so little real data and measurable factors it’s probably not actually provable at any reasonable level of confidence (excluding the made-up levels of the IPCC which also have no basis in reality).
As for evidence that “strengthens my belief”, I need at 95% REAL data, not extrapolated, much more evidence of how the climate works, and more evidence that politics are not the driving force of this theory. This is garbage science. That’s why you have to BELIEVE, not really understand.
If finding patterns in the past to prove the future isn’t how it’s done, why are MILLIONS wasted on doing just that? You are totally clueless. MILLIONS for something you claim is irrelevant.
Sheri, I did not say it was irrelevant. I said that was not how science was done. Patterns and cycles are significant, but scientists attempt to explain them, not just extrapolate them.
http://images.freeimages.com/images/premium/previews/1845/18451950-chicken-little-the-sky-is-falling.jpg
However, the history shows your statement And the rise wasn’t as steep. may not be entirely correct (although I do accept that 2016 is stark, but it will be interesting to see what happens to 2017, and whether 2017 breaks the upward trend of the last 3 years). .
Look at the steepness of the rise between ~1938 and ~1942.
And of course, you have to bear in mind the 1940s have been cooled, and the most recent data warmed. May be justified, may be not. Unfortunately, I do not consider that one can have reasonable confidence in GISS.
Forrest, can you be a little clearer please. Climate is “average weather”, usually 30 years is said to be “climate” rather than weather. When you say the climate 30 years ago compared to the climate now, what do you mean exactly? Do you mean the weather 30 years ago vs the weather now, or the average weather from 60-30 years ago vs the average of 30 years ago to present day? Or some other measure?
Without checking, my punt would be north pole.
And what makes you think that the data are independent? Somehow the world’s climate knows it’s January 1st and resets?
Whatever caused a record in one year can be causing a record the following year. Climate isn’t sports.
So you would expect more records once a condition is established to produce the first record. And let’s face it, your sample is so small, it is meaningless anyway – unless you can show that your sample is representative of all the possible anomalies we could have.
OK. The climate today is cold. The climate 30 years ago was colder. The climate has changed.
Sorry Forrest, but you refused to say what you meant by “climate”, so my statement is entirely within the bounds you set. the climate at the north pole is warmer than it was 30 years ago. If you want to be more specific then you must say what you mean by climate. Otherwise I have just beaten your challenge.
“that is one of the most ludicrous things ever posted on these pages. ” Quite an accolade against some very stiff competition.
NOAA has claimed, that for land and ocean surfaces combined:-
(1) The annual global temperature for the January-to-December calendar year 1907 is 0.50°C below 16.5°C, of which 16.5°C is the average global temperature for the thirty calendar years from 1961 to 1990, such that annual global temperature for 1907 is 16°C, which is the lowest annual global temperature for any calendar year from 1900 to 1997.
http://www.ncdc.noaa.gov/oa/climate/research/1997/climate97.html
(2) The annual global temperature for the January-to-December calendar year 2016 is 0.94°C above 13.9°C, of which 13.9°C is the 20th century average global temperature for the one-hundred calendar years from 1901 to 2000, such that the annual global temperature for 2016 is 14.84°C, which is the highest annual global temperature for any calendar year from 1880 to 2016.
https://www.ncdc.noaa.gov/sotc/global/201613
Therefore is it the case (?), that the calendar year, which has the lowest annual global temperature from 1900 to 1997, has a higher annual global temperature than the calendar year, which has the highest annual global temperature from 1880 to 2016.
Alternative link for (1).
https://web.archive.org/web/19980524120019/http://www.ncdc.noaa.gov/ol/climate/research/1997/climate97.html
Nick, are those goal posts moving right there?
To “ossqss”
I’m not sure, that I undertand your question. But, of this I am quite sure:- Nobody has ever measured the ”global temperature” of the earth. Nobody as even come close to measuring the “global temperature” of the earth.
http://data.giss.nasa.gov/gistemp/abs_temp.html
Therefore, anyone can can claim, that the “global temperature” of the earth is whatever they want it to be without the slightest fear of refutation, provided only, that what they claim for the ”global temperature” of the earth is neither ridiculously hot nor ridiculously cold. This applies whether or not “global temperatures” are presented as “absolute” temperatures, or as temperature “anomalies”.
As regards 1907 and 2016, nobody can actually prove, that (A) the “global temperature” for 1907 is not 16°C, and (B) the “global temperature” for 2016 is not 14.84°C. Therefore, (A*) the “global temperature” for 1907 might be 16°C, and (B*) the ”global temperature” for 2016 might be 14.84°C. Therefore, the “global temperature” for 1907 might be 1.16°C higher than the ”global temperature” for 2016.
Nick: I fail to understand why you post numbers from NASA listing the GAT, then turn right around and say no one can calculate the GAT. I do understand how NASA says it gets the anomalies and it’s what you explained in a previous thread. Yet, NASA, the IPCC and many others reference the GAT.
As far as calculating the GAT, why wouldn’t it be an average, as the name implies. Sure, you have to perhaps weight and grid and decide time of day, etc, but it seems it would indeed be possible to calculate. The problem is not calculating, it seems, but rather does it have meaning, just as do the anomalies have meaning. The answer appears to be “no”.
“Nobody has ever measured the ”global temperature” of the earth.”
Nobody has ever measured the ”global temperature” of your body either, but that doesn’t mean you can’t get an overall indication (fairly accurate one too) from shoving a thermometer up you behind. Doesn’t get the temperature of you fingers and toes quite right but that doesn’t stop it being a useful measure.
“tony mcleod January 25, 2017 at 2:56 pm”
That’s one of the dumbest posts you have made. Remind us again how temperature is measured globally?
By asking the Earth to bend over of course.
tony mcleod: No one ever had any reason to measure the “global temperature” of your body. There’s no funding in it, no chicken little hysterics, nothing. Pretty much informed people realize that temperatures taken at different locations on the body result in different values so one must be clear where the temperature was taken. There’s also a range from 97° to around 99°F for human temps, a fairly wide range that few get excited about. Not everyone is at the perfect 98.6°F. Unlike other areas that study temperatures and their averages and changes, variation is considered normal.
All true sheri, but that doesn’t mean its not useful. Average bodily temperature along with average tropospheric surface temp or oceanic heat content all have margins of error. But they can all be instructive – particularly if unexpected anomalies appear.
And those can also be misleading to most all untrained observers Tony. You don’t treat a tooth infection, when you have a stomach virus, the same way. It could be costly and sometimes fatal.
To Tony mcleod, January 25, 2017 at 2:56 pm.
Please prove which of the following two claims is true, and which is not true:-
(1) The annual global temperature for the January-to-December calendar year 1907 is 0.50°C below 16.5°C, of which 16.5°C is the average global temperature for the thirty calendar years from 1961 to 1990, such that annual global temperature for 1907 is 16°C, which is the lowest annual global temperature for any calendar year from 1900 to 1997.
http://www.ncdc.noaa.gov/oa/climate/research/1997/climate97.html
(2) The annual global temperature for the January-to-December calendar year 2016 is 0.94°C above 13.9°C, of which 13.9°C is the 20th century average global temperature for the one-hundred calendar years from 1901 to 2000, such that the annual global temperature for 2016 is 14.84°C, which is the highest annual global temperature for any calendar year from 1880 to 2016.
https://www.ncdc.noaa.gov/sotc/global/201613
My challenge to anyone who is interested in the topic is to prove which of these claims is true and which is not true. So far, nobody has proved which of them is true and which is not true. While this remains the case, nobody has the foggiest idea of which are the “coldest” and “hottest” years on record since 1880.
“tony mcleod January 25, 2017 at 5:47 pm
By asking the Earth to bend over of course.”
And that is where you extract your “science” from.
Tony McLeod: As I have said many times on comments, the Global Average Temperature is about as much use as knowing what the Global Average Lottery Numbers are. Except that the GALN would at least be a more accurate calculation than GAT – even if still absolutely useless.
Saying it lots of times doesn’t make it right Harry.
I get it though. If you can’t have a global temperature how can you tell it’s rising. That’s where your going with it isn’t it?
Can I ask you this: is average temperature useful at any scale? If so what?
Temperature anomalies.
In January 2001, NasaGistemp claimed, that the global temperature anomaly for January 1880 is +0.26°C.
https://web.archive.org/web/20010126234100/http://www.giss.nasa.gov/data/update/gistemp/GLB.Ts.txt
In January 2017, NasaGisTemp cllaimed, that the global temperature anomaly for January 1880 is -0.90°C.
https://web.archive.org/web/20170119061448/https://data.giss.nasa.gov/gistemp/tabledata_v3/GLB.Ts.txt
Which of these two claims is closer to the mark?
Nick—agreed, I think. No one knows what the hottest year is. That’s the point.
Re: tony mcleod January 26, 2017 at 2:19 am
“Saying it lots of times doesn’t make it right”
But, isn’t that all you’ve got?
“Saying it lots of times doesn’t make it right Harry.”
But that’s exactly the strategy your lot uses, isn’t it?
Despite the increasing evidence that it is flat out wrong.
I have always argued that using “anomalies” from a moving 30-year average base was sooner or later going to end up with a situation where this sort of mess would happen. I am sure there is an explanation but meantime can we stop tinkering with temperature figures and cherry-picking dates, times, places, and data in order to “prove” something that ain’t so.
“Scientists” may be making a killing and econutters maybe getting a nice warm feeling about all this but real human beings are suffering while the catastrophists play games with their lives.
Let us hope that Trump’s ideas catch on elsewhere. And soon.
SkS reckons the current climate debate is a nerve-jinglingly tight affair, with their side just nicking the Myth or Truth arguments by a narrow 193-0 scoreline. Must be true then!
From the article: “According to Nasa, in 2016 the Earth’s surface temperature shattered the previous record for hottest year by 0.12°C. That record was set in 2015, which broke the previous record by 0.13°C. That record had been set in 2014, beating out 2010, which in turn had broken the previous record set in 2005.”
Wrong. Look at the satellite chart below and tell me if anything in the above paragraph appears to be true, other than 2016 being the hottest year. All the rest of the years named are “also-rans” who don’t come close to being as hot as 1998. 2016 is one-tenth of a degree hotter than 1998, a statistical tie. So all that “hottest year evah!” bs, is just that. Is 2015 hotter than 1998, according to this chart? No. Is 2014 hotter than 1998? No. Is 2010 hotter than 1998? No. Is 2005 hotter than 1998? No. As you can see: BS (bad science).
http://www.drroyspencer.com/wp-content/uploads/UAH_LT_1979_thru_December_2016_v6.jpg
From the article: If you think that seems like a lot of record-breaking hot years, you’re right. The streak of three consecutive record hot years is unprecedented since measurements began in 1880.”
Except the real temperature profile doesn’t reflect that the last three years were three consecutive record hot years. That’s a lie perpetrated by the “Hockey stick” chart. The real chart, the satellite chart doesn’t show anything like what is claimed. How many consecutive hot years were there from 1910 to 1940? There is no comparison between the decade of the 1930’s versus the 21st Century. The 1930’s was much hotter, and for an entire decade it went on. See any dustbowls around here now in 2016?
From the article: “In the 35 years between 1945 and 1979, there were no record-breakers.”
That would be because the Earth was in a significant temperature downtrend at that time. Uptrend = 1910 to 1940; downtrend – 1940 to 1975; uptrend from 1975 to 2016.
From the article: “In the 37 years since 1980, there have been 12.”
Only according to the bastardized, bogus “Hockey stick” chart. The satellite chart tells a completely different story.
end excerpt
Such hyperbole about a few hundreths of a degree Celcius! And no comment about El Niño events!
I recently spoke to my local Rebus (Senior Citizens) Club and showed the NZ temperature record for the last century or so as produced by NIWA (National Institute of Water and Atmospheric Studies), both adjusted and raw (and not claimed to be “official”). I showed it as temperatures (rather than anomalies). Both graphs trickle up from around 12ºC to around 13ºC. The trend, depending on how adjustments are calculated (and who by!), is from around 0.5º to nearly 1ºC per century.
I pointed out that to give that some perspective, the temperature on the day I spoke would likely vary by between 10º and 15ºC (it’s summer in New Zealand and the weather in our area is appalling!)
So you intentionally muddied the waters by conflating weather and climate?
What you could have said: “Who remembers Ronald Reagan? He was still president back in February 1985. Since then the average monthly global temperature has been above average the 20th century average. 375 months in a row……… not one cooler than the average.”
If you really wanted to compare that with the daily weather you might have said: “Imagine 365 days in a row…… where every single day is above average.
The new normal for climate is steadily warmer. For weather its still going to be up and down a bit.
“The new normal”? Weasel words in my book.
I’d probably cop “cliche”. But weasel words, in my book, are what Gary said to his Senior Citizens.
“tony mcleod January 25, 2017 at 2:18 pm
So you intentionally muddied the waters by conflating weather and climate?”
And climate is the average of 30 years of weather, so it’s totally made up.
climate
ˈklʌɪmət
noun
the weather conditions prevailing in an area in general or over a long period.
Totally made up?
You can obviously see the point I was making about conflating day to day weather temperatures with “conditions prevailing in an area in general or over a long period”. So what it your point?
Right, climate is a statistics of long term weather at a location.
If for the last 20 years a place has an average of 150 cloudy days a year for instance, and if it starts changing to 175 days a years after 3 or 4 or 10, you might be seeing something more than weather.
The step, happened in 1 or 2 year, is that weather or climate?
tony, what would you say is different between the Earth’s climate today and the climate about 500 million years ago?
(For the new reader, the Arctic Ocean was once a swamp, and CO2 used to be around 8000 ppm.)
micro6500
Right, climate is a statistics of long term weather at a location….
The step, happened in 1 or 2 year, is that weather or climate?
All you’ve got is statistical analysis: the odds that a change in conditions is unusual. Not just in severity but in rapidity too. So a small change in 2 years may be less significant that a severe change of 10 because rapidity is not universal. A doubling of rainfall in 2 years may not be unusual at all, but 1C increase (or decrease) in 100 might be a total outlier and weird.
To answer your question – more information, please.
The step in gat in 98-99 at the end of the 97 El Nino.
“tony mcleod January 25, 2017 at 5:53 pm”
According to “climate scientists” and the IPCC, “climate” is the AVERAGE of weather over 30 years. How do you calculate (Make up) an average? It’s a simple maths calculation, it’s not a measurement, it is totally made up and meaningless.
I will give you an example, Australia. Our weather “authority”, the BoM, uses 112 stations to calculate (Make up) a national average temperature (A made up number and adjusted). That is 1 device for every ~68,500 square kilometers and a lot of those are in urban areas or airports. Totally made up and meaningless. The airport here in Sydney is often reported in the MSM when it reads high, always quoted as “hottest evah since records began”. My issue with these sorts of statements is that Sydney didn’t have an airport when records began in 1910.
Patrick MJD
How do you calculate (Make up) an average? It’s a simple maths calculation, it’s not a measurement, it is totally made up and meaningless.
Splitting hairs Patrick.
Meaningless? Calculating averages isn’t meaningless. My average annual rainfall is about 1800mm. Last year I only got 1000. That difference of 800mm has quite a profound meaning to me, even though it is “totally made up”.
If you don’t like “maths calculations”, then call them something else.
“tony mcleod January 25, 2017 at 11:10 pm
Meaningless? Calculating averages isn’t meaningless.”
Temperature, we’re talking temperature not rainfall, typical deflection of an alarmist. Calculating an average temperature without all other factors that do affect Tmin and Tmax such as wind direction is, completely meaningless on a global scale.
Ok Patrick, when it comes to average temperature I’m going to just disagree with you as to whether it’s meaningful or not.
Average temperature, if it could indeed be accurately measured, could be of some value.
The average temperature of Earth is not yet accurately being measured.
The proof of that is that in 1998 and 2016 the Glow Bull Average Temperature was said to have spiked. But El Ninos do not increase the temperature of the Earth. They redistribute energy trapped in warm water in the Southeast.
When we have a truly accurate Glow Bull Average Temperature, El Ninos will not affect it.
“myNym January 26, 2017 at 1:04 am
The average temperature of Earth is not yet accurately being measured.”
An average temperature CANNOT be MEASURED! It’s a calculation based on a dataset of numbers! In fact “temperature”, whatever device is used, is a proxy/calculation, not a measure.
“tony mcleod January 25, 2017 at 11:58 pm”
You may disagree, but you clearly demonstrate no understanding at all.
myNym, the temperatures that spiked were atmospheric. Heat was moved from ocean to atmosphere, causing temperature of atmosphere to spike. Glow Bull average temperatures do not include the water in the oceans, so your conclusion is invalid.
Patrick, I have no issue with your position. A key word in my post was “if” an average could be measured.
seaice1, I specifically referred to the average temperature of the Earth, not the Earth’s surface. We can’t accurately measure the temperature of the Earth’s surface, let alone the temperatures (warm or cold) in the oceans. Estimates of how much heat reaches the Earth’s surface from below varies widely.
myNym
The average temperature of the Earth is thousands of degrees centigrade. The center of the Earth is very hot. What you are talking about has almost nothing to do with climate.
If the Earth is warming, it is warming. If it isn’t, it isn’t.
The Earth was once a glowing hot ball of magma. It has been cooling since.
“Three blind men walk up to an elephant.” You know the rest of the story. We cannot, today, accurately measure much about the “warming” of the Earth. Bottom line, it isn’t warming. It can’t. If it could, it already would have.
Bob’s, perhaps. But what was going on before the Little Ice Age?
What was going on during the Medieval, Roman, and Minoan warming periods? What was the cause of the Holocene Optimum? What was the cause of the Holocene? The Eemian?
The Earth has been in an ice age for the last 2.6 million years. You aren’t even focusing on the elephant’s trunk, or tail, or ear. You’re focusing on a dung-beetle enjoying the residual warmth of an elephant dropping. Grow up. Move on. Man Made Glow Bull Warming is dead.
Sorry, last post dropped in the wrong spot. Mods, feel free to nuke it (and this).
So it’s a bit clearer micro6500, if you’re talking about an El nino then I suppose you’d say that is weather event in that it affects my weather this year but not the next. But if you are talking about the background rise, whether that is a straight line of jumps like this
…that’s getting on to a 40 year phenomenon so I would say climate.
OK, Tony Mcleod, you got me. No arguing with your stats. So, tell me (warning: Oldest question in the book coming up): What should the climate be like such that it would not cause you any alarm? What should GAT be? And should it be constant?
Trenberth, seriously? The guy who said warming is hiding in the deep oceans, that Trenberth? The same Trenberth who used MODELS to “predict” his heat, that is now gone missing? You are too funny Tony.
Should is a funny way or putting it. I’ll assume you don’t mean for me personally but for the biosphere and humans in particular.
What should the climate be like such that it would not cause you any alarm? Not changing too quickly. I think 2-3C in 100 years is geologically very rapid and will probably not end well.
A nice steady holocene would do me, right where it has been since our ancestors were hunting mega-fauna. Yeah there have been a couple of minor ups and downs but its generally been a pretty benign climate for our species.
What should GAT be? And should it be constant? Benign and no. It’s just a pity humans are not wise enough to have edged CO2 levels up from 280 up to say 295 over about 200 years. That might have been just enough to counter the very slow decline in temperature we would expect as the holocene inter-glacial wound down.
That would have taken a lot of finesse with close monitoring over decades. Clobbering a delicate, unpredictable, chaotic system by indiscriminately dumping 30Gt into the air the way we are doing is IMO asking for trouble.
Bob’s isn’t it?
Bob’s, perhaps. But what was going on before the Little Ice Age?
What was going on during the Medieval, Roman, and Minoan warming periods? What was the cause of the Holocene Optimum? What was the cause of the Holocene? The Eemian?
The Earth has been in an ice age for the last 2.6 million years. You aren’t even focusing on the elephant’s trunk, or tail, or ear. You’re focusing on a dung-beetle enjoying the residual warmth of an elephant dropping. Grow up. Move on. Man Made Glow Bull Warming is dead.
If we didn’t have a warming climate, the Seattle, Chicago, and Boston areas would still have a mile of ice overhead, crushing and pulverizing everything to bedrock.
No one ‘denies’ climate changes.
No one can deny that a warming climate has benefited the propagation and proliferation of plant and animal life across the north American continent, as the continent spanning glaciers receded.
No one can deny that the receding glaciers were and are a natural result of the climate warming.
The climate warming trend will continue until the cycle reverses, naturally.
If they keep upping the ante by 0.12 deg for eight years, that will be a whole degree. By that time, their adjustments will have to be so blatant that even their friends will blush. Actually I think we already should have passed that point but some folks were too dense to notice.
I would really really like it if President Trump would get someone to investigate the adjustments. Like how do they explain why they aren’t adjusting present temperatures down to compensate for UHI?
I very done a lot of this already, just follow my name.
All of the data is stored at the sourceforge.net url listed in the first page
“completely independent analysis using a different methodology.”
Wasn’t the Berkeley Earth project more or less that?
seaice1 on January 26, 2017 at 2:22 am
“completely independent analysis using a different methodology.”
Wasn’t the Berkeley Earth project more or less that?
Yes seaice1, it is exactly that. Because they really use different methodologies.
Doubting about that is the privilege of persons lacking both the knowledge to understand what they do and the courage and perspicacity necessary to increase their knowledge by learning.
Decades ago I played with great pleasure on flippers in night cafés, and remember the sentence “It’s more fun to compete”. At WUWT one rather thinks “It’s more easy to pretend”.
Maybe you spend some little time at
http://berkeleyearth.org/methodology/
and e.g. in reading, among others, the paper
“Berkeley Earth Temperature Averaging Process”
static.berkeleyearth.org/papers/Methods-GIGS-1-103.pdf
What now concerns these incredibly pretentious claims à la
a simple look at
http://berkeleyearth.lbl.gov/city-list/
from where you go to any region, e.g.
http://berkeleyearth.lbl.gov/regions/australia
or to any town in the world should convince persons having a sound intellect that the quoted claim is simply bare nonsense, endless repeated by persons lacking just that.
Thank you for the links and info, Bindidon