Global Temperature Report: December 2016

Global climate trend since Nov. 16, 1978: +0.12 C per decade
December temperatures (preliminary)
Global composite temp.: +0.24 C (about 0.43 degrees Fahrenheit) above 30-year average for December.
Northern Hemisphere: +0.19 C (about 0.34 degrees Fahrenheit) above 30-year average for December.
Southern Hemisphere: +0.30 C (about 0.54 degrees Fahrenheit) above 30-year average for December.
Tropics: +0.21 C (about 0.38 degrees Fahrenheit) above 30-year average for December.

November temperatures (revised):
Global Composite: +0.45 C above 30-year average
Northern Hemisphere: +0.49 C above 30-year average
Southern Hemisphere: +0.50 C above 30-year average
Tropics: +0.37 C above 30-year average
(All temperature anomalies are based on a 30-year average (1981-2010) for the month reported.)
Notes on data released Jan. 3, 2017:
Globally, 2016 edged out 1998 by +0.02 C to become the warmest year in the 38-year satellite temperature record, according to Dr. John Christy, director of the Earth System Science Center at The University of Alabama in Huntsville. Because the margin of error is about 0.10 C, this would technically be a statistical tie, with a higher probability that 2016 was warmer than 1998. The main difference was the extra warmth in the Northern Hemisphere in 2016 compared to 1998.
Year GL NH SH TROP
2016 +0.505 +0.61 +0.40 +0.61 C
1998 +0.484 +0.51 +0.46 +0.68 C
“The question is, does 2016’s record warmth mean anything scientifically?” Christy said. “I suppose the answer is, not really.”
Both 1998 and 2016 are anomalies, outliers, and in both cases we have an easily identifiable cause for that anomaly: A powerful El Niño Pacific Ocean warming event.

While El Niños are natural climatic events, they also are transient. In the study of climate, we are more concerned with accurately identifying long-term temperature trends than we are with short-term spikes and dips, especially when those spikes and dips have easily identified natural causes.
“Some records catch our attention because we usually struggle to cope with rare events. For example, the Sept.-Nov. record heat and dryness in the southeastern U.S. (now a thing of the past) will be remembered more than the probability that 2016 edged 1998 in global temperatures. So, from the long-term perspective, 2016’s record may be less noteworthy than where the month-to-month temperature settles out between warming and cooling events.”
Compared to seasonal norms, the warmest average temperature anomaly on Earth in December was in south central China, near the town of Qamdo. December temperatures there averaged 3.91 C (about 7.04 degrees F) warmer than seasonal norms. Compared to seasonal norms, the coolest average temperature on Earth in December was near the town of Buffalo Narrows in west central Saskatchewan. December temperatures there averaged 4.13 C (about 7.43 degrees F) cooler than seasonal norms.
The December 2016 GTR includes the global temperature anomaly map for the month and the month-by-month graph of global temperature anomalies for the duration of the satellite temperature dataset. It also includes a global map of the 2016 temperature anomalies, and a global map of the regional climate trends from December 1978 through December 2016.

A paper with the scientific explanations of changes made in creating version 6.0 of the satellite troposphere dataset has been accepted for publication in the Asia-Pacific Journal of Atmospheric Science. The complete version 6 lower troposphere dataset is available here:
http://www.nsstc.uah.edu/data/msu/v6.0/tlt/uahncdc_lt_6.0.txt
Archived color maps of local temperature anomalies are available on-line at:
As part of an ongoing joint project between UAHuntsville, NOAA and NASA, Christy and Dr. Roy Spencer, an ESSC principal scientist, use data gathered by advanced microwave sounding units on NOAA and NASA satellites to get accurate temperature readings for almost all regions of the Earth. This includes remote desert, ocean and rain forest areas where reliable climate data are not otherwise available.
The satellite-based instruments measure the temperature of the atmosphere from the surface up to an altitude of about eight kilometers above sea level. Once the monthly temperature data are collected and processed, they are placed in a “public” computer file for immediate access by atmospheric scientists in the U.S. and abroad.
Neither Christy nor Spencer receives any research support or funding from oil, coal or industrial companies or organizations, or from any private or special interest groups. All of their climate research funding comes from federal and state grants or contracts.
— 30 —
I asked earlier, “Why aren’t the same notions that theorize how the MWP was regional applied to the current warming claims?”
I went looking for an answer and stumbled across something interesting.
When it suited Skeptical Science to discount the sun as being responsible for the MWP…
https://skepticalscience.com/print.php?n=688
“Overall during the MWP, there was little change in TSI.”
vs.
When it suited Skeptical Science to blame the sun for the MWP………..
https://www.skepticalscience.com/medieval-warm-period.htm
“the Medieval Warm Period occurred during a time which had higher than average solar radiation”
From what I have gathered from googling graphs of TSI reconstruction the MWP and RWP appear to have similar TSIs.
If SS can play opposite sun positions when it suits them are they doing the same thing with the MWP being regional and the RWP not?
“When it suited Skeptical Science to discount the sun as being responsible for the MWP…”
It makes a difference if you quote it properly:
“Overall during the MWP, there was little change in TSI. However, it did increase approximately 0.2 W/m2 from in the years leading up to 1000 AD. This would correspond to a 0.04°C increase in global surface temperature, or perhaps as much as 0.05°C in land surface temperature, as reconstructed through proxy measurements like Figure 3. Thus TSI appears not to have played a particularly large role in the MWP, accounting for perhaps 10-20% of its peak warming.”
Quite different if you don’t chop it short. And not at all inconsistent.
Christy is correct.
“Because the margin of error is about 0.10 C, this would technically be a statistical tie”
You cannot claim more accuracy than your margin of error.
This would be clear in any science other than the climate pseudoscience.
If I handed in a lab report at university with a margin of error of a tenth of a degree yet claimed an accuracy to one hundredth a degree I would get an embarrassing fail
You cherry picked. The first SS link clearly diminishes the sun role and yet blames the sun for the MWP in the second link.
“It has now become clear to scientists that the Medieval Warm Period occurred during a time which had higher than average solar radiation and less volcanic activity (both resulting in warming).
However, you’re avoiding my central question.
Why aren’t the same notions that theorize how the MWP was regional applied to the current warming claims?
Given the selective malleability with using reconstructions to wash away MWP as global or hemispheric
the current warming with hard data is even easier to attribute to being regional or hemispheric events.
Why are their two standards?
Convenient flexibility with the MWP assumptions and then a far more rigid stance on the Recent Warming Period being global?
“You cherry picked.”
I cherry picked??? You chose the quote. I just showed what it said if you didn’t just pluck out one sentence.
Whew! Heat wave! 0.044F ‘hotter’ than 1998!
I turned my thermostat down 0.044F here, south of Seattle WA……. no point in using more natural gas or firewood than necessary!
It was 76F to 90F on the west shore of Kauai from Dec 20 to Dec 27, a week ago. The temp range here south of Seattle today was 18F to 32F. (sigh) I’ll never get the hang of this Global Warming thing….
I turned my thermostat down 0.044F here, south of Seattle WA
Oh dear, not another person who thinks that a thermostat controls heat output….:)
It can if it is a variable stage or modulating output unit.
Reblogged this on Climate Collections and commented:
2016, an El Niño year, edges 1998, another El Niño year by 0.02C as the warmest year in the satellite era. Dr. Roy Spencer calls it statistically insignificant. http://www.drroyspencer.com/2017/01/global-satellites-2016-not-statistically-warmer-than-1998/
RSS and UAH satellites show 2016 was nowhere near as warm as 2010 and 1998. See my website
http://scientificqa.blogspot.co.uk
Both UAH and RSS show 2010 and 1998 warmer. than 1998 Terri Jackson http;//scientificqa.blogspot.co.uk
Terri
On Tue, Jan 3, 2017 at 10:23 PM, Watts Up With That? wrote:
> Anthony Watts posted: “Global Temperature Report: December 2016 Global > climate trend since Nov. 16, 1978: +0.12 C per decade December temperatures > (preliminary) Global composite temp.: +0.24 C (about 0.43 degrees > Fahrenheit) above 30-year average for December. Norther” >
“Both UAH and RSS show 2010 and 1998 [I think you mean 2016] warmer. than 1998 Terri Jackson http;//scientificqa.blogspot.co.uk ”
Neither UAH or RSS show 2010 as being warmer than 1998. The only period in the satellite temperature record that is hotter than the hottest point of 1998, is Feb. 2016, when it was exceeded by one-tenth of a degree. The current temperature is below the 1998 high.
http://www.drroyspencer.com/wp-content/uploads/UAH_LT_1979_thru_December_2016_v6.jpg
When I studied physics we were taught not to leave hundredth digits in the result if margin of error was in tenth. How on earth do they speak of +0.61? It should be +0.6!
Yes and at my university too.
This whole discussion is like how many fairies can dance on a pin.
Likewise in earning my Chemistry degree. Moreover, I was required to lay out the entire mathematics of determining the final margin of error in the reported results. The type of error analysis (or lack thereof) I see offered regularly in climate studies would have resulted in the person being dropped from the chemistry program. In my day they would have become biology majors because at that time it consisted mostly of memorizing names of parts and was not as technically oriented as it is today.
Professional publications I regularly see error bars that exceed the stated precision, It comes from not throwing away data. So for example if I look up an atomic mass or the universal constant G I get something like: G=6.67408(31)x10^{-11} m^{3} kg^{-1} s^{-2}
That (31) is standard notation for error, and indicates that the estimated error bars on the last two digits listed are +/- 31. Listing only the thought to be correct digits would throw away the last two decimal places and lose data.
So – I look at that 78 to 2016 global monthly anomaly chart and it seems to me the right hand half of it is overwhelmingly warm anomalies….
As would be expected for the warm half of the PDO and AMO.
So, what would you expect from a general warming trend? Cooling?
It never ceases to amaze me the media crows “warmest (decade, year, month, day) ever!” as if it was a surprise. Doesn’t the paleo record pretty much tell us that, in general, temperatures have been rising for something like 10,000 years?
It would be a surprise if 2017 wasn’t warmer than 2016. A decade of cooling would likely return us to the “new ice age” scare of the 70’s.
Well no B. It’s been steadily dropping for thousands of years – since the holocene max.
http://southwind.com.au/wp-content/uploads/2013/03/286Marcott-Temp1.jpg
Given that overarching trend line and recent solar waning on top, you’d expect it would be cooling wouldn’t you? That would make a blue water Arctic later this year (it’s rarely been like that for 2.5 million years) a real black swan.
southwind.com.au/wp-content/uploads/2013/03/286Marcott-Temp1.jpg
No Tony, I wouldn’t expect it to be cooling, nor would I consider a “rapid” 0.5C rise in the past 100 years in any way significant.
You may ask “why?” Well, simply because over a longer millennial scale, the climate is still in a warming trend and the temporal resolution of climate records in that time frame would not detect an event that occurred over the course of 150 years.
So your “hockey stick” graph is a statistical artifact; the reult of improved instrument resolution, nothing more.
You know the irony of this entire fiasco Tony? Real scientists and engineers gave you these tools. Thermometers, satellites, rain gauges, CO2 detectors. Clocks. We did that. For you.
Now we get to watch while you use those tools to terrify the general population. If I could take them back from you I would.
Last but not least Tony, what did you really use to measure temperatures 5000 years ago? 10,000? 1000?
You have a fake science graph showing temperature in 0.1C resolution. Who do you think you’re fooling?
And you quote Marcotte. If he were dead he’d likely be spinning.
Tony, my old Dad had a saying, “Always engage your brain before engaging your mouth”.
Try it. It may come in useful? You have a fundamental measurement problem in your alarmist fantasies. The Thermometer was invented by some German dude back in the 1700’s. Got that part? You’ve got an instrument history that spans an entire 400 years and it’s only been reliable for the past 70 or so.
You know exactly didly about the Earth’s climate. Almost nothing. Call us all back when you have a clue.
you can google for the adjustments applied to RSS and UAH temp series…
There are quite a lot of them, but adjustments on the satellite temp data are OK, aren’t they?
Poor Griff, he’s still trying to convince himself that all adjustments are equal.
What happened to the great “Global temperatures have plummeted” everyone was celebrating last year despite the lack of evidence? Cold winters in the US? Arctic ice within normal limits? Antarctic expanding? Lack of wild weather?
Shome Mishtake Shurley ?
I thought everyone was convinced all these measurements and observations were a scam having been ‘adjusted’?
Are we now saying the world is indeed warming ?
Gareth wrote: “What happened to the great “Global temperatures have plummeted” everyone was celebrating last year despite the lack of evidence?”
Not sure what you are talking about. February 2016 was the hottest month in the satellite record, so I don’t think anyone was claiming global temperatures were plummeting last winter, at least I don’t recall anyone doing so.
Gareth: “Are we now saying the world is indeed warming ?”
Not me. I’m saying the world has been in a slight temperature downtrend since the 1930’s, which show to be 0.5C hotter than 1998 (or 2016) on Hansen’s 1999 chart. We didn’t break the downtrend in Feb 2016, the hottest month of 2016, and now the temperatures are falling well below that level. So, the downtrend continues, at least for now.
Gareth Phillips on January 4, 2017 at 4:27 am
Are we now saying the world is indeed warming ?
Certainly not when considering such an example! But well if we speak about some parts in the world, e.g. the latitude zones 80-82.5N or 80-82.5S.
Linear trends for the period 1997-2016
– 80-82.5S: 0.14 °C / decade
– 80-82.5N: 0.39 °C / decade
Source: UAH 2.5° grid dataset
Shome Mishtake Shurley ?
Don’t call me Shurley.
Of course it did! Just enough to get the headlines.
Hotest year evah!!!!
As if atmospheric temperature could be measured with the accuracy of 0.01 degrees centigrade when it ranges over 100 degrees globally at any point of time.
It’s a bit like measuring Bill Gate’s wealth in pennies.
I was about to raise the question of precision as a dumb question, so I’ll go ahead and do it anyway:
Does 0.02 degrees have any real meaning? … ARE the figures for global average temps. this precise?/b>
Now let’s argue over 0.002 degrees. Why stop with the measly hundredths decimal place? Let’s draw some alarming graphs with big scales representing a thousandth of a degree for every inch, so our trend lines angle sharply and [clear throat] catastrophically upward.
The smaller the mole hill, the bigger the mountain.
Get your HTML right, Kernodle !! grrrrrrrrrrrrrrrrrrrr !
Yes. And many learned people call this global temperature “climate.”
In a word no.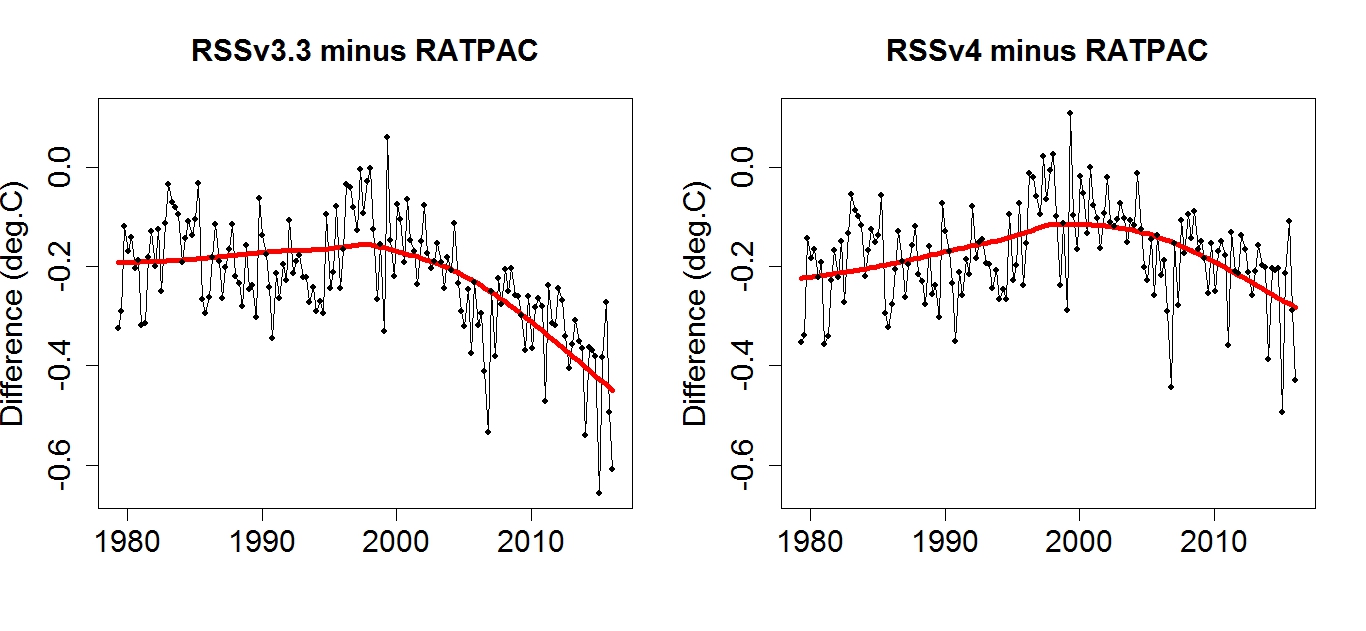
The MSU sensor aboard NOAA 14 was replaced in ’98 by an AMSU sensor aboard NOAA15.
That’s where problems arose and why RSS amended v3.3 up to v4.
Also the TLT produce was subject to sat drift errors.
RSS say that they don,t know which sensor is in error (MSU or AMSU) and so have split the error between the 2 …..
Whilst UAH maintain that as the AMSU is newer, it is more likely to be correct.
Yet it is running cold against the RATPAC radiosonde data.
RSS v3.3 was v close to UAH v6
But the RSS correct puts UAH as. Distant outlier…..
http://postmyimage.com/img2/995_Tropospheretrends.png
From: http://www.drroyspencer.com/2016/03/comments-on-new-rss-v4-pause-busting-global-temperature-dataset/
“While the title of their article implies that their new diurnal drift adjustment to the satellite data has caused the large increase in the global warming trend, it is actually their inclusion of what the evidence will suggest is a spurious warming (calibration drift) in the NOAA-14 MSU instrument that leads to most (maybe 2/3) of the change. I will provide more details of why we believe that satellite is to blame, below.”
From: http://www.remss.com/blog/RSS-TMT-updated
“In summary, we made a change to the dataset to reduce the intersatellite differences, particularly for the AMSU data. We applied the same method to all the data, including MSU and AMSU. We suspected that this would lead to more warming during the part of the NOAA-15 mission that underwent a large drift in measurement time, but did not know the result for the entire dataset.”
“We agree that there is a problem with either NOAA-14 or NOAA-15, or both. We explicitly discuss the problem with the NOAA-14/NOAA-15 overlap in the paper. We do not know if the problem is due to NOAA-14 or NOAA-15. If we assume that all the drift is due to NOAA-14, as Dr. Spencer would like us to do, we can eliminate the use of NOAA-14 after 1999 so that its (potentially erroneous) trend during the overlap period does not affect the overall results. If we do this, the overall trend is decreased by 0.019K/decade.
Using the current trends through February 2016, this would lead to a decrease from 0.133 to 0.114 K/decade. This adjusted number is still well above the trend in our previous versions, and also above the trends in UAH V6, UAH V5.6, or NOAA STAR V3.0.
There is no evidence that NOAA-14 drifts for time periods before 1998, because it agrees well with measurements made by other MSU satellites (NOAA-11 and NOAA-12) over the ocean, where the diurnal adjustment is not important. The drift would have to suddenly appear in 1998.
So we cannot assume that the problem is with NOAA-14. We instead explore
the 3 cases:
1. we assume NOAA-14 is wrong and remove it to the extent possible* This leads to a decrease of 0.019K/decade
2. we assume NOAA-15 is wrong, and remove it to the extent possible. This leads to an increase of 0.010 K/decade
3. we assume that the error is shared between them, and we keep all the data.”
Your Ratpacs and your Rich’s are just the warmist scientists trying to undo the satellite data and the work of 1000s before them.
Weather specialists have been putting up weather balloons and radiosondes for 70 years and they knew what the heck they were doing. They were not screwing around with the data they collected.
Then along comes a dedicated pro-global warming person on the public purse and he decides he is just going to rewrite all the hard work done by those 1000s of weather specialists over the years diligently trying to help weather forecasts be better.
The adjusters have no integrity and should be sanctioned in some manner for having no integrity.
“Your Ratpacs and your Rich’s are just the warmist scientists trying to undo the satellite data”
So what was the global average that these honest “weather specialists” compiled before Ratpac?
HadAT
http://hadobs.metoffice.com/hadat/
Versus the Ratpacs …
https://www.ncdc.noaa.gov/oa/climate/ratpac/
So after 7 months why have we not heard an update from RSS and why haven’t they published an update for the lower troposphere?
http://www.drroyspencer.com/2016/03/comments-on-new-rss-v4-pause-busting-global-temperature-dataset/
Bill:
You rather missed the point.
Read the comments made by both RSS and UAH.
There is a definite discontinuity at the point of switch from the MSU to the AMSU sensor.
Both teams know one of them is WRONG.
UAH chooses to go with the current AMSU.
RSS comes up with a “fudge” and splits the difference.
You don’t get to blame the hundreds of individual radiosondes as being wrong vs just the 2 sat sensors when it can plainly be seen that the change occurs at the swap-over of the TWO instruments.
Bill:
“Weather specialists have been putting up weather balloons and radiosondes for 70 years and they knew what the heck they were doing. They were not screwing around with the data they collected.”
Yes, I do know that … I was one of the very same for 32 years.
“Then along comes a dedicated pro-global warming person on the public purse and he decides he is just going to rewrite all the hard work done by those 1000s of weather specialists over the years diligently trying to help weather forecasts be better.”
Nope.
I know denizens are unable to divorce politics from science. You seem to think that anyone who advocates the consensus climate science is a “leftie”.
Correct?
Sorry, no.
I just, well, as I said – advocate the science.
Full stop.
Because as a Science/Met trained professional I know it to work.
Now that out of the way what else…
Ah yes ….
Indeed thanks for the complement.
I was on of those 1000’s of hard working weather specialists.
And more…
“The adjusters have no integrity and should be sanctioned in some manner for having no integrity.”
You are not talking to the cheering denizens with me.
That bizarre hand-waving accusation holds no truck.
Neither does it to anyone with an ounce of common sense.
You dismiss yourself as a credible debater instantly with that.
Bill Illis
“HadAT
http://hadobs.metoffice.com/hadat/
Versus the Ratpacs …
https://www.ncdc.noaa.gov/oa/climate/ratpac/“
Your HadAT link says:
Cautionary note
It is important to note that significant uncertainty exists in radiosonde datasets reflecting the large number of choices available to researchers in their construction and the many heterogeneities in the data. To this end we strongly recommend that users consider, in addition to HadAT, the use of one or more of the following products to ensure their research results are robust. Currently, other radiosonde products of climate quality available from other centres (clicking on links takes you to external organisations) for bona fide research purposes are:
<b<Radiosonde Atmospheric Temperature Products for Assessing Climate (RATPAC)
RAdiosonde OBservation COrrection using REanalyses (RAOBCORE) and Radiosonde Innovation Composite Homogenization (RICH)
IUK (Iterative Universal Kriging) Radiosonde Analysis Project
Bill Illis on January 4, 2017 at 9:45 am & January 4, 2017 at 10:55 am
Your Ratpacs and your Rich’s are just the warmist scientists trying to undo the satellite data and the work of 1000s before them.
Wow! Bindi says. What an arrogant spell!
Sorry, Bill Illis. One more time you give us a wonderful proof that you make good charts but don’t know much more than how to make good charts.
Unfortunately for you, I have all RATPAC B and HadAT2 data in the PC, and so you can see how wrong you are:
http://fs5.directupload.net/images/170104/7wuhiuvm.jpg
This is a chart comparing the two radiosonde datasets from 1958 till 2012 (end of HadAT2), at an atmospheric pressure of 700 hPa (I can show you any other pressure level).
BTW I remind you that you use, in your charts comparing HadAT2 with UAH6.0, a wrong HadAT2 dataset, namely that one which has been a posteriori harmonized with… satellite data; that means you don’t compare apples with apples, but… 1 with 1.
RWturner January 4, 2017 at 11:08 am
So after 7 months why have we not heard an update from RSS and why haven’t they published an update for the lower troposphere?
http://www.drroyspencer.com/2016/03/comments-on-new-rss-v4-pause-busting-global-temperature-dataset/
Same reason as UAH haven’t done so, they’ve both dropped that product.
None of you even clicked on the Ratpac link.
I purposely gave you a dead link because that is all the NCDC does.
They adjust the data and then make the old data disappear. They don’t even provide a following update link.
All the Ratpac data used to be completly different. then it got changed into Ratpac A and then a verision 2.0 and then 2.01 then 2.5 then 2.5.4 and then we moved onto another letter and we got a Ratpac B.
And then that was not good enough, we needed a Rich and then a Raobcore and then Raobcore B and people are working on version 3.2.1
And it just gets higher every time the NCDC or a climate scientist tries to adjust upwards a new more “accurate” version.
There is too much “conflict of interest” in this business. There is a reason the human race has so many rules against conflict of interest. Because humans sometimes take advantage of these situations. The human race needs lawa and police and courts because people sometimes do wrong things and the laws are needed to protect the rest of us from those wrongs. The NCDC needs a conflict of interest law and another objective entity to take over the data gathering function.
They need to split in two and one of those can be building the climate models and writing theory papers and giving interviews about ice-shelves calving off glaciers. And the other entity will be collecting the data and going to boring statistical math lectures – like the national statistical agencies do today.
What would the increase in global temp from 1998 to 2016 have been if the observations reflected the average projections of the CMIP-5 models? Don’t they show something like 0.288 degrees rise on that time frame? [reported to be 0.161 C / decade] 0.02 degrees is about 7% of that. Or to say it differently, we observe about 1/14th of what has been projected [going from one El Nino peak to the next].
Still waiting on error bars, something I don’t recall ever seeing with respect to climate. You can’t measure something without +/- something occurring during your calculations unless you choose to willfully ignore it. So what is it then? Up 0.02 +/- 0.05? I’d put a significant chunk of money on a bet that says the result is not statistically significant when measured and calculated properly.
https://wattsupwiththat.com/2016/04/19/systematic-error-in-climate-measurements-the-surface-air-temperature-record/
The people compiling the global instrumental record have neglected an experimental limit even more basic than systematic measurement error: the detection limits of their instruments. They have paid no attention to it.
Resolution limits and systematic measurement error produced by the instrument itself constitute lower limits of uncertainty. The scientists engaged in consensus climatology have neglected both of them.
It’s almost as though none of them have ever made a measurement or struggled with an instrument. There is no other rational explanation for that sort of negligence than a profound ignorance of experimental methods.
The rate and magnitude of temperature change since 1850 is literally unknowable. There is no support at all for any “unprecedented” in the surface air temperature record.
Claims of highest air temperature ever, based on even 0.5 C differences, are utterly insupportable and without any meaning.
All of the debates about highest air temperature are no better than theological arguments about the ineffable. They are, as William F. Buckley called them, “Tedious speculations about the inherently unknowable.”
There is no support in the temperature record for any emergency concerning climate. Except, perhaps an emergency in the apparent competence of AGW-consensus climate.
Maybe unsurprisingly, this was the exact issue that caused me to to reject the AGW “hypothesis” in 2003, nearly 15 years ago.
My background is measurement theory and statistics, design of experiments (I have an autographed copy of Box & Hunter. I was born a nerd). When I read Mann’s “Global-scale temperature patterns and climate forcing over the past six centuries” I almost tossed my cookies; I’d never encountered such trash in my entire professional career. For nearly a year I avoided being seen in public. Had I really supported that nonsense? I had. it was horribly embarrassing.
If you have the stomach for it, consider doing research into the uncertainties of dendrochronology. If that doesn’t ring your chimes, do some investigating of CO2 estimation using boron isotope decay in fossil foraminifera. Then there’s always gas migration in ice cores to consider.
The entire paleo record is rife with uncertainties that are never discussed. Then we come to the instrument record. How can anyone believe in measures from the 1800’s accurate and precise to 0.1C? Any takers on that? Old men wearing bifocals reading thermometers they got mail order from Sears in a snowstorm, in North Dakota, in February? Seriously?
And so we pass the peak of the Modern Warm Period.
Don’t be hasty. We haven’t been looking that long.
2016 warmest year eva, just more fake news. . .
Aside from world news (always depressing) my first port of call in the morning is WUWT. Thanks to all that post relevant information connected with the science. The politics are just yuk.
I trust the satellite and balloon data . The argo data will also become increasingly important over time. I most certainly don’t trust any data prior to 1960. It is useless IMO, unless you want to know temp within 3C. As for trends, I trust most the principles of nature, which I have both studied academically and observed through farming the same environment over 40 years.
We can expect a trend in climate over a millennium scale. This trend will be influenced by temporary events and noise. We see this in the rock record within my field, geology. The important mechanism to be aware of is feedback. Nothing works independently. Pull one strand in a spider web and all others are influenced. Likewise, we live in a giant thermostat. Buffering is going on the entire time to moderate the influence of temporary events: volcanic eruptions, El Niño e.t.c. But there is always a time lag, such that the event can be recorded. The point is that nothing spirals out of control and most events do not influence long term trend.
Nevertheless, there will always be a long term trend. Of most interest in the charts is the slight step-up to a plateau for 18 yrs after the 98 El Nino. My understanding is that Bob Tisdale is predicting a similar occurrence after this latest. My gut feeling is that he may be right. This mechanism (if it occurs) is a reflection of the long term trend i.e. gradual warming on a millennium scale.
On a much small scale, we have had a most unusual spring and early summer in New Zealand. There may have been a cooler seasonal period over the last 40 yrs but I cannot remember it. We farmers have historical diaries in our head. A local observation is the very slow growth of the maze crops this year. I was told by a grower many years ago that “a good crop is up to the top of the fence by Christmas”. New Zealand fences are of a standard height. I have driven past his crops every year while going to town, and every year that I can remember – he has got it spot on, except for this year. I checked it yesterday. 10 days after Christmas and the crop is still way short. There has been plenty of rain, but too darn cold.
The poor holiday campers are going home miserable.
‘2016 edges 1998 as warmest year in satellite record – by 0.02°C’
Which means ‘not at all’. Is anyone going to seriously claim they can measure the Earth’s global temperature over an entire year down to .02 degrees?
It’s worse then we thought. Mann has now made the climate constant.
Humour from the loony socialist Alberta NDP Party – yes Virginia, warmist idiots really do talk like this.
Warning to “climate changer deniers” everywhere – be very afraid! Nannie Rachel Notley will get you!
Best, Allan 🙂
NDP DEMANDS REMOVAL OF WILDROSE CRITIC OVER CLIMATE CHANGE ROW
By Emma Graney
First posted: Tuesday, January 03, 2017 08:30 PM MST
The NDP is calling for the removal of the Wildrose renewables and electricity critic, who insists the science of man-made climate change isn’t settled.
Don MacIntyre’s latest comments came Monday at a news conference about the new carbon tax, but the official Opposition says the Innisfail-Sylvan Lake MLA isn’t going anywhere.
MacIntyre doesn’t question climate change as such; ask him about it and he’ll tell you it’s a reality, but the climate has been changing since “this world was first spit out into orbit.”
He does question to what extent it’s being caused by humans.
On Tuesday, the NDP caucus issued a news release saying after a year of similar comments from MacIntyre, Wildrose Leader Brian Jean needs to put his foot down and remove the MLA from the renewables portfolio.
The official Opposition didn’t make anyone available for an interview Tuesday, but in an emailed statement, Wildrose caucus whip Jason Nixon said rather than calling for MacIntyre’s head, NDP backbenchers “should be more worried about getting rid of incompetent NDP ministers bringing in carbon taxes, making a mess of children’s services and tearing up confidence in Alberta’s economy.”
Leduc-Beaumont NDP MLA Shaye Anderson said Tuesday if an opposition critic is going to talk about something, “it would be appreciated if they had all the facts.”
“I’m not taking anything away from MLA MacIntyre — he’s done some incredible things in his career and he’s very smart man. His background is really quite interesting, that’s why it frustrates me even more,” Anderson said.
“This is an important issue, and if you’re not going to go on fact-based discussions, then maybe someone else can.”
And those discussions, Anderson said, shouldn’t be about scoring cheap political points.
“I want to make sure it’s not a partisan issue,” he said. “I think it’s something we could actually work on together, because solving climate change is a profitable opportunity for our industries we have here, our manufacturers, our energy companies.”
The term “climate change denier” became highly charged in the legislature last year after the NDP government repeatedly threw it at the Opposition.
On June 1, Speaker Robert Wanner cautioned MLAs to be more selective in bandying it around: “Clearly, it does on occasion create disorder.”
The next day he repeated his plea, after Premier Rachel Notley used the term in question period.
While some Wildrose MLAs have posted comments and links to anti-climate-change videos and articles online, they’re at odds with Jean, who said during the 2015 election: “Man-made climate change is real and we need to tackle it head-on.”
egraney@postmedia.com
Here in Australia the ABC are reporting 2016 4th hottest nationally, hottest year globally.
And then we have this;
http://www.smh.com.au/environment/climate-change/no-cooking-the-books-new-study-confirms-global-warming-hiatus-didnt-happen-20170104-gtlujo.html
So 0.02 deg C +/-? What are the error bounds?
+/- 0.1
ToneB ~ “And the difference is that sat temp data rely on ONE instrument.
Whereas the surface record relies on thousands of thermometers.
That do?”
Not really, I’m afraid. The satellite record has a correspondence to the radiosonde record of 0.98 and the radiosonde record is derived from tens of thousands of instruments ~ a different one for each flight. The satellite record is reliable. That do?
RWturner January 4, 2017 at 9:37 am
Then you show the RSS adjustments for v4.0 in an attempt to compare them to the changes occurring with 6.0 but don’t even grasp that the two graphs are measure two different things. RSS 4.0 has only been released for the mid-troposphere. RSS seems to be dragging their feet on the 4.0 LT interpretation, probably because they need to account for the differences in NOAA-14-MSU and NOAA-15-AMSU.
No, they measure the same things.
I suspect like UAH RSS will drop the TLT product because of the difficulty in dealing with the surface interference and the use of multiple angles.
Both RSS and UAH now use a Middle troposphere measurement corrected by the stratospheric measurement to remove the influence of stratospheric cooling in order to produce their new Lower troposphere data.
The two new products have peak weighting at 4km (2km higher than the previous TLTs) and have better coverage towards the poles.
RSS TTTv4 is comparable with UAH LTv6, neither is directly comparable with the previous TLT products.
The essential difference that remains is the way in which they deal with the drift associated with the shift from MSU to AMSU sensors.
Vimy100 on January 5, 2017 at 11:39 am
The satellite record has a correspondence to the radiosonde record of 0.98
Oh nooo! Don’t tell me you are naive enough to trust in this graph:
Because
1) it surprisingly ends… around 2005; and weren’t we in 2016 as the chart was published in this testimony?
HHRG-114-SY00-Wstate-ChristyJ-20160202.pdf
and
2) it is based on VIZ sondes, which aren’t longer in use since years. Deprecated material.
This was not John Christy’s first try to let us think about “correlations” between satellites and some “carefully selected” radiosondes:
http://journals.ametsoc.org/doi/full/10.1175/JTECH1937.1
Christy, J.R. and W.B. Norris, 2006: Satellite and VIZ-Radiosonde intercomparisons for diagnosis on non-climatic influences. J. Atmos. Oc. Tech., 23, 1181 – 1194.
Upon reading that paper I found an interesting list:
http://fs5.directupload.net/images/170107/pa3to22y.jpg
And after a second pass I found:
A compilation of the subsequently downloaded IGRA network dataset showed that the “Christy” radiosonde set in fact contained a rather small subset of the (127) IGRA radiosondes located in the USA.
Somewhat intrigated I generated out of the complete IGRA data two time series:
– one with those of the “Christy” set located in the USA (some are „US controlled“ but outside);
– one with the 127 US IGRA radiosondes
and in addition
– one of UAH6.0 (beta5 at that time).
Here is a chart with three plots to compare the time series from 1979 till 2016:
http://fs5.directupload.net/images/170107/ffnk4rq6.jpg
You easily see that Christy’s radiosonde choice has a trend even lower than UAH, whereas the 127 US based radiosondes have a much higher one.
Excellent correlation indeed!
Of course I didn’t follow all UAH map publications, but this is the first time I see at WUWT a map showing, for the UAH era, linear estimates for all grid cells between 82.5S and 82.5N: ?w=720&h=446
I just reviewed the entire thread, and I am surprised that nobody seems to have noticed the map, as no comment explicitely refers to it.
Unfortunately, using this globe map format, you see pretty good every detail near the equator but as you move near the poles, things get smaller and smaller and thus less visible. A possibility to rotate the map along the horizontal / vertical axes would be very helpful.
Nick Stokes‘ tool showing a Globe you can rotate interactively in any direction btw is nice as well:
https://s3-us-west-1.amazonaws.com/www.moyhu.org/maps/webgl/grid.html
*
We all can see, on the map shown above, that near the North Pole, UAH has computed trends above 0.4 °C / decade.
For me this is interesting, as it once more confirms that my interpretation of UAH’s grid data is correct. Here are linear trends I obtained for the two highest northern latitude zones:
From dec 1978 till nov 2016:
80.0N-82.5N: 0.42 ± 0.04
77.5N-80.0N: 0.35 ± 0.04
This is in real contrast with Antarctica:
80.0S-82.5S: 0.04 ± 0.05
77.5S-80.0S: 0.05 ± 0.05
But what Roy Spencer‘s map doesn’t show, as we can’t interactively modify the trend start date, is this:
From jan 1997 till nov 2016:
80.0N-82.5N: 0.39 ± 0.11
77.5N-80.0N: 0.32 ± 0.10
While the trends in the northernmost latitudes decreased, those in the southernmost ones increased:
80.0S-82.5S: 0.14 ± 0.13
77.5S-80.0S: 0.11 ± 0.12
This trend increasing at the South Pole is a bit surprising.