Guest Post by Willis Eschenbach
One of my great pleasures is to come across a new dataset. Turn me loose on new observations of this magical world, and there’s no telling where I’ll end up. Thanks to a recent article here on WUWT I got to thinking about water vapor. Some research found the RSS 1° gridded “total precipitable water” (TPW) dataset. Total precipitable water (TPW) is the mass (or sometimes the depth) of water in a 1 metre by 1 metre column from the surface to the top of the atmosphere, if it all fell as rain. The RSS dataset has the TPW (for the ice-free ocean areas only) since 1988. Figure 1 shows the average values, in kilograms of water per square metre. Note that the RSS dataset only covers the ice-free oceans.
 Figure 1. Total Precipitable Water.
Now, there are a few interesting things about Figure 1. First, you can see why they call it the “wet tropics”. There’s lots of water in the air.
Next, the horizontal red band just above the equator delineates the effect of the band of thunderstorms perpetually boiling along the length of the inter-tropical convergence zone (ITCZ).
You can also see why CO2 is called a “well-mixed” greenhouse gas, and water vapor is not. The amount of water in the air varies from the poles to the tropics by more than an order of magnitude.
Seeing Figure 1 made me think that I could estimate the change in the poorly-named “greenhouse effect” due to a given change in water vapor. Ramanathan proposed that the magnitude of the clear-sky atmospheric greenhouse effect could be measured as the amount of upwelling longwave radiation (ULR) from the surface that is absorbed by the atmosphere. Ramanathan also observed that the variation in the strength of the clear-sky greenhouse effect was an effect of the variations in water vapor.
To show the close relationship between variations in the atmospheric absorption of the surface radiation, and the total water vapor seen in Figure 1, Figure 2 shows the atmospheric absorption as revealed by the CERES data:
 Figure 2. Average atmospheric absorption of upwelling surface longwave radiation, clear-sky CERES data. Calculated as the amount of longwave (infrared) emitted by the surface minus the amount observed at the top of the atmosphere.
Seeing those two figures gave me the idea that I could actually measure the amount of change in downwelling radiation from a given change in precipitable water vapor. So here is a scatterplot graph relating the two:
 Figure 3. Scatterplot of Total Precipitable Water (logarithmic, horizontal scale) versus Atmospheric Absorption (vertical scale). Dashed vertical line shows global average value. Dotted lines show the range of the global average value over the period.
This is quite an impressively tight result, particularly given that the two variables (absorption and TPW) are from totally different datasets. I note that this is experimental validation of the IPCC’s statement about the underlying physics, viz:
The radiative effect of absorption by water vapour is roughly proportional to the logarithm of its concentration, so it is the fractional change in water vapour concentration, not the absolute change, that governs its strength as a feedback mechanism. IPCC AR5 WGI Box 8.1
More than just validating the IPCC claim of a generalized logarithmic relationship, however, this has allowed us to actually quantify the relation between the two. It also allows us to differentiate that relationship in order to determine the slope of the atmospheric absorption as a function of water vapor. That slope turns out to be 62.8 / TPW. At the average TPW value in Figure 3 of 29 kg/m^2, this gives us a slope of 62.8 / 29.0 = 2.2 W/m2 increase in absorption per kg/m2 change in TPW.
That is to say, we get a bit over two watts per square metre of increased absorption for every additional kilo of atmospheric water per square metre.
Now, that is an interesting finding which we can combine with the following look at the change in global average total precipitable water since 1988:
 Figure 4. Decomposition of the total precipitable water data (upper panel) into the seasonal (middle panel) and residual (bottom panel) components.
Some things of interest. First, in the bottom panel you can see the effect on TPW of the El Nino episodes in 1997/98, 2010/11, and 2015/16. You can also see that we haven’t quite recovered from the most recent episode.
Next, there is a clear trend in the TPW data. The total change over the period is ~ 1.5 kg/m^2, centered around the long-term mean of 28.7 kg/m^2.
And utilizing the relationship between water content and atmospheric absorption derived above, this indicates an increase in downwelling radiation of 3.3 W/m2 over the period.
Now, please note that this 3.3 W/m2 increased forcing from the long-term increase in water vapor since 1988 is in addition to the IPCC-claimed 2.3 W/m2 increase since 1750 in all other forcings (see Figure SPM-5, IPCC AR5 SPM). The IPCC counts as forcings the long-term changes in the following: CO2, CH4, Halocarbons, N2O, CO, NMVOC, NOx, mineral dust, SO2, NH3, organic carbon, black carbon, land use, and changes in solar irradiance … but not the long-term changes in water vapor.
This leads us to a curious position where we have had a larger change in forcing from water vapor since 1988 than from all the other IPCC-listed forcings since 1750 … so where is the corresponding warming?
Sunny today, I’m going for a walk …
w.
My Usual Request: We can minimize misunderstandings by being specific. If you disagree with me or anyone, please quote the exact words you disagree with, so we can all understand the exact nature of your objections. I can defend my own words. I cannot defend someone else’s interpretation of some unidentified words of mine.
My Other Request: If you believe that e.g. I’m using the wrong method or the wrong dataset, please educate me and others by demonstrating the proper use of the right method or identifying the right dataset. Simply claiming I’m wrong about methods or data doesn’t advance the discussion unless you can point us to the right way to do it.
Is “precipitable water” a misnomer? (URL:http://glossary.ametsoc.org/wiki/Precipitable_water)
The total mass of water is what results from the calculation based on the definition, which includes all phases, solid, liquid and gaseous.
But “precipitable” refers to water that has not yet precipitated, whereas at any moment cloud cover is about 50%. And whether the water forming the clouds is liquid or solid, that water has already precipitated.
Some water is in process of transit, falling as rain, hail or snow, or rising in updrafts.
Thus, water, both in clouds and in transit, is not water vapour. Such water does not have water vapour’s radiative properties.
So the jest by “son of mulder” may be apropos, that Willis has arrived at his result by failing to adjust the data.
http://earthobservatory.nasa.gov/Features/CarbonHydrology/
***
A related thought occurs to me. When water vapor precipitates and falls or rises in updrafts, does liquid water absorb CO2 and does solid water (snow and ice) entrain CO2 as it falls?
Ice cores indicate that precipitated water does entrain CO2. But is the percentage entrained the same as the average percentage in the atmosphere? Even if the atmosphere is well-mixed, its constituent gases differ in their solubility in liquid water and possibly in their propensity to be entrained in solid water.
***
In effect, precipitated water that sinks into soil or into the oceans would tend to reduce atmospheric CO2. Plants are a carbon sink because they take up this CO2.
Recent trends in hydrologic balance have enhanced the terrestrial carbon sink in the United States
https://earthscience.arc.nasa.gov/sge/ecocast/publications/pubs/nemani-grl.pdf
Lovett, Richard A., June 7, 2002: Rain Might Be Leading Carbon Sink Factor, Science
http://geo.arc.nasa.gov/sge/ecocast/publications/press/ScienceSummaryJune7.pdf
My interest in the relationship between precipitation and carnon sinks arises from Murry Salby’s recent lecture. Having studied his textbook, I am inclined to take Dr Salby seriously, but I remain skeptical, always skeptical, whatever the claim.
Salby, M. Physics of the atmosphere and climate 2012, CUP.
Frederick,
You asked, “A related thought occurs to me. When water vapor precipitates and falls or rises in updrafts, does liquid water absorb CO2 and does solid water (snow and ice) entrain CO2 as it falls?”
Clearly, water falling through the atmosphere absorbs CO2. The next time it rains, run outside with a piece of litmus paper and you should get a pH reading of about 5.5 from the raindrops. Obviously, snow entrains surface CO2, because that is how the CO2 values are derived from ice cores.
Willis,
You wrote:”And utilizing the relationship between water content and atmospheric absorption derived above, this indicates an increase in downwelling radiation of 3.3 W/m2 over the period.
Now, please note that this 3.3 W/m2 increased forcing ”
I am concerned that you are conflating three different quantities here. Increased absorption is not necessarily the same as increased down welling radiation. More significant is that it is not the same as forcing. Most of the absorption by water vapor is in the lower troposphere. But that has relatively little effect since vertical energy transfer in the lower troposphere is controlled by convection. What matters is the absorption at the altitude above which the atmosphere is optically thin (the “emission altitude”). That is much weaker, since there is so much less water vapor at those altitudes.
But interesting, even if not quite correct.
Very interesting stuff Willis. Clearly and succinctly presented.
What you are doing here is taking the tangent of the log curve at the ‘average’ TPW point. I’m sure you realise this has limited applicability. The general effect is without doubt but the numbers could be less than you are finding.
Also, although all the data are per sqr metre, the averaging will be unduly weighted to higher latitudes because the grid points are smaller and getting over counted. Presumably an area weighted average would be higher up the curve and have a lesser slope. That’s just some caveats on the actual values, the principal is correct.
Alternatively maybe you could take the average of log(TPW) as the base point for the calculation.
What is interesting is that the slope ( the positive w.v. feedback ) will be at lot less in the tropics and more in the cooler higher latitudes. It would be worth showing some numbers from both ends to get an idea of the variation due to the log curve.
.
Well clearly there are negative feedbacks. That is presumably what you are pointing to.
The first and dominant -ve feedback is the Planck feedback. The absorbed outgoing LW is calculated as the difference of what estimated to leave the surface and what is measured as leaving at top of atmosphere (TOA). That estimation of surface emissions must be based on a Planck type calculation from SST. The drift to “a warmer world” pushes the data towards the right of the graph and lower WV slope. Less +ve f/b in a warmer world. ( Hardly a recipe for runaway warming. )
So the next step, I suppose, is to get an estimation of the ‘average’ Planck feedback over that period and compare to the w.v. number.
Willis, have you seen the New Scientist article about icing at v high altitude over the ITCZ? Interesting mechanisms being proposed for a phenomenon observed by pilots and dismissed as ‘impossible’. Now ATSB begining to think it could be a contributory factor in a number of crashes, including AirFrance over S Atlantic. I can send you a scan if you PM me.
Only relevant to this post in that it relates to water transport and phase change in the tropics, but I do think you’d find it interesting.
Firstly it looks like that the TPW values have different trends depending on the data sets. Here I have two figures. :

Secondly the absorption of the upwelling LW radiation flux according to your Figure 3 is about 150 W/m2 in the clear sky. The emission rate of the clear sky is about 396 W/m2 at the surface, which would make the upwelling flux of 246 W/m2 (=396-150) at the TOA. Actually this flux rate is about 260 W/m2 for the clear sky. I cannot explain the difference.
Willis: What a delightful mess! The science appears wrong, but the evidence appears compelling. Can I shed some light on this phenomena?
In AIT, AL Gore makes the mistake of assuming that a correlation between CO2 and temperature in ice cores implies that CO2 causes warming. We should have learned from Big Al that correlation is not conclusive evidence of causation. The correlation between CO2 and temperature could be because increased CO2 causes warming, or because warming causes increased CO2, because both are responding in parallel to a third phenomena (such as orbital mechanics) or because of some combination of these possibilities.
Above, you show a correlation between log(TPW) and absorption of OLR by the atmosphere. However, we still have three possibilities: 1) TPW increases atmospheric absorption – which is certainly logical since water vapor absorbs LWR. 2) Atmospheric absorption causes an increase in TPW – which is certainly logical since absorption causes warming and warmer air can hold more water vapor. 3) Both TPW and atmospheric absorption change in parallel in response to a third variable such as temperature. TPW obvious varies with temperature, but it isn’t immediately clear why atmospheric absorption should change in response to temperature, but we can come back to this issue. So far we have at least three hypotheses to consider. You considered only one.
What is “atmospheric absorption”? You say: “Ramanathan proposed that the magnitude of the clear-sky atmospheric greenhouse effect could be measured as the amount of upwelling longwave radiation (ULR) from the surface that is absorbed by the atmosphere.” This is slightly incorrect; Ramanathan said that we can quantify the “greenhouse effect” (G) – not absorption – by:
G = oT^4 – TOA
where TOA is the LWR flux reaching space. However, Ramanathan never claimed that G was a measure of “atmospheric absorption”, because he knew that the atmosphere both absorbs and EMITS photons. It is well-known that about 90% of the photons reaching space are emitted by the atmosphere, not the surface. The flux reaching space (240 W/m2) is about 60% of the flux leaving the surface (390 W/m2), not the 10% one would expect from simple absorption. The greenhouse effect is the net result of absorption AND emission AND the decrease in temperature with altitude in the troposphere. If temperature didn’t decrease with altitude, the GHE wouldn’t exist. In the lower stratosphere – where temperature increases with attitude, rising CO2 causes cooling, not warming.
Therefore, everywhere in this post that you refer to “atmospheric absorption” you should substitute the term “greenhouse effect” – at least if you cite Ramanathan as an authority. Your plots are of the GHE, not absorption. So let’s restate the three hypotheses above using the correct terminology: 1) TPW increases the greenhouse effect – which is certainly logical since water vapor is a “greenhouse gas”. 2) The greenhouse effect causes an increase in TPW – which is certainly logical since the greenhouse effect causes warming and warmer air can hold more water vapor. 3) Both TPW and the greenhouse effect change in parallel in response to a third variable such as temperature. Since the GHE involves emission and emission increases with temperature, hypothesis 3) is looking more attractive.
Since you have plotted the greenhouse effect vs. log(TPW), you can not longer say that your plot “is experimental validation of the IPCC’s statement about the underlying physics, viz: The radiative effect of absorption by water vapour is roughly proportional to the logarithm of its concentration,” The IPCC’s statement is correct, but you have not plotted absorption vs concentration. The proper place to determine the relationship between water vapor concentration and absorption is in a laboratory spectrophotometer, not the atmosphere.
You also said: “That is to say, we get a bit over two watts per square metre of increased absorption for every additional kilo of atmospheric water per square metre.” Unfortunately, the x-axis of your plot is the log of the TPW. You could conclude that the G increases about 50 W/m2 for every doubling of TPW.
In the next section, you confuse atmospheric absorption with “forcing”. If you use the right term – the greenhouse effect – and remember that forcing is also called the enhanced greenhouse effect – things are clearer.
Unfortunately, none of my complaints about your science provide an explanation for the fairly linear plot you show in Figure 3. To be continued.
When are you people going to get over ‘upwelliing radiation’…?
Water Vapour physically TRANSPORTS heat from the surface to the upper atmosphere.
Yes, I do get rather annoyed about talk of radiation “welling” up and down. Radiation does not well, it radiates: hence the name. Moist air is less dense than moist air so the could be called upwelling, but not IR radiation.
Upward and downward or incoming and outgoing would be better adjectives for radiation or the energy flux due to successive absorption and re-emission of LWIR
Interestingly, while a normal IR Thermometer doesn’t measure the IR from Co2, it is suppose to do a good job measuring the TPW with a calibration, but in either case it’s cold, clear sky temps are 70 or 80 F colder than the surface on hot humid days, and can be over 100F colder on cold dry days. And it’s like this all the time under clear skies.
Now clouds can be near air temp.
Greg,
Upwelling came from the same people who gave us the gift that keeps giving, ocean acidification. What, do you expect accuracy from those working in the field of virtual reality?
Charles,
The conflation of energy transported by photons (surface radiation, GHG emissions, etc.) and energy transported by matter (latent heat, thermals, etc.) into a single pool (upwelling ‘radiation’) seems to be an invention of Trenberth where he needed wiggle room in the radiant balance in order to support his preconceptions, or more precisely, to obfuscate reality. Only the energy transported by photons matters for the radiative balance. We are only concerned with the LTE response, so for non gaseous matter in the atmosphere (primarily water) to be in LTE, it must be absorbing the same amount of energy that it’s emitting, thus there can be no NET conversion of the energy transported by matter with the energy transported by matter. Otherwise, the matter in the atmosphere would warm or cool without bound.
I meant,
“there can be no NET conversion of the energy transported by matter with the energy transported by photons”
CO2isnotevil wrote: “there can be no NET conversion of the energy transported by matter with the energy transported by photons”.
Nonsense! Matter emits and absorbs photons. A CO2 molecule in the atmosphere can be excited by a collision or by absorbing a photon of LWR arriving from above or below. The CO2 molecule doesn’t remember how excitation occurred, it simply emits a photon in a random direction after an average of 1 second – UNLESS it is relaxed by a collision before emission occurs. In the troposphere and lower stratosphere, collisional excitation and relaxation occurs thousands of times more often than emission or absorption of a photon. When a photon is emitted, that photon doesn’t carry any information that will allow a molecule with which it collides to “decide” whether to absorb or reflect/scatter that particular photon
Following the laws of QM, the net result of these processes is a flow of heat (the NET result of all transfer of energy) from hot to cold.
If you sum up all of the fluxes in the Trenberth energy balance diagram, the net flux of energy is always from hot to cold: between sun and surface, between sun and atmosphere, between sun and space, between surface and atmosphere, between earth and space, and between atmosphere and space.
Most of these are two-way fluxes: 1) In some cases, we can easily measure the energy fluxes in both directions – for example via radiation. 2) In other cases, we ignore the flux in one direction because it is so small – the OLR emitted by the atmosphere that is absorbed by the sun is negligible compared with the SWR traveling in the opposite direction. 3) In some cases, we often ignore the flux in one direction. When air is saturated with water vapor (100% relative humidity), water molecules still continue to escape from surface of the water at the normal rate, but water vapor is returning to liquid water at the same rate, producing no net evaporation. When relative humidity is 80% (as it is over the ocean), the rate that water molecules return from vapor to liquid is 80% of the rate at which they escape from water. The 80 W/m2 of latent heat leaving the surface in Trenberth’s diagram is really about 400 W/m2 of latent heat in water molecules evaporating and 320 W/m2 of latent heat in water vapor returning without condensing. 4) In the case of conduction, we can’t measure the amount of heat transferred by individual collisions between molecules on the surface and molecules in the atmosphere, but we know the net flux is from the [usually] hotter surface to the [usually] cooler atmosphere adjacent to the surface.
Frank,
Yes, matter emits and absorbs photons, but you missed the importance of the ‘and’. For matter to be in LTE, it must be absorbing the same as its emitting, thus has no NET effect on its environment.
The idea that energy moves from hot to cold is mostly relevant for matter in contact and not photons. A photon has no idea whether where it will be absorbed is hotter or colder than where it was emitted. This concept of energy flowing from hot to cold tends to be a non sequitur that interferes with ones ability to understand how the RADIANT balance works. For example, clouds and GHG’s, which are colder than the surface radiate photons back to the surface making it warmer than it would be otherwise.
Consider the 2 body system where a hot radiating body and a cold radiating body are each is affected by the radiation of the other, in LTE, both will have a temperature of 0K having radiated all their energy away. Can you see the influence of the environment? Understanding the Earth’s climate is at least a 4 body problem, the Sun, the surface, the atmosphere and space (the environment) where 2 of these bodies are coupled and the other 2 are independent, one of which is the source of all input energy.
Yes, Trenberth’s numbers add up, but it you look carefully, all the non radiant power leaving the surface (latent heat, thermals, etc) is returned back to the surface since non radiant power can not leave the planet, only photons can. Trenberth muddies the waters by calling the return of non radiant power ‘back radiation’ when there is not a single photon involved and this is the nature of his bogus conflation. Most of the latent heat is returned back to the surface as liquid water since as water condenses in the atmosphere, the latent heat of the phase change warms the water it condenses upon which then falls as rain. Whatever latent heat from evaporation that is not directly returned to the surface as liquid water supplies the power driving the heat engine producing weather ultimately still returns that energy to the surface. It should also be clear that whatever effect the non radiant power has, it’s already accounted for in the surface temperature and its required radiance per the SB LAW.
In fact, the radiative balance excluding non radiant power balances even better with no ambiguity and no guessing required and what we find is that 1/2 of the radiant energy emitted by the surface and absorbed by the atmosphere by clouds and GHG’s is ultimately emitted to space while the remainder is returned to the surface. The data supports this and confirms the requirement of geometry which also requires the 50/50 split since energy enters the atmosphere across half the area that it can leave from.
One final point is that on average, about 1 m of rain per m^2 per year falls, meaning 1 m of water (1E3 kg) per m^2 evaporates per year. Dividing 1E3 kg by 31.5 E6 seconds per year gives us an average evaporation rate of .0000317 kg/sec. At a latent heat of 2265 kj/kg, the average rate of latent heat from evaporation is 78 joules/sec*m^2 or about 80 W/m^2. Where does your 400 W/m^2 value come from?
CO2isnotevil wrote: “For matter to be in LTE, it must be absorbing the same as its emitting, thus has no NET effect on its environment.”
This is wrong. A group of molecules in Local thermodynamic Equilibrium (LTW) means that molecules are exchanging energy via collisions with each other much faster than energy is entering or leaving the group (for example, via emission or absorption of a photon). In that case, the group has a well-defined mean kinetic energy and therefore a thermodynamic temperature. That temperature can be used in the Boltzmann distribution to predict what fraction of the molecules are in an excited state and therefore capable of emitting a photon. Where LTE exists, the rate of emission of photons depends only on the local temperature and not on the rate excited states are created by absorption of a photon. The troposphere and lower stratosphere are in LTE. The upper atmosphere is not. Infrequent collisions can relax excited states more slowly than they are created. (LED’s, fluorescent lights and lasers are not in LTE, which is what allows us to get light without much heat from them.) See Grant Petty’s book on Atmospheric Radiation.
When radiation is in thermodynamic equilibrium with any material it is passing through, the rate of absorption and (temperature-dependent) emission are equal. The postulates used to derive Planck’s Law are quantized oscillators, radiation in equilibrium with them, and the Boltzmann distribution. Therefore radiation in equilibrium with its surroundings will always have blackbody spectral intensity at the wavelengths that are absorbing and emitting fast enough. At some altitudes and some wavelengths (not the atmospheric window), the radiation passing through is in thermodynamic equilibrium and therefore has blackbody intensity at the wavelength. As the atmosphere thins with altitude, all wavelengths eventually lose equilibrium.
CO2isnotevil wrote: “Yes, Trenberth’s numbers add up, but it you look carefully, all the non radiant power leaving the surface (latent heat, thermals, etc) is returned back to the surface since non radiant power can not leave the planet, only photons can. Trenberth muddies the waters by calling the return of non radiant power ‘back radiation’ when there is not a single photon involved and this is the nature of his bogus conflation.”
This is not true. If the sun emitted more SWR, the surface would receive more SWR, warm and lose more latent heat via evaporation. That latent heat will warm the atmosphere when the water condenses. We tend to confuse transfer of energy and transfer of heat. Trenberth’s diagram covers transfer of energy. Heat is the NET transfer of energy between to locations. Energy is transferred from water to air in a sealed jar half filled with water every time a water molecule escapes the surface. No heat is transferred because the reverse process is equally fast at saturation. It is easier to avoid mistakes by never using the term heat and only discussing how much energy goes where.
80 W/m2 is the energy in the NET flux of water to an 80% saturated atmosphere. About 4 of 5 molecules that evaporate return to liquid water without condensing into rain drops. They are initially trapped in a thin layer of atmosphere adhering to the surface. That is why wind speed has a big effect on the rate of evaporation – it turbulently mixed the saturated layer with the boundary layer. Over the ocean, the boundary layer is about 80% saturated. If totally dry air where overlaying the ocean, the NET rate of evaporation would temporarily increase 5-fold. Without turbulent mixing, however, diffusion isn’t fast enough to let many molecules escape. My point was that all forms of energy are transported in two directions, even latent heat. Trenberth’s diagram shows a two-way flux only for LWR – making it appear to be the ONLY flux in both directions.
do NOT go to jail; collect a cigar in passing.
The heat physically transported (convection) to the upper atmosphere, is mostly the 590 cal/gm of latent heat (of evaporation).
As that moist air rises, it is cooled by the upper air, because of the lapse rate, until it cools to the dew point, and somewhere around there, depending on the availability of a substrate to CONDENSE ON (NOT Precipitate) it has lost all of the latent heat tpo the cooler air, and it condenses into water droplets, or else it looses another 80 calories per gram, and becomes ice crystals.
Once in condensed form (liquid or solid) it is then quite capable of radiating LWIR , thermal radiation isotropically, about half of which escapes to space.
G
Think PV=nRT (perfect gas Law). What we measure as temperature in a gas is mostly the result of collisions of molecules. When a water vapor molecule collides with an air molecule energy is transfered between them. This transfer does deviate from the perfect gas law resulting in a wet adiabat. While this transfer of energy is going on, water molecules are radiating in all directions and air molecules are not. In thunderstorms, Most of the transfer of energy is upward by convection. As to the rate of transfer, it is mostly rapidly upward by convection of air, water vapor, water, plus a tiny amount of CO2. Most radiative energy transfer in clouds is retained within the clouds Think line-of sight and fast as light..
GES,
Close, but no seegar! It isn’ t cooled by the upper air, it IS the upper air. The lapse rate exists because of the ideal gas law, i.e. PV = nRT, or for this situation, more appropriately, T = PV/nR. That is, as the convecting air mass rises, it experiences less confining pressure, expands, and decreases in temperature. The lapse rate is modified from the ideal dry gas by the presence of water vapor, which changes state when it gets cold enough.
Charles Nelson,
Water vapor can’t physically transfer latent heat from the surface to the upper atmosphere without an unstable lapse rate. Without an unstable lapse rate, moist air rises, expands and cools slightly, is more dense than the surrounding air, and sinks.
The only way water vapor can physically transfer latent heat from the surface to the upper atmosphere is for the upper atmosphere to RADIATIVELY cool to space – past whatever GHGs are in the upper atmosphere. If convection transfers more latent heat to the upper atmosphere than can escape to space by radiation, convection ceases.
FWIW – not much IMO – AOGCMs show a slowing of “overturning” of the atmosphere associated with GHG-mediated warming. One can divide total precipitable water vapor in the atmosphere (about 3 cm) by the average rainfall (about 3 mm/day) and discover that the average atmospheric lifetime of a water molecule that evaporates from the surface is about 10 days. (9 days if I look up the real numbers.) Although my intuition rebels at the thought, models show the average lifetime of a water vapor molecule in the atmosphere increasing as the surface warms, because the upper atmosphere can’t radiatively cool fast enough.
Willis, you write: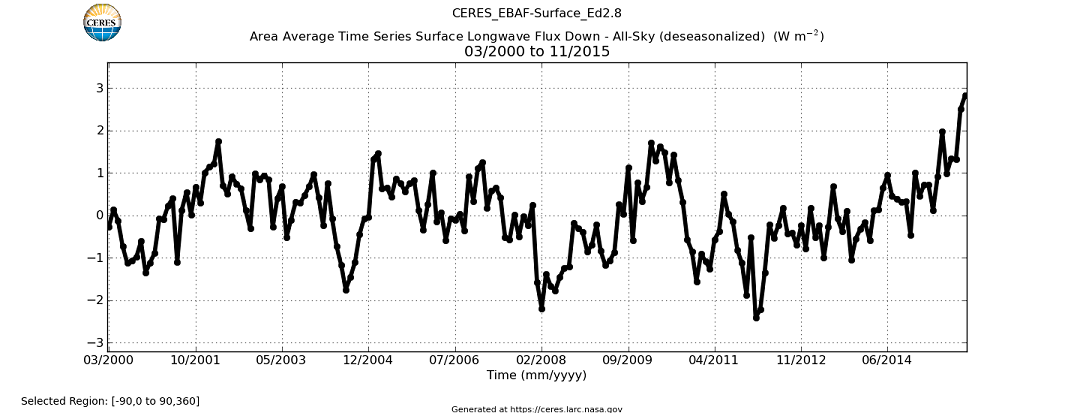

“And utilizing the relationship between water content and atmospheric absorption derived above, this indicates an increase in downwelling radiation of 3.3 W/m2 over the period.
Now, please note that this 3.3 W/m2 increased forcing from the long-term increase in water vapor since 1988 is in addition to the IPCC-claimed 2.3 W/m2 increase since 1750 in all other forcings (see Figure SPM-5, IPCC AR5 SPM). The IPCC counts as forcings the long-term changes in the following: CO2, CH4, Halocarbons, N2O, CO, NMVOC, NOx, mineral dust, SO2, NH3, organic carbon, black carbon, land use, and changes in solar irradiance … but not the long-term changes in water vapor.
This leads us to a curious position where we have had a larger change in forcing from water vapor since 1988 than from all the other IPCC-listed forcings since 1750 … so where is the corresponding warming?”
Just as peculiar: Where is that increase in “downwelling longwave radiation” that everyone’s keep talking about and thus apparently assumes is there? The CERES data only goes back to March 2000, but it shows no sign of any general increase globally, until that final 2015 Niño spike, that is:
In fact, the mean global “DWLWIR flux” actually weakened since 2000, relative to tropospheric temps:
Sorry, “everyone keeps talking about” (the word ‘keep’ came in at a later stage).
Increase in TPW plus the decrease in solar input = pause. No?
http://www.engineeringtoolbox.com/evaporation-water-surface-d_690.html
using a swimming pool calculator, I get a quick result of 220 watts/m^2 for the evaporation of water (221.2kw/1000m^2). Surely that is a lot more energy being carried skyward, where it can radiate to space, than the piddly 2 or 3 watts/m^2 for GHG.
Whenever I see the cartoon graph for the earth’s energy budget I’m amazed how little energy is attributed to evaporation. Try and keep a pool warm without a pool cover.
Take an early morning swim in a placid lake after a clear sky, no-wind night and you can actually feel the heat loss at the surface. How much energy is radiated in an eight hiur period to cool a couple of centimeters of water by between 5 and 10 degrees? I don’t think CO2 has much of a relative effect in that process. On the other hand, when the humidity is high, a thin fog layer will form just above the surface of a calm lake. Energy is being transported from that moisture near the surface, to the surface of the water, and then transported to space by radiation.
I calculate the average for what’s measured at surface station, between the days max temp to the following morning min temp, the average loss of entropy in the atm is 9kJ/kg, the cooling of just one cubic meter over night counteracts the entire forcing from Co2, and there are a lot of cubic meters of atm stacked up in the air column, the shear amount of energy exchanged daily at every point on this planet far exceeds the minor forcing from Co2, this is why it doesn’t show up in the temperature record.
The regulating mechanisms that controls night time cooling rates are all triggered by air temp approaching dew point. Even if this point is reached slightly later during the night, it’s still reached, and it then still slows cooling. Up till then, I’ve seen 4 or more degrees F cooling per hour, per hour.
ferdberple,
It is easy in Phoenix! When I lived there my pool was 96 degrees F in August.
Ferdberple: “Whenever I see the cartoon graph for the earth’s energy budget I’m amazed how little energy is attributed to evaporation.”
Ferdberple, do you know how that evaporation (cartoon graph) is calculated? A bigger temperature gradient between warm and cold area’s – for example because the tropics would extend by warming and the temperature at the south pole remains constant – will result in stronger winds with an exponential effect on evaporation. Do you know whether we can find this back in the models?
ferdberple,
“Whenever I see the cartoon graph for the earth’s energy budget I’m amazed how little energy is attributed to evaporation.”
Evaporative heat can be calculated straight forward from the precipitation; what goes up must come down (mass balance). See this comment:
https://wattsupwiththat.com/2014/01/17/nasa-revises-earths-radiation-budget-diminishing-some-of-trenberths-claims-in-the-process/#comment-1540077
Based on average global precipitation of 2.6 kg/m2.day (=2.6 mm/day), average global evaporative heat should amount 68 W/m2.
Willis finds in the main post:
“Next, there is a clear trend in the TPW data. The total change over the period is ~ 1.5 kg/m^2, centered around the long-term mean of 28.7 kg/m^2.”
This is an increase of ≈5% during the period 1998-2015.
Assuming that the average residence time of water in the atmosphere has meanwhile not changed (average velocity, average distance traveled of water molecules going up and down through the atmosphere) then precipitation should have increased with the same ≈5%, i.e. 0.05 * 2.6 = 0.13 mm/day.
This approximately coincides with the findings of Wild, as earlier referenced by David L. Hagen above:
https://fallmeeting.agu.org/2015/files/2015/12/Wild-slides.pdf (slide 27).
Here a precipitation increase is found of ≈35 mm/year ≈0.1 mm/day (NH land), period 1998-2010.
As the relation between average global precipitation and average global evaporative heat is linear, the latter should have increased by the same ≈5%, i.e. 0.05 * 68 = 3.4 W/m2.
This more or less equals the increase in downwelling radiation of 3.3 W/m2 over the reference period, which Willis has found.
Willis, thanks! You say/prove, and it’s sounded reasonable to me for about 15 years:
That is, I’ve been asking the same question for ~15 years, “Why would water vapor need CO2 to do what it could already do according to the same ‘ghg’ mechanism claimed for CO2?” – Given that there is a source for water vapor bigger than the Oceans, and that water vapor concentrations should increase with any level of the ‘right’ emitted long wave radiation, to a limit which empirically turns out to be ~logarithmic.
I’m not even saying that the “ghg” mechanism is or isn’t warming the atmosphere. And I’m ignoring your Tropical Thunderstorm Mechanism even though it sounds like it acts to feed back from the surface up, on changes in Solar input either way.
Likewise, why would CO2 suddenly be able to invoke “increased water vapor” to do what water vapor should have already done without CO2?
In other words, I’m still thinking I had it hypothetically figured out ~15 years ago but still want to know what is wrong with my thinking or interpretation of what you’ve shown in this Post.
This is what positive feedback would do, a repeating cycle of warmer air evaporating more water, warming the air.
Obviously there is no sustained positive feedback, or we would not be here to ask this question.
The more I dig, the more regulating effects I find.
“The more I dig, the more regulating effects I find.”
All I knew about climate ~16 years ago was that the fact that it changed is already in the definition of “climate”, otherwise why even talk about it? And that there are different climates already existing on earth, and were in geologic history. But I didn’t expect many “scientists” in a big “study” studying “climate change” to totally abandon “science”!
Like looking for a mouse when there is an elephant in the room.
Crispin in Waterloo
July 26, 2016 at 12:40 am
Is the aircraft pressurized, or unpressurized? If pressurized, do you know the pressurization schedule / profile for descent?
Many modern pressurized cabins Max at about 9 PSI differential at altitude, or approximate a 7000 foot ambient atmosphere, and gradually reduce differential pressure to achieve destination field elevation at at touchdown. Pressurization scheduling is contoured to minimize rate of cabin pressure change within the planned origin / cruise / destination elevation / altitude profile.
I wonder about the reflection of light by water droplets . . light doesn’t strike clouds as if real “objects”, it strikes water droplets. I “discovered” years ago that if one looks up into the blue, on a clear dry summer day, one can see (what I assume to be) water droplets in the air . .
And years ago I “discovered” that tiny glass beads are added to the paint used to make road lines . . the round white (en mass) beads especially reflect light back at the source, not scattering it equally in all directions . .
So I’m wondering about the reflection of light by zillions of tiny water droplets, right back at the sun, which we would not see as we do clouds . .
JK,
Clouds come close to being a Lambertian reflector, meaning that it has diffuse reflectance, reflecting nearly equally in all directions. That is to say, no matter where your viewing position is (except directly underneath a cloud) the cloud will appear of equal brightness.
Clyde,
Thanks . . I’m wondering about individual water “particles” of a very small size . . in the general atmosphere, especially up high, where some might act as directional reflectors . . collectively generating a low level “sheen” that increases with increasing total water vapor . .
JK,
All light impinging on a droplet will be both reflected and refracted inward. Clouds are diffuse reflectors not just because of the large number of water droplets, but because the drops can be slightly different shapes and when a light ray enters, you can get total internal reflection. Where a ray exits will be affected by the shape of the droplet and where the ray enters. Because the water is clear and the droplets very small, almost all the intensity is preserved; the intensity decays slowly. But, that means that while the droplets in the outer regions have similar sources of light (the sun), those deeper in the cloud are getting the multiple reflections and internal refractions from all possible angles.
You would probably be more likely to get directional reflectance with ice clouds, if the platey crystals have a parallel or sub-parallel alignment.
Clyde,
“but because the drops can be slightly different shapes and when a light ray enters, you can get total internal reflection.”
Yes, that’s what I figured . . and I’m wondering about very small “particles”, in general, of which some might be close enough to spherical to act as those glass beads do. Other shaped particles would (theoretically) not cancel/nullify such a unidirectional effect, so it seems to me it might be a “negative feedback” . . peerhaps of some small significance anyway.
“You would probably be more likely to get directional reflectance with ice clouds, if the platey crystals have a parallel or sub-parallel alignment.”
I just so happen to have posted this comment on another post here, two weeks ago;
‘Settled Science: Clusters of small satellites could help estimate Earth’s reflected energy’
“I’m a nobody who had read about these matters for about a decade, and there is this idea that has at times rattles around in my ignorant skull . .
Water molecules at the edge of space, being “aligned” into sheet-like thin layers, sometimes, by magnetic fields, which creates a slight “sheen”, sometimes, deflecting some light in some places . .
So, please abuse me of my affliction if it’s silly, experts ; ) “
JK,
To quote Sean Connery, “Never say never!” But, other than wind, I’m personally unacquainted with anything that might align small water droplets or ice crystals. And, if you are talking about the upper reaches of the stratosphere, I wouldn’t expect much water and I would expect it to be frozen.
” I “discovered” years ago that if one looks up into the blue, on a clear dry summer day, one can see (what I assume to be) water droplets in the air . . ”
Ever since I first started using Coleman Lanterns for indoor light at night in a cabin I have without electricity, I’ve been able to see wave action coming from its light: small dark and bright rectangles lined up amidst a general “waving” emission [roughly, since I’m not using a Coleman right now]. But if I look at clouds moving against or compared to a “fixed” mountain ridge, I see the clouds start and stop, which I think is due to the “saccadic” [searching] movement done automatically by the 6 muscles which control eye movement, so I see the clouds as starting and stopping. But why would my eyes be searching for light waves in particular? Maybe it’s just the light source’s light:
Anyway my point is that the Physics I’m seeing here at WUWT is amazing, with many teachables! I took only one Physics Course in undergrad, and it was taught by a guy nick-named “The Vector” because his head resembled one. Not that he was bad looking, but because he also acted like one. Once I saw him take ~3 steps sideways to the left and then 10 directly backward. He disappeared into the storage room and we heard a loud crash.
[Digression: I don’t know how I managed to get as high as a “B” in his Class, because I could never figure out where these Equations came from and nobody even talked about that; when I should have just taken them as “Well, there they are, go ahead on with your bad self!”
So I did get high marks when I realized that in answer to any question I didn’t quite get, I should simply write down everything I know and hope for the best. Once I got an “A+” in an English Class because I knew a lot about the past Authors, but never worried about placing them in an Age or time period! The Final’s question asked us to “Pick 4 from a certain time period and discuss them.” I got lucky.
And in the one, and highest level Latin Course offered, that I took, I got another A+. Because I knew the Prof was quite a Romantic in his own right, so I was successful in guessing what the passage was from Homer’s Illiad that he would have us translate by “sight” unseen. I’d narrowed it down to two via an English translation of “The Illiad”. The test question was on “Rumors flying on winged something, etc.”
Ah, “The Art Of The Deal”! But:
Once I got a “C” in Microbiology, when on the Mid-Term I’d scored a “60”, and the level for an “A” was only “above 40”. I couldn’t believe my eyes then nor my Final “C”. Then I got an “Honors” in NeuroAnatomy because I lucked onto the Internal Capsule when I was dissecting my Brain. Finally when they asked us at the end of Med School to participate by voting for the 10 best Students in our Class, I voted for the 10 least likely, and 5 of them made it! I’d worked with most of the 10 so I excluded the best, most of whom also made it!. After the very first test, where I scored in the “Upper Third”, I relaxed down to a slow burn for me for the remainder and ended up “In the Middle”. But I was in the top ~3%, 13th, of my Under Grad Class with ‘only’ a 3.57 ave., when I never even thought about rankings and only learned of it ~20 yrs later when I had to get a Transcript. I’ve still got only a .357 Magnum, but it also shoots .38’s, so that must be better?]
I read somewhere that some some eyes (of frogs when placed into utterly darkened test chambers), can react to individual photons . .
Well, water molecules are polar, so one wonders if magnetic fields might have (under the right conditions) an aligning effect . . Thing is, there would not need to be a particularly persistent or especially widespread effect along the lines of what I’ve mentioned, since it would (theoretically) be “unopposed” by other effects . . and according to JK’s first law of physicality: An unopposed force is infinite ; )
WIllis: As discussed above, you have plotted Ramanathan’s measure of the greenhouse effect (G = oT^4 – TOA) vs log(TPW), not absorption vs log(TPW). I find it fascinating that you have discovered a LINEAR relationship between the greenhouse effect and log(TPW).
Since the GHE is a complicated phenomena involving absorption (which is concentration-dependent and concentration varies with altitude) and emission (which is concentration-, temperature-, and altitude-dependent) and lapse rate, and involves two major competing GHGs, there may not be a simple explanation for the linear relationship in your Figure 3. I decided to look at results from MODTRAN, which takes all of these factors into account. Using typical tropical, US Standard, and subarctic winter atmospheric soundings with various surface temperature offsets (and constant humidity for the offsets and default GHGs including 400 ppm CO2), I calculated TOA OLR and then G for a dozen different surface temperatures. G rises from 39 W/m2 at 249 K to 186 W/m2 at 304 K. G increases an average of about 2.77 W/m2/K of surface temperature, but there is modest upward curvature. If I plot logG vs Ts, the curvature disappears and R2 rose to 0.99 for a linear fit.
TPW obviously usually increases with surface temperature. One can calculate a saturated water vapor pressure for each surface temperature, and plot G vs the log of saturated vapor pressure. The relationship is fairly linear, but more curved than the one in your Figure 3. The relationship between TPW and saturated water vapor pressure at the surface isn’t as simple as I first imagined. MODTRAN gives values for the amount of water vapor at each altitude for various surface temperatures and atmospheric soundings, but integrating them will take some time.
Photons absorbed by water vapor escape to space only when they are emitted from high enough in the atmosphere to avoid absorption by water vapor on the path to space. If the average photon at a given wavelength reaching space is emitted by a water molecule 4 km above the surface, it will be about 26 K colder than at the surface and the decreased spectral intensity and therefore G will reflect this temperature difference. At a less strongly absorbed wavelength, the average escaping photon could be emitted from 2 km where it is only 13 K colder than at the surface. G will be smaller at the weakly absorbed wavelength than the strongly absorbed one. Increasing TPW raises the height from which the average photon escaping to space is emitted. This is the conventional explanation for the greenhouse effect. As before, this still doesn’t explain a LINEAR relationship between G and the log of TPW.
Dear Mr. Eschenbach,
I don’t have the answer to your question, “so where is the corresponding warming?” A better question might be, “With the concentration of CO2 and water vapor continuing to increase, why the global cooling?
See – GFS UM CCI Monthly Global Temperature Anomaly Trends 2001 – 2015
Clearly Global Cloud cover has an inverse effect on temperature.
See – HADCrut4 Global Average Temperature Cloud Cover
Sorry, this post would not accept copies of these 2 charts.
If I could change the subject, with respect to the Modtran Results Regression Equation
Forcing = 2.94 Log2(CO2) + 233.6
Which I believe you referenced around 2006, could you please provide or refer me to the source for this expression?
Thank You.
Bill Van Brunt
Willis: I’m still finding your observation in this post fascinating. As discussed above, you have plotted Ramanathan’s measure of the greenhouse effect (G) vs. logTPW, where
G = oTs^4 – TOA
where TOA is OLR at the TOA for cloudless skies. The GHE often discussed in terms of an effective emission altitude (h) from which the average photon escapes to space. If we model emission to space as blackbody radiation emitted from height h with temperature Th
G = oTs^4 – oTh^4
Substituting Th = Ts – 6.5h, expanding, neglecting terms with Ts^2 or lower affords:
G = (4*6.5*o*Ts^3)*h
I can plug the data I got on how G varies with surface temperature from Modtran and calculate how the effective emission altitude (h) varies with surface temperature: h = 4.3 km for a clear tropical atmosphere above a surface at 300K, 3.7 km for the US Standard atmosphere above a surface at 288 K and 2.0 km for a sub-arctic winter atmosphere above a surface at 257 K.
Next we need to distinguish between:
1) absorbance (A) or optical thickness (tau) – which is proportional to the AMOUNT of absorbing molecule present). In the atmosphere, technically A = Int[n(z) ο.dz], where this o is the absorption coefficient) and n(z) is the density of water molecules at altitude z. TPW is the integral of n(z).dz from the surface to space. A = o*TWP. Log(TWP) = log(A) – log(o)
2) absorption – the ENERGY absorbed. G (W/m2) is energy, the net result of absorption and emission of energy.
3) Absorptance (absorptivity) – a dimensionless ratio between 0 and 1 which is equal to 1 – transmittance or 1- I/I_0. When we say that 90% of the photons emitted by the surface are absorbed before they can reach space, we are talking about absorptance. Absorptance and transmittance are confusing concepts when emission can make transmittance formally appear to be greater than 1. T = exp(-A) in physics and 10^(-A) in chemistry. If we use the chemistry definition, A = -logT. LogA = log(-logT). There is no point in going further down this path.
TPW is the amount of adsorbing water and therefore proportional to absorbance (A) or (tau). log(TPW) is logA + a constant. Neither TPW nor logTPW are measures of absorption (or emission), the factors important to G.
Your fascinating Figure 3 shows that log(TPW) is proportional to G. I have shown (via an imperfect blackbody model), that G should be proportional to the effective emission altitude for photons escaping to space, but is also proportional to Ts^3. Combining:
G = (4*6.5*o)*h*Ts^3 = log(TPW) + C = logA + C’
where C and C’ are constants. I was hoping to show that the effective emission height (h) was proportional to the absorbance or optical thickness of the water vapor in the atmosphere (most of which lies below the effective emission altitude). This is not true. h does not depend in any simple way on TPW or log(TPW) or the optical thickness of the water in the atmosphere which is proportional to TPW. As best I can tell, you have demonstrated a purely empirical relationship which doesn’t have a simple fundamental explanation. G is the result of absorption and emission (which depends on temperature and therefore lapse rate).
I think you need to look at it as compared to Rel Humidity. I’m trying to figure out why cooling slows late at night when rel humidity gets in the upper 80’s and 90’s %.
And I think it’s an optical (I ruled out enthalpy for the change in rate to my satisfaction for those keeping score).
Mark, Willis,
Mark: “I can plug the data I got on how G varies with surface temperature from Modtran and calculate how the effective emission altitude (h) varies with surface temperature: h = 4.3 km for a clear tropical atmosphere”
WR: I try to imagine what this means for a high (till 20 km) rising tropical thundercloud. Am I right, that all the condensation energy which is released at a height above 4.3 km – if not transported down by a downdraft –is prone to emitting to space?
In that case clouds towering above local emission altitudes (h) do the work (as you always have said, Willis) They break as a rocket through the energy retaining shield and release the surface energy to space. The more thunderclouds in the tropics – and I think the more low pressure area’s in the moderate latitudes – the more energy disappears to space.
Evaporation rises exponentially with the rise of wind speed. Wind speed is dependent on the pressure gradient and this pressure gradient is connected to the temperature gradient. The temperature gradient rises as the rising temperatures in the warmer area’s are combined with continuing low temperatures somewhere else (as in Antarctica).
If this all is right, the quantity of [the forming of] clouds above (h) is worth to be measured. And this can be linked to any extra energy reaching the surface. Then this feedback mechanism is known.
Surely, if 98% of the atmosphere (Nitrogen and Oxygen) doesn’t do IR then G must be proportional to TPW*. And you see this in the relationship between wet and dry weather systems and climate zones. If CO2 is well mixed, then you are only left with H2O vapour variations (O-4%).
If the vast bulk of the atmosphere can only warm or cool by collision with GHGs it isn’t hard to imagine which is the dog and which is the ‘tale’ in AGW story! 😉
“Water water everywhere…” but It’s not warm enough to be wet at the South Pole (Cold desert) and it’s not cool enough to be dry at the equator (Hot jungle). Insolation dominates where water is abundant and climate zones are dominated by water availability everywhere else.
*I’m not sure how those TPW figures deal with the spatial distribution of clouds regarding the nongaseous states of H2O within them in relation to the surrounding air though. As to cooling or warming, positive or negative feedback, you would have to separate out the effects of the water content of clouds and cloud systems from the background atmospheric vapour content and their associated atmospheric systems.
I read an article once about a method of estimating the total precipitable water concentration in an area by an analysis of gps position error.