
From the UNIVERSITY OF EXETER
The human-caused rise in atmospheric concentration of carbon dioxide is being given an extra boost this year by the natural climate phenomena of El Niño, say climate scientists in a paper published in today’s edition of the journal Nature Climate Change. As a result, 2016 will be the first year with concentrations above 400 parts per million all year round in the iconic Mauna Loa carbon dioxide record.
Lead author Professor Richard Betts, of the Met Office Hadley Centre and University of Exeter, said: “The atmospheric carbon dioxide concentration is rising year-on-year due to human emissions, but this year it is getting an extra boost due to the recent El Niño event – changes in the sea-surface temperature of the tropical Pacific Ocean. This warms and dries tropical ecosystems, reducing their uptake of carbon, and exacerbating forest fires. Since human emissions are now 25 per cent greater than in the last big El Niño in 1997/98, this all adds up to a record CO2 rise this year.”
The rising trend in CO2 was seen by Charles David Keeling when he began recording CO2 at Mauna Loa, Hawaii, in 1958. His early measurements were around 315 parts per million of carbon dioxide, 60 years later this has been rising at an average rate of 2.1 parts per million, but using a seasonal climate forecast model and statistical relationship with sea temperatures, Professor Betts and colleagues forecast the rise this year to be a record 3.15 + – 0.53 parts per million. The average concentration in 2016 is forecast to be 404.45 +-0.53 parts per million, dropping to 401.48 +- 0.53 in September before resuming their ongoing rise next year. The scientists already successfully predicted this year’s maximum concentration of 407 parts per million last month.
Carbon dioxide concentrations also show modest ups-and-downs with the seasons. Plants draw down CO2 in the summer and release it again in the autumn and winter. Professor Betts said: “Carbon dioxide at Mauna Loa is currently above 400 parts per million, but would have been expected to drop back down below this level in September. However, we predict that this will not happen now, because the recent El Niño has warmed and dried tropical ecosystems and driven forest fires, adding to the CO2 rise”.
Since natural processes only remove carbon dioxide from the atmosphere gradually, levels will remain high even if human emissions began to decline. Scientists expect the concentrations to now remain above 400 parts per million for at least a human lifetime.
Prof Ralph Keeling of the Scripps Institution of Oceanography, who is a co-author on the paper, said: “Back in September last year, we suspected that we were measuring CO2 concentrations below 400 parts per million for the last time. Now it is looking like this was indeed the case.” The ongoing CO2 measurements at Mauna Loa used in this study are made by the Scripps Institution of Oceanography, and an independent set of measurements are made by the US National Oceanographic and Atmospheric Administration, which runs the Mauna Loa Observatory.
Chris Jones, also of the Met Office Hadley Centre and another co-author, said: “Studying how these natural cycles interact with human influences is an important part of climate science. Making and testing predictions like this helps us build our understanding and further develop climate models.”
###
They are still trying to defend a long residency time for CO2?
Yes, they prefer what makes their models “work” to what empirical results.
Might be my English and the wording, but how can El Niño boots anthropogenic emissions? It can boost natural, but not anthropogenic.
Does this mean that our measly 0.12% attribution to the atmosphere is now even smaller? Go figure
I caught that, too. It implies that somehow there’s a connection between increasing El Nino CO2 and increasing human CO2. In fact, an argument could be made that El Nino may have actually REDUCED the amount of human CO2 released by reducing the need for heating of homes/offices, etc.
Good catch. The reduced heating requirement was pronounced in dollars, percent, and probably CO2.
Even in the UK the design load of a commercial A/C installation has higher energy demand than the Heating load and so El Nino could well have anthropological help in elevating Co2 levels methinks.
Think your answer was here where they say that dryer air changes the uptake of carbon.
Fransisco
El Niño did not boost emissions, it boosted the rise in concentrations which was already happening due to anthropogenc emissions.
Would there be a spike in CO2 following the temperature spike after the relevant lag time?
Well done El Nino,
Well done humans.
The atmosphere and the world’s plant life needs as much extra CO2 as it can get.
Towards 800ppm ! 🙂
Richard: If El Nino ‘boosted the rise in concentrations’ (but MM CO2 emissions stayed the same), that’s like saying the ratio of MM CO2 to natural CO2 (or whatever makes up the rest of the atmosphere) has changed because something else reduced. What was reduced?
Fancy that!
Got any OCO-2 satellite measurements proving that?
[youtube https://www.youtube.com/watch?v=_UEZqyGU5RU&w=560&h=315%5D
Isn’t it odd, that with accurate satellite measurements NOAA prefers their CO₂ models; i.e. imaginary CO₂?
Richard Betts — the 60-year cycle in global temperature, the Sine curve reached to its peak in 2016 [+ 0.3 oC] and now it is in descending mode and in 30 years it will reach to its negative peak [- 0.3 oC]. In addition, the positive urban-heat-island effect is contributing to global warming is steadily increasing while the negative rural-cold-effect is though steadily increasing its contribution is not added to global temperature trend. Unless such factors are taken in to account, it is unethical to attribute the increase to global warming. If somebody show the scientific community the quantitative relationship to global warming with CO2 and then quantify the contribution of global warming to global temperature. Without that simply qualitative statements have no meaning. My indirect deduction shows the global warming component is less than 0.15 oC so far.
Dr. S. Jeevananda Reddy
Richard, you are right, I re-read it and can be interpreted as you say. Thus it just goes to prove how measly and irrelevant anthropogenic emissions really are.
bah, humbug.
the warming oceans since the little ice age have been releasing dissolved gases at a rate commensurate with their warming.
remember,, al gore got a nobel prize for showing the graph.
so no, the nino didn’t boost human emissions.
humans added a little bit to the ocean’s releases.
gore was not even stupid enough to attribute oceanic co2 release to humans.
and brother, he’s pretty darn stupid.
but he didn’t go to berzerkeley which has graduate programs in it.
Many of us caught this. However, the increase in CO2 will be great for agriculture around the world. We need to count our blessings.
Francisco,
Human emissions are about twice the measured increase in the atmosphere and the increase in the atmosphere depends of the net sink rate in nature (land + oceans). Based on the 13C/12C variations, it is clear that tropical forests are very sensitive to (ocean) temperatures (El Niño) and following rain patterns. Higher temperatures dry out the forests which result in less uptake and thus more CO2 remaining in the atmosphere. That can be seen in the 1998 El Niño period and reverse for the 1992 Pinatubo eruption:
http://www.ferdinand-engelbeen.be/klimaat/klim_img/dco2_em6.jpg
The red line is the theoretical CO2 increase as result of human emissions at one side and the linear response of the oceans to the increased pressure of CO2 in the atmosphere above the steady state equilibrium at the ocean surface temperature per Henry’s law.
The 0.12% is a bad argument: even if it was only 0.001%, it is additional and as long as nature can’t remove it fast enough, part of it remains in the atmosphere…
The reason for dCO2/dt variations is not the forest drying; it’s the ocean CO2 solubility – the Henry’s law directly.
Francisco, this is interesting, but the explanatory note is a little terse.
I take it that you are making the point that Henry’s Law produces a curve that is consistent with observations, because one can see that the red line would coincide with a running mean of the observations.
I assume that the key aspect of Henry’s law is that more CO2 dissolves in seawater as its partial pressure increases. A rise in ocean temperature would have the inverse effect of making CO2 less soluble.
But what is most striking to my eyes is the divergence after 1980 between the emissions and the observations.
Could you please comment on that. Would it be correct to say that the two effects on CO2 acting in opposite directions has the net effect of producing this divergence?
That’s the part that needs further comment.
Francisco, sorry. I should have addressed my request to Ferdinand Engelbeen.
Your hand-waving comments are reading what you want to see into what is there.
Measured dCO2 is seen to fall from around 1988, how on earth do you manage to attribute that to an eruption is 1991? Like most volcanic attributions, you ignores the pre-existing downward trend and falsely attribute what follows to Mt P. This is the foundation of exaggerated volcanic cooling which is the bedrock of exaggerated CO2 warming.
Where is the data to support your assertions about the 1998 spike being due to tropical forests? Blind speculation IMHO.
Mak, the effect on CO2 caused by ocean temperatures is of course present too, but the effect on vegetation in this case is quite dominant.
How do we know? If CO2 is released or taken away by the oceans, its effect on the 13C/12C ratio of CO2 in the atmosphere is rather modest and the ratio change parallels the CO2 level change. If CO2 is moved thanks to vegetation, its effect on the 13C/12C ratio is huge and opposite the CO2 changes. In this case it is shown that an El Niño increases CO2 remaining in the atmosphere and at the same time 13C/12C levels get firmly down. Thus vegetation is the dominant cause:
http://www.ferdinand-engelbeen.be/klimaat/klim_img/temp_dco2_d13C_mlo.jpg
Frederick Colbourne,
The 1991/92 Pinatubo had a huge effect on the CO2 uptake by plants: there were enormous amounts of aerosols spread in the stratosphere, which scattered sunlight in all directions. While that decreased direct sunlight and has some lower temperatures – more uptake by the oceans – its effect on vegetation was remarkable: photosynthesis increased a lot because lots of leaves normally part of the day hided after other leaves for direct sunlight were receiving more sunlight over longer periods…
There was a nice overview of that event (based on satellite observations of chlorophyl reflection), but my reference got lost in cyberspace…
As my calculation is for oceans only, such events are out of the “normal” temperature – CO2 response…
Ferdinand Engelbeen. Thanks for both further explanations.
I am puzzled by the fact that the Mt. Pinatubo eruption occurred in June 1991, but most of the decline in observed CO2, from about 3.0 to about 0.2, occurred before the eruption. (There may have been a lot of CO2 ejected which might account for at least for part of the rise back to 2.5.)
The divergence between the blue and red lines started about ten years before Pinatubo and seems to have continued to the present. That’s what I find most interesting.
I don’t know what to make of this. Any suggestions?
Frederick,
One should take into account that the net sink rate is independent of the momentary (yearly) human emissions, as the former only depends of the extra CO2 pressure in the atmosphere above steady state for the momentary ocean surface temperature.
Thus there is no real reason that the “airborne fraction”, the amount of CO2 remaining in the atmosphere, would be fixed at a certain percentage of human emissions. The only reason that it still is around 50-55% is that human emissions increased quasi-quadratic over time and so did the increase in the atmosphere and the net sink rate. That gives a rather constant ratio between increase in the atmosphere and human emissions. Despite that, temperature (and other natural variations) plays a role: from year to year the increase is 10%-90% of human emissions, over decades it varies with 40%-60%. The remarkable point is that in between the huge variability, the response of the main natural sink: the oceans still is quite linear. Compare the calculated (red) line with the (green) observations: in general it is in the middle of the noise. Only after the Pinatubo there is a huge offset downward.
Also look at the last period: no increase in human emissions, due to the economical crisis, still the emissions are larger than the increase in the atmosphere, which makes that the net sink rate increases due to increased CO2 pressure, thus the “airborne fraction” is reducing.
If human emissions remained the same for a long period, the CO2 levels would go asymptotically towards a new equilibrium where emissions and sinks ultimately get equal. If we should reduce our emissions (if necessary at all) to half what they are today, no increase in atmospheric CO2 anymore…
What can be inferred from OCO-2 and GOSAT data, I’d like to know. Measuring CO2 on Mauna Loa is useless, as it tells us nothing about where the CO2 is coming from and where it’s going.
The term ‘well-mixed gas’ is a misnomer. The values at Mauna Loa are from the pacific Northern Hemisphere, which right now has little variation. However, at earth.nullschool, you can see that there are NH land locations with quite lower values, and that is true for SH African, Australian and Southern ocean locations.
https://earth.nullschool.net/#current/chem/surface/level/overlay=co2sc/orthographic=-165.28,13.56,403/loc=142.513,-23.215
At the moment, Hawaii is downwind of Southern California. On the western Pacific, Are major population centers as well.
Actually it does tell us where it has come from and where it is going. It is one the most revealing sites in the Pacific corrodor. The only problem is no one has correctly interpreted what it Mauna Loa actually records – yet. Stick around.
It is also consistent with the assertion that temperature drives CO2 levels, not the reverse.
Yes
It’s both.
Que?
And that knowledge was vouched safe to you by whom, pray tell.
Only in the fairy tale world of Warmland.
Not only in Warmland, but here in reality too. Basic chemistry.
http://www.ausetute.com.au/henryslaw.html
Haven’t we had this conversation?
Just because temps and CO2 levels appear to rise and fall together doesn’t mean that either drives the other.
However, it does make more sense that the one that changes first could be the driver, rather than the other way around, does it not?
Yes, both. Obviously.
Dr. Betts is correct.
betts is trivially correct in about the same sense that humans contributed to ocean rise by watering the porcelain bowl.
but nobody got that feverish over the prospect of taxing people to discourage their hydrogen pollution.
yet.
Dr. Betts not only is right, but some figures may help to rest this case:
Influence of temperature on CO2 levels:
– Seasonal:
~5 ppmv/K globally, mainly due to NH extra-tropical forests. T up, CO2 down and 13C/12C ratio firmly up
– Year by year variability (1-3 year periods):
– 4-5 ppmv/K globally, mainly due to tropical forests, T up, CO2 up and 13C/12C ratio firmly down.
– Multi-decadal to multi-millennial:
– 16 ppmv/K globally, mainly due to (deep) ocean changes. T up, CO2 up, little change in 13C/12C ratio.
On short periods vegetation is dominant, but that practically levels of to (near) zero in a few years, even slighlty negative: the earth is greening… Over longer periods (MWP-LIA, glacial-interglacial) the oceans are dominant but limited to Henry’s law for its influence: about 16 ppmv/K or maximum 13 ppmv of the 110 ppmv increase since the LIA. The rest comes from the 200 ppmv human emissions since that period…
Dr. Betts is correct because CO2 does cause some amount of warming and warming does result in a certain amount of oceanic outgassing.
The amount of outgassing, however, is relatively small (~100ppm from glacial to interglacial for a >10C shift), so it is only a small positive feedback, on the scale of perhaps 10ppm since 1980, which is a mere roundoff error in terms of warming going forward.
Henry’s law and all that. I opened a bottle of warm soda they other day, and it sprayed itself all over the counter.
Note to self: warm water holds less CO2 than cold water.
So ocean “acidification” is over?
Yep Phillip, The El Nino has driven all that CO2 back into the atmosphere, where it is actually useful.
Phillip –
don’t you mean ocean “CO2-ification”?
Photosyntheis in the top 100 meters by phytoplankton take their CO2 from the dissolved CO2. Despite, the ridiculous acidification alarmism (there is too much buffering for that to occur) on carbonate shell formers, phytoplankton are also strongly reponding to the CO2 where their are sufficient levels of other micronutrients like iron, reduced nitrogen, phosphate, and magnesium.
So ocean “acidification” is over?
Just overestimated.
“Lead author Professor Richard Betts, of the Met Office Hadley Centre and University of Exeter”,
From Bishop Hill
quote :First up is Richard Betts, responding in the comments thread to a preposterous article in the Independent, entitled “Official prophecy of doom: Global warming will cause widespread conflict, displace millions of people and devastate the global economy:
“I’m one of the authors of the IPCC WG2 report, and I think this article by the Independent is highly irresponsible, especially the headline.”/quote
http://bishophill.squarespace.com/blog/2014/3/19/academic-takedown.html
The conclusions of the article, that the CO2 has risen this year because of biosphere release adding to human emissions is not correct.
It is the troposphere atmospheric capacity increase in the mid to high NH latitudes, created by the El Nino heat transport northward that allowed the conditions for tropospheric retention of CO2. It is the atmospheric temperature during winter and spring in the NH mid to high latitudes that is the only controlling factor.
Has this pile of poop been covered:
http://www.climatesignals.org/
Rockefeller Philanthropy sponsored Climate Nexus (Jeff Nesbit) put it out.
Its fairytale stuff.
Excellent news – we need as much CO2 as we can possibly generate. However, I question the opening sentence. How can a “human-caused” rise in CO2 be given a boost by a “natural climate phenomenon”? Poor wording which demonstrates the bias of these “scientists”.
Is there an officially accepted level of CO2 that humans release into the atmosphere or is it entirely dependent upon which scientist happens to be talking?
You mean a consensus?
Consensus always starts with “con”.
it’s a pretty easy calculation. You take all the oil, gas and coal produced in year X, and you assume that all that is consumed in the same year, which is a relatively safe assumption to get to a ballpark figure, and then use basic high school chemistry to calculate the amount of CO2 produced by burning all that stuff.
There are other sources of course but they tend to be negligible compared to what comes from burning fossil fuels.
Cheers,
Ben
Pretty strong argument that some of the increase in CO2 since 1850 has been due to post Little Age Age recovery/warming and nothing to do with humans.
Benben, I agree with you on this narrow point given one rather significant restatement.
The natural CO2 fluxes are enormous. Much larger than AFF. But they happen to about cancel out to net plus minus zero, which is why the ice cores show a relatively stable ~280ppm for many Holocene centuries before the industrial revolution. So the net gain is likely anthropogenic FF consumption to a first order magnitude (anthropogenic land use is probably second order–Chicago was once prairie). The reason delta atmospheric CO2 is less than delta AFF is simple; the planet is greening; simply meaning biological sinks are increasing from previous sink rates. C3 plants were ‘starving’ for CO2. A reason C4 plants recently evolved.
I also looked carefully at Salby’s counter claims based on all three of his available videoed presentations; they are wrong in several respects.
hey hey, no need to argue all the time. I responded to the question ‘Is there an officially accepted level of CO2 that HUMANS release into the atmosphere’
Rivstan
Your conclusions regarding the balancing nature of the carbon cycle are all pure speculation. It does not balance and never has. There is not one shred of evidence to support this theory. Please supply evidence if you have it, and please no, IPCC carbon budgets.
http://www.drroyspencer.com/wp-content/uploads/simple-co2-model-fig01.jpg
http://www.drroyspencer.com/wp-content/uploads/UAH_LT_1979_thru_Jan_2011.gif
http://tamino.files.wordpress.com/2011/04/dco2.jpg
ristvan, don’t know what it is why the graph won’t show… If greening is causing more uptake of co2, then why was the uptake greater in the 90s percentage wise when it was cooler (with less greening) than later on after the temps rose circa 2000?
http://www.woodfortrees.org/graph/plot/esrl-co2/from:1958/mean:24/derivative/plot/hadcrut4sh/from:1958/scale:0.31/offset:0.09
Kwikikid, study the ice cores. Then get back. I was specific and clear about empirical evidence. Not my to do to educate you. Your to do to educate yourself. Then get back with credible counterfacts. You cannot, since there are none.
Afonzarelli (Happy Days?) I never said CO2 was not rising. Your graph points out it is. I agree. What I said was it is rising significantly less than Benbens simplistic AFF calculation would suggest, and the diffrence is greening of CO2 starved biosinks. Thanks for the evidentiary support.
The carbon growth rate has been tracking with temperature since the inception of the MLO data set over half a century ago. If we see cooling in the upcoming years, hopefully that will destroy the myth that plants are taking up extra co2 as the planet greens. Cooler temps mean greater uptake, while warmer temps mean lesser uptake. Hopefully, too, a nice prolonged cooling spell will send ferdinand out to pasture as well… (☺)
ristvan, we seem to be playing “computer tag”. I think my comment after yours sums it up. If it were warmer (and greener), there would be less co2 uptake and visa versa (that is, cooler/less green greater uptake). And, yes… aaaaaaay!
Ben
Actually no. The level this year only increased by 0.17 ppm/v over 1998. Since 1998 the output of co2 is close to 10 billion metric tons more a year than in 1998. That doesn’t include all the co2 that has been added along the way. Nobody knows what the other sources are or how big. And nobody knows how large the sinks were, are, or could be. If anything the rise should be at least over 4 ppm. And if the carbon cycle was near stable with only man made co2 being added, the ppm/v should be much higher each and every year by calculation. Each and every year after 1998 should have been at least 3 ppm or higher.
Did the production of co2 fall off the charts in 1999? After the el nino in 1998, the rate of rise in co2 was less than 1965 by a full 0.10 ppm. You should trot out the tried and true IPCC statement that co2 last hundreds if not thousands of years in the atmosphere or that they can tell man made from naturally produced….. both statements are wrong. Even in this article the half life of co2 is 35 to 50 years and there are a whole bunch of problems with isotope ratios. Which is related to the half life.
You don’t understand the full depth of what’s going on. It shows in your simplistic answers.
Simply put, the sinks are enormous and there are no negative numbers in the increase since Anthropogenic began. 12 billion metric tons was produced in 1965 . 6 billion made its way to a 0.98 ppm/v increase. In 2015, 19 billion disappeared. Why wasn’t there a negative number in 1965? What’s that saying is that in 1965 the entire 12 billion plus another 7 billion, with no increase in co2.
Fonzie,
As usual, you are looking at the natural “noise” around the trend, which is near entirely caused by the transient response of (tropical) vegetation on El Niño (and Pinatubo). That completely cancels out within 1-3 years to (below) zero, as vegetation as a whole is a small, but increasing sink for CO2. The earth is greening.
The year by year variability in the CO2 rate of change (+/- 1.5 ppmv around the trend) says next to nothing about the cause of the slope, which is entirely not from vegetation. As vegetation is a net sink for any period longer than 3 years and the oceans only a small source and humans emit twice the observed increase, you need to invent quite remarkable causes to avoid the human cause…
BTW, the 1990’s show a huge dip in CO2 increase due to the Pinatubo eruption: not only by cooler ocean temperatures, but the huge aerosol load in the stratosphere caused light scattering which made that leaves normally part of the day under the shadow of other leaves for direct sunlight where producing more than their normal share of photosynthesis. That was measured by satellites…
rishrac,
There is no need at all to know any of the natural CO2 fluxes in or out, as we know the net result at the end of the year quite well. The net result is that the remaining natural variability is not more than +/- 1 ppmv around the trend with the extremes (1992 Pinatubo, 1998 El Niño), not more than +/- 1.5 ppmv, while the trend is currently average around 2 ppmv/year with human emissions over 4 ppmv/year.
Thus all natural variability is less than half the human contribution, whatever the total natural ins and outs might be every year.
Looking at the noise of the year-by-year increase is blinding yourself of what really happens in the atmosphere, here the small influence of temperature of the extremes over the period 1985-2000 (assuming 4 ppmv/K temp. influence):
http://www.ferdinand-engelbeen.be/klimaat/klim_img/wft_trends_rss_1985-2000.jpg
The response of the natural sinks (mainly the -deep- oceans) is quite linear to the pCO2 difference between what is in the atmosphere and what would be there if there was a dynamic equilibrium (“steady state”) between atmosphere and oceans per Henry’s law. That gives an e-fold decay rate of slightly over 50 years over the full 55+ period of Mauna Loa, or a half-life time for the extra CO2 of 30-35 years. Much shorter than the IPCC’s Bern model shows, but much longer than the 5 years residence time that many skeptics mistakenly use as decay rate.
Well, interesting discussion, but really, I think the question was something along the lines of ‘do we even know how much CO2 is put into the atmosphere by human means?’, and the answer really is quite simple. How that translates into CO2 levels, somewhat less so 🙂
AS IS USUAL, you are ignoring the fact that all the trend features of both data sets are a near perfect match for well over half a century. (and no amount of curve fitting is going to make that happen)…
Fonzie,
It is quite impossible to match the temperature variability with the CO2 rate of change variability if that was not really linked with each other: everybody in the scientific world (skeptics as well as warmistas) agree that the CO2 variability is caused by the influence of temperature (on vegetation). No problem with that.
It is extremely easy to match two straight slopes with an arbitrary offset and factor. If these slopes are not too far from each other, the same factor can match the amplitudes of the variabilities too. But that says absolutely nothing about cause and effect, as in this case the cause of the variability is temperature on vegetation, but while temperature has a small positive slope, vegetation is a net, growing sink for CO2: it has a small negative slope for CO2!
That is your problem: variability and slope have nothing to do with each other as are caused by different processes. Thus your common factor is pure coincidence (and doesn’t really fit that well).
Take the above graph for the period 1985-2000: the amplitudes are matched for about 4 ppmv/K. While the slope of temperature is only 0.35 K, CO2 increased with 22 ppmv or 63 ppmv/K over the same period. You may believe that temperature did cause that increase, but I don’t think the late Dr. Henry would have agreed with you…
So, I’m forecasting NOAA neic and the MetOffice will add half a degree to their land and sea records over the next couple of years or maybe more if the cooling of the last decade intensifies. Sarc? It’s getting harder to decide.
Adjustments will made assuming the political regimes that enables the scam remain inplace. Even Stalin’s Lysenkoism came to an end when his handpicked predecessor fell from power.
Eventually the scam will collapse. The big guys at these government-run climate centres will simply retire and sail away in their pension lifeboats to be forgotten. The carnage will be the young and mid-career scientists left holding the shit bags they filled.
Successor, not predecessor.
Anyone know when the CO2 that is out gassing originally would have entered the Ocean?
It would be doing so at all times, just as CO2 is constantly entering the oceans it is also constantly leaving. If the climate system has a net energy balance and no major changes in minerals derived from the ocean floor, then the CO2 entering and leaving would be in balance.
The delta is roughly 800 years lag, T before CO2, same as estimated thermohaline circulation round trip time. This is shown from the ice cores at both poles. Makes intuitive sense. Atmospheric CO2 is absorbed at the sea surface. Thermohaline circulation is the main vertical ocean mixing mechanism below the surface mixed layer (wind and wave). QED.
So, during the MWP, then…
That’s just one theory ristvan. There are schools of thought out there the lag is an artifact of the deeper cores. It’s very difficult to look at the shallow cores and think otherwise. The MWP and LIA are well represented in shallow cores. Matching the time line fairly well, stomata data and (my favorite) changes in TSI, particularly of note the jump in TSI with carbon growth circa 1840. There also is a study from a couple years ago that shows that the lag is due to the differences of temperature at the poles verses the global temperature record. (recall the poles warm first only to be followed by global temps later) Since global temps lag, CO2 lags…
SF, the data say MWP and LIA are something other than thermohaline circulation. What, dunno. Do know simple observation says that science IS NOT settled. Another simple political sound bite.
Use it often.
Afonzarelli, read essay Cause and Effect in ebook Blowing Smoke. Concerns Henry’s Law and observational lead/lag T delta CO2 proxies. Then get back to me with plausible counterfactuals. Doubt you will, cause there aren’t any.
I know of no physical oceanographer who believes that “estimated thermohaline circulation round trip time.”
ristvan, do you doubt that shallow cores are showing us something different (as in no lag…) than deeper cores?
Fonzie,
Even the shallow core of Law Dome shows a lag of ~50 years between the cold snap from the MWP to the LIA and the small drop in CO2. In that case not from the deep oceans, but probably the response of the ocean surface temperatures.
Still a lot of questions waiting for an answer. Not only the lag of ~800 years during deglaciations, but the much longer (thousands of years) CO2 lag at the onset of a new glacial period…
In other words, ferdinand, there’s no “QED” about it… (☺)
Uh oh. Crank up the doom machine. This will result in a bazillion hiroshimas worth of heat to instantaneously teleport to the deep oceans, to come back and bite us later, when it feels like it. Because that’s how CO2 heat rolls.
Religious dogma has never, in the recorded history of mankind’s belief in the supernatural, not invoked mystical claims to be taken on faith The CO2 principle control knob hypothesis embedded in Climate Change dogma is no different.
( note: the control knob theory is frequently and purposefully conflated with the scientific evidence that the 3-atom CO2 molecule is a GHG agent.)
joelobryan,
“Religious dogma has never, in the recorded history of mankind’s belief in the supernatural, not invoked mystical claims to be taken on faith”
I don’t see how one could know something like that never didn’t happened . . are you some sort of seer of all time and space? . . Or are you just taking that on faith? ; )
Did anyone ask La Nina, AMO, and the solar cycle?
I thought I read somewhere that the northern and southern hemisphere air does not mix much. I would think the northern C02 would be higher if it were true.
Not so true. Mixing where the Hadley cells originate near the equator. Roughly the ITCZ.
About 10% per year of NH and SH air mixes at the ITCZ. As the latter also includes a lot of rain, most NH aerosols and a lot of soluble pollutants like SOx and NOx are rained out and don’t reach the SH. For CO2 which is very limited soluble in fresh water, that only delays the mixing, so that the levels increase at ground level in the NH first and reach the same level at height (Mauna Loa) 6 months later, one year later at Samoa and up to 2 years at the South Pole. Global levels anyway are within +/- 2% of full scale, despite the huge (20%) CO2 exchanges in and out the atmosphere over the seasons. Thus rather well mixed…
Ferdi,
The atmospheric rise of co2 from 1979 to 1988 inclusive was 16.51 ppm/v. The rise in atmospheric from 1989 to 1998 inclusive was 15.37 ppm/v. Now you could say I cherry picked those dates, and you’d be right. I picked them because 1998 ended as being the highest on record. So for the 1990’s there was no increase in world wide co2 production? In fact, during the 1990’s there would have to be a decrease of 1.2 billion metric tons a year for each year. That’s per the math. It takes about 12 BMT to increase co2 1 ppm/v with about half being sunk. No matter how you do it, not only did co2 production rate have to remain the same, but there had to be a decrease as well. We know neither of those things happened.
rishrac:
So for the 1990’s there was no increase in world wide co2 production?
The CO2 sink rate is completely independent of human production: it depends only of the increased CO2 pressure of CO2 in the atmosphere above the steady state level of the oceans at current surface temperatures per Henry’s law. That is for the average sink rate. The sink rate is modified by temperature and probable other processes like the greening of the world’s semi-deserts due to increased CO2 levels in the atmosphere.
Thus while human emissions steadily increased over time, the net sink rate shows a lot of variability. The latter is mainly the effect of temperature on (tropical) vegetation, but the 1992 Pinatubo eruption had a special effect too: not only a temperature drop, but also the effect of scattered light by the stratospheric aerosols on increased photosynthesis worldwide, which did give an extra drop in CO2 rate of change.
Vegetation was quite neutral until ~1990: maybe a small source of CO2. Since 1990 it is a small but growing sink for CO2, rivaling the sink capacity of the (deep) oceans. That may play a role in the decreased ratio between increase in the atmosphere and human emissions.
But that all doesn’t minimize the role of humans: they are responsible for the bulk of the increase since 1850…
Perhaps you’re missing the point. A drop in the 10 years of 1 ppm/v is equal to all of the increase currently of 1 BMT. It is too large of a drop. If anything the eruption in 1992 should have decreased vegetation growth as it blocked sunlight. There is another reason that co2 levels dropped that year independent of the volcano.
From 1959 to 1968 the amount of rise in co2 was 8.09 ppm/v and from 1969 to 1978 the rise was 12.28. What do those numbers mean? It means that the world would have had to produce in that time period 48 BMT more. Even supposing I’m wrong by half thats still 2.4 BMT a year. The world only recently started producing 1 BMT more each year only in the last 10 years.
The sink rates varied directly with sunspot activity AND cosmic ray levels. 1962/1963 back forecasting fit. It’s in the record.
The observed co2 levels and the amount produced do not equal. You mentioned sink rates varied, that’s why I used 10 years increments.
Yes we did produce more co2 in the 1990’s than in the 1980’s. The record indicates that if we had produced the same amount as in 1980’s it should have been an increase of 16.51 not 15.37. And it should have been similar to the huge jumps from time period 1959 to 1968 to time period 1969 to 1978. And a corresponding jump from time period 1979 to 1988 from 1969 to 1978 of another 4 ppm/v. Again we didn’t come close to producing 1 BMT until the last 10 years. And yet in those years the record increased substantially. And even though we produced more co2 each and every year from 1999 to 2009 the growth was only 2 ppm/v increase from 16.51 to 18.61. Compare that to the 60’s and 70s. We are producing more and the sinks are increasing faster.
rishrac,
If anything the eruption in 1992 should have decreased vegetation growth as it blocked sunlight.
The scattering of sunlight increased total photosynthesis, as could be measured by satellites. Had a reference, but that is gone from the net…
The observed co2 levels and the amount produced do not equal.
There is no reason at all that emissions and observed CO2 level increase should be related: the sinks are completely independent of the momentary emissions, they only depend of the height of the CO2 level in the atmosphere above steady state. See the red line in the graph above. That is the theoretical residual in the atmosphere from human emissions at one side and the theoretical sink rate based on the extra CO2 in the atmosphere. Around the average increase, one has a lot of variability, mainly from the temperature influence on vegetation.
The sink rates varied directly with sunspot activity AND cosmic ray levels.
Possible, as sun activity influences the position of the jet streams and thus rain patterns and thus vegetation uptake. Together with El Niño / La Niña…
We are producing more and the sinks are increasing faster.
That the sinks are increasing faster is partly a matter of increased CO2 pressure in the atmosphere, partly of an increase in uptake by vegetation, the earth is greening…
An increasing sink nullifies equilibrium. The sink has either always been there or it hasnt. The sink doesn’t care. It will consume whatever co2 there is. It’s a trace gas to start with. The jumps during the 60’s and 70s can not be explained by anthropogenic forcings. Nor can the subsequent slowing of the rate of growth by sink rate alone in direct opposition to the ever increasing amount produced. It is not linear.
One should not be decreasing and the other increasing. The sink is variable, the natural co2 is variable and the relationship between anthropogenic co2 and natural is essentially unknown. There is simply no way during the 60’s to have added ( assuming I’m 50% wrong) 2.4 BMT a years.
rishrac:
An increasing sink nullifies equilibrium.
An increasing sink proves that the current atmosphere is increasingly above (dynamic) equilibrium. The ratio in sink rate vs. CO2 pressure above steady state is even surprisingly linear, see the calculations here.
The sink has either always been there or it hasnt. The sink doesn’t care. It will consume whatever co2 there is.
The oceans were always there and are both a sink and a source: a source where cold deep ocean waters are upwelling near the equator and putting a lot of CO2 into the atmosphere when they warm up and a sink where the THC and other water movements sink in the deep with a lot of CO2 dissolved, to get back to the surface some 1,000 years later near the equator.
It can’t consume whatever CO2 there is, it consumes or releases CO2 in ratio to the pCO2 difference between the water surface and the atmosphere. That is Henry’s law. If the pCO2 of the oceans is higher, CO2 levels in the atmosphere go up and reverse. The dynamic equilibrium is reached when (equatorial) inputs are equal the (polar) outputs. That is around 40 GtC/year as CO2. That is a dynamic equilibrium, or “steady state”.
The strady state for the current area weighted average ocean surface temperature is about 290 ppmv.
As the current pCO2 in the atmosphere is over 400 μatm (=~ppmv: ppmv is in dry air, μatm in wet air near the ocean surface), more CO2 is pressed into the ocean surface than is released. Currently a difference of ~0.5 GtC into the ocean surface and ~3 GtC into the deep oceans.
relationship between anthropogenic co2 and natural is essentially unknown.
As said before, there is no relationship between anthro and natural CO2: humans emit CO2 one-way at will and the natural cycle is essentially stable, as can be seen in all observations. The small natural variability in sink rate is mostly a matter of temperature and other known and unknown factors, but in average directly proportional to the extra CO2 pressure in the atmosphere above equilibrium.
There is simply no way during the 60’s to have added ( assuming I’m 50% wrong) 2.4 BMT a years.
In every year of the years since Mauna Loa and the South Pole, human emissions were higher than the increase in the atmosphere. In every year nature was a net sink for CO2, not a source…
The average concentration in 2016 is forecast to be 404.45 +-0.53 parts per million, dropping to 401.48 +- 0.53 in September before resuming their ongoing rise next year. The scientists already successfully predicted this year’s maximum concentration of 407 parts per million last month.
While their prediction is in the realm of reason their conclusion needs work.
Using the 1998 El Nino as a guide there are going to be 3 low CO2 growth years after this one.
Given the differing conductions this year should be slightly less of an increase than last year, about on par with the 2.92 PPM 1998 increase. That wouldn’t good for global warming theory because emissions are 50% higher.
They are predicting a 3-4 PPM year. We’ll see.
Although I appreciate Prof. Betts’ study, I have to go with Jack Dee on this:
So what?
What will ‘they’ say when La Nina means cooling global temps against a record high in CO2 levels? I’m still waiting for global warming to kick in. It’s mid June and it was 14c here in southern England this morning. When will global warming actually start – I’m looking forward to it?
I see the Met Office is predicting just 11c on Saturday evening for my region…11c?!? Mid-June! What say you, Professor Betts?
And, snow is expected in the Cascades for the next two nights.
Any informed person would call that “weather”.
I suspect so would Richard Betts.
A correct statement by you (for a change!). But what’s your point?
Climate forecasting pays Better than weather forecasting.
Has everyone missed the “it’s worse than we thought scenario”? As global temperatures rise, natural sinks for CO2 like the ocean, will absorb less CO2, and this will cause more atmospheric CO2 and this will turn into a vicious cycle that will escalate global warming to such an extent… well, that it may become so hot that the oceans could boil. Be afraid; be very afraid.
Has everyone missed the “it’s worse than we thought scenario”?
Well, there is something called the Reveile (Drivel?) factor. The Revelle factor is supposed to go up as more CO2 is absorbed. Since the ocean can absorb less CO2 the CO2 level will soar upward. The ocean is supposed to become hypercapnic when the atmospheric CO2 level hits 650 PPM..
http://onlinelibrary.wiley.com/doi/10.1029/2006GL027028/full#references
Now, this makes a great story but ignores some things:
1. The ocean is outgassing at the equator (even though it has a low Revelle factor) and the CO2 is absorbed mostly in the Arctic (which also has a low Revelle factor)..
2. There are plants in the ocean.
3. About half the absorption is by plants on land.
4. The atmospheric CO2 isn’t going to get much over 460 PPM (from industry production estimates).
5. Fish lived in the ocean when the CO2 level was over 1000 PPM.
7. The Arctic has low Revelle factors (half or less of the North Pacific and North Atlantic)
8. Less sea ice means more gas exchange.
The bottom line is the global warmers claim that ocean CO2 absorption should be plateauing and instead it is steadily increasing.
That makes the CO2 rate of increase look like a betting opportunity. The current hiatus in emissions increase has historically led to a decrease in the annual rate of increase. The global warmers claim it should accelerate as sinks saturate. Place your bet now.
The emissions are at RCP8.5 level, the CO2 level is in the RCP4.5 range.
The forming and melting of sea ice is also supposed to pump co2 into the arctic waters. If we see warm northern pacific fuel Arctic with humid air, big increases in sea ice could keep co2 down this fall and winter.
I’m not sure about the scoop of the content of the paper. The impact of the SST of the tropics on the annual grow rate of the CO2-level is well known for years:
http://www.dh7fb.de/ninos/co2gr.gif
What’s the new message of the paper?
PS: The SST lead by 7 month, this is considered in the figure above.
Well this is good news for plants, but extra work for my lawnmower.
Finally some official recognition of the effect of SST on atm CO2. Amazing stuff.
Richard Betts is certainly one of the more credible members of the climatology establishment.
Natural cycles , testable predictions. A welcome re-emergence of true science?
Observation has already falsified modelled CO2-climate theory. But they still attempt gross, dubious adjustments to observation to avoid the crushing loss of reputation, funding, and political support blowback.
I am not as optomistic as you Greg.
“Plants draw down CO2 in the summer and release it again in the autumn and winter.”
What plants “release” CO2 in the autumn and winter?
What plants “release” CO2 in the autumn and winter? Dead ones
Good point. What happens in winter is that AFF inceases atmospheric CO2 while plants are dormant. And the Cycle is synced to NH seasonality. This empirically shows two things. 1. There is more land in the NH. 2. Land based plants are an important sink ( questimate is 50-50 land/ ocean despite oceans being 79% of surface. Much ocean surface is relatively barren (lacking micronutrients, especially iron).
How much of a seasonal factor is the Arctic Ocean? it is hard to exchange CO2 through ice.
There was a paper popular not to long ago that claims ice formation and melt somehow pumps co2 into the Arctic waters.
Here is a comparison of CO2 and Arctic sea ice :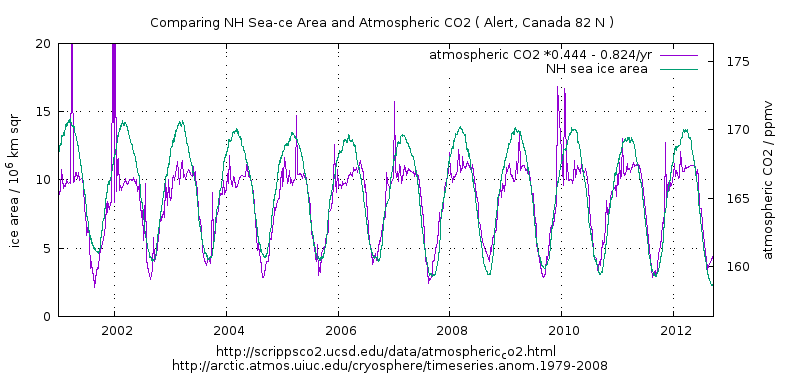
https://climategrog.wordpress.com/co2_nh_ice_area_2001/
It would be interesting to see what they predict for Sept 2017. Once La Nina knocks SST back down to a more normal level. This will to a large extent depend on where they estimate SST will be next year, but this would be in interesting check of the new realism that seems to be taking root at Hadley Centre.
CO2, being in the hands of a more or less independent group, is one of the few records which has not been rigged by zealots yets.
About 9ppm/year/kelvin change around the 1998 El Nino.
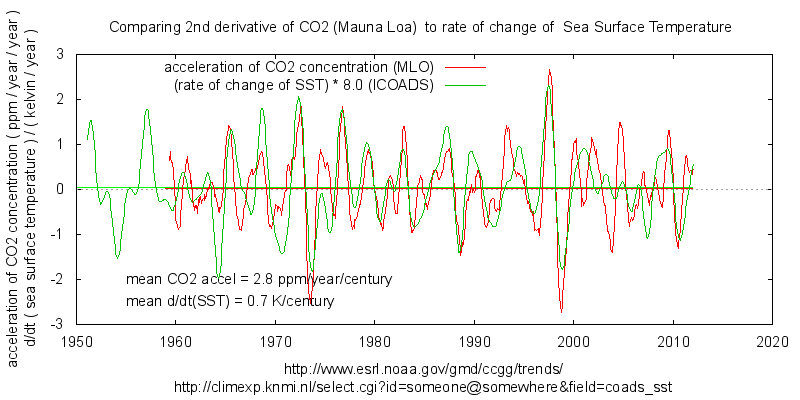
https://climategrog.wordpress.com/co2_sst_regression_nino98/
This is what the annual cycle looks like at MLO.
https://climategrog.wordpress.com/co2_daily_2009_fit/
What the steeper negative slope of the NH growing season (relative to the Oct-April increase) suggests is that it will only require about a 22-28 day increase in the growing to completely zero-out the 2.3 +/-0.5 ppm/yr overall average increase.
According to the anchovies, La Nina could be on the way
https://www.undercurrentnews.com/2016/06/07/exalmar-says-peru-survey-finds-good-biomass-in-southern-areas/
According to Bob Tisdale Nino 3.4 is already negative. Looks like La Nina starts next month.
Its all so ar$e about t1t its just unbelievable..
So, Richard Betts, explain these things..
Why are stomata on the underside of plant’s leaves – are the plants not perhaps expecting their food to be coming up from under them?
What plants exhale CO2, its beyond crazy for them to do so after they’ve gone to so much trouble collecting it. We’ve seen it written that they ‘need energy’ What! So they can go out chasing woolly mammoths to bring home for the BBQ?
Why did the generally accepted CO2 curve start ramping up at the end of WW2 – what ‘fossil fuel’ event occurred around then – apart from the overnight conversion of munitions factories to agricultural fertilizer factories. What does nitrogen fertilizer actually do – have you any idea
3 questions about why CO2 ramps up in the NH autumn.
1. Is it not because a lot of man-made plants (corn, wheat, rice etc) effectively die and stop taking it up?
2. Is it not because the soil temperature in the NH reaches its annual peak in the autumn and the things creating the CO2, dwelling in the soil and being very temperature sensitive are at their most active?
3. Why do grassland farmers notice a massive surge in grass growth in the autumn, the so-called autumn flush even when they have not spread any fertilizer
If any or all these things are actually happening, does it not explain your El Nino = high temps = high CO2 rise
Peta,
Most of the extra CO2 in the natural cycle comes from dead plants, which peak in fall as leaves are falling down and deteriorate, but that process goes on all year (even under a layer of snow in mid-winter). The main uptake is in spring when new leaves are formed and that goes on all summer and part of fall, until the cold comes in. That is what is seen both in CO2 levels as in 13C/12C ratio, as taking up CO2 by plants in spring/summer is preferentially 12CO2, thus changing the 13C/12C ratio in the atmosphere.
Which one – uptake or decay – wins the battle is a matter of temperature and growth/decay rates. Over the past decades there is little change visible in the regular seasonal ups and downs, thus the seasonal cycle shows little variablity…
The above is what happens mainly in extra-tropical forest and mainly in the NH, where most of these forests are situated (the agricultural cycle is quite parallel with that). El Niño has its effect mostly in the tropical forests and is opposite to what happens with the seasons: temperatures get too high, the forest is drying out and reduces its uptake or even is a net source of CO2. That is reversed what a La NIña gets in…
Human emissions increased very slowly until WWII, after that the industrialization of the Western world increased enormously and currently SE Asia and Brazil are leading the dance…
Peta
“Why are stomata on the underside of plant’s leaves…?”
Could it be an aspect of evapotranspiration? The location of stomata in the shade might reduce water loss.
Imagine how ineffective the exhaust fan in the bathroom would be at venting water vapor if it was placed in the floor. Stomata located on upper leaf surface would greatly increase water loss from plants via natural convection.
SR