Dr Ryan Maue of Weatherbell follows the data, wherever that data leads him. He’s not shy of telling it like it is. Yesterday he released what I consider the most important graph of the year.


For all those people that want to claim 2015/2016 “proves” that human caused global warming is at work (while at the same time ignoring a record El Niño event as seen above), this graph indisputably proves that the El Niño is the driver of record high temperatures, not carbon dioxide.
He wrote this on Twitter while providing the graph below.
Easy to see effect of El Nino on global temps by concurrently plotting tropical & global temp anomaly time series

And added:
Tropical temps increased relative to normal from April to Oct during El Nino onset. Global temps caught up in October. In sync since.
Pretty definitive, in my opinion.
Note: based on comments, the first ENSO event graph caption was updated to clarify it, and a second SST graph was added for those who prefer that representation of the ENSO event.
I was reading an article a few weeks back about coral bleaching caused by El Nino’s on the Great Barrier Reef and the accepted belief that it takes approx 12 years for the coral reefs to recover from a major bleaching event. So I thought I would have a look into the El Nino years and strengths based on NOAA’s data since 1950. According to their data it’s clear that El Nino’s have not become more regular over the last 70 years. There is also an interesting trend though with the strong El Nino’s and whilst they appear to be getting stronger the occurrence of strong El Nino’s are getting further and further apart. The years between each strong El Nino since 1950 is 7,8,10,15 & 18 years apart which suggests the next strong El Nino will not happen until 2034 or later.
There’s different mechanisms that cause bleaching on the GBR.
The 1997-1998 bleaching event was related to the El Nino, but the 2001-2002 bleaching event was slightly worse, and fell on a fairly neutral ENSO time. The 2005-2006 bleaching event of the southern reef, especially around Keppel Islands affected a geographically smaller area, but was very devastating to that area, with 98% bleached on some reefs. That occurred during a moderate La Nina. The BOM attributes all those events to sea temperature.
The 2008-2011 bleaching events were climate related, but not warm water related. They were caused by extremely high rainfall in Queensland causing freshwater bleaching.
So as temperatures increase, you will increasingly see bleaching outside the El Nino years, and changes to rainfall are attacking the reef by a different mechanism.
So no global weather apocalypse until I’ve already decomposed? … wow … that’s a bit of a blow.
They’re doing an air survey of Townsville area reefs this week to try and find indications of any shallow water bleaching, if present. I doubt they’ll find much, it didn’t get anywhere near the 1998 event heat levels on the QLD coast this year, not even close. Nor have we had large flood rain plumes.
12 years recovery time sounds very overstated, recovery takes less than half of that time in my experience. And even if there was a problem with rising bleaching events corals propagate in water column and warm-adapted varieties will just move further south and will do so with greater benthic diversity than prior, as warmth tends to promote. 12 years would be about 11 years more than needed for that colonization to take place so plenty of time for mobile colonization of heat-adapted northern coral further south.
There’s a bit too much nonsense and hype emanating from AIMS and its reports these days.
Curious George.
It takes up to 50 years for coral to recover from total evaporation at 55,000 degrees, from Nuclear bomb, to growing like a forest and in pristine condition- Bikini Atoll.
Actually it may be much quicker but it was only in 2008 that a team of scientists went to have a look,
http://www.livescience.com/2438-bikini-atoll-corals-recovering-atomic-blast.html
With 42 species of coral having gone locally extinct.
“Locally extinct”?
That sounds like typical alarmism. Juvenile coral polyps drift throughout the ocean. No ‘local’ part of the ocean is going to have zero corals. At least, not due to the usual “carbon” claims.
I smell grant trolling — if there’s even a paper claiming corals are ‘locally extinct’. Or maybe it’s just another baseless assertion.
The graph of historical TSI (over the last 400 years) from SORCE suggests to me that most of the warming we’ve had is not from humans:
http://lasp.colorado.edu/home/sorce/data/tsi-data/
The graph of the historical TSI shows that we should have been cooling since the middle of the 1900s, unless there’s some other influence going on.
http://lasp.colorado.edu/home/sorce/files/2011/09/TIM-TSI-Reconstruction1.jpg
To most people that would suggest that humans a likely primarily responsible for the warming since then, in the absence of other explanations.
Five of the six TSI peaks greater than 1361.5 Wm-2 occurred post the middle of the 1900s. The sea with its great heat capacity is the main recipient. Seems to tell me a different story to your conclusion.
tonyM wrote Five of the six TSI peaks greater than 1361.5 Wm-2 occurred post the middle of the 1900s. The sea with its great heat capacity is the main recipient.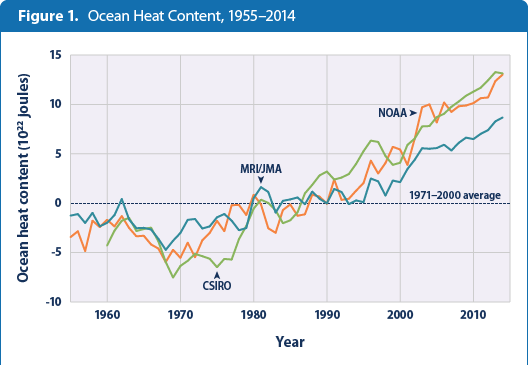
Lets then look at the oceanic heat content. Was it’s fastest increase in 1950, with lower increases occurring since then on the 11 year solar cycle?
Nope. Pretty much constant warming with no evidence of the 1 year cycle.
Is this to be expected? Well the change in solar irrandiance since 1750 represents a forcing of less than 10% of that represented by the enhanced greenhouse effect:
http://www.realclimate.org/images/ar4_fig_spm_2.png
So yes. Pretty much as expected.
Seth:
You say:
“Nope. Pretty much constant warming with no evidence of the 1 year cycle. ”
Nope, wrong and I don’t need glasses to see minima and varied positive slopes.
My response was to your claim that the:
“…historical TSI shows that we should have been cooling since the middle of the 1900s, ”
Note your word “COOLING!” Your claim does not hold water!! It is confirmed by your second set of graphs which shows an increase in T since the middle of the 1900’s. I said nothing about a fastest increase in the 1950 year nor about 11 year cycles. Nor did I say anything about linear relationships. In any case, you might do well to study some of Dr Evan’s work in this area if that is your problem.
It seems your approach is to conflate, obfuscate and distort comments as you have. Similarly for the boxed chart. Has nothing to do with my comment or 1750 but if you believe in your numbers perhaps you can go away and figure out why the models all fail and pass on your findings to the modellers.
tonyM says:
I said nothing about a fastest increase in the 1950 year nor about 11 year cycles. Nor did I say anything about linear relationships.
Seth does that all the time. It’s deflection, due to the fact that he has no credible answer.
These guys are desperatley searching for the “human fingerprint of global warming”, but they can never find a credible fingerprint. So they argue via assertions and beliefs.
I’m sure some of them believe in what they’re saying. But if they believe they’re doing honest science, they’re flat wrong.
Here lies the problem with this post. The claim is that the graph proves AGW not to blame. (One-graph-proves-that-record-high-year-of-2015-and-record-months-of-2016-are-not-agw-driven).
It has been claimed here that this last El Nino was not “super El Nino”. Yet temperatures were higher than after the last big El Nino in 97/98. This is evidence that there is an underlying temperature rise. Maybe not conclusive, but certainly supporting evidence.
Old seadog and others counter that this does not prove the rise is anthropogenic. True, but there is no way this graph can prove it is not, as claimed by the title.
The title of the post is wrong.
When you get your own blog, you can choose the titles.
Seems he was simply pointing out the absurd. I’m sure he’d back your right to be absurd …
So far nobody has offered any proof that the record 2015 ENSO event is not the main driver of record temperatures in 2015. Without that, the pause would likely have continued. Look at the first two years of Maue’s graph.
Anthony:
The “pause” was simply waiting for any EN to come along to end it .
But until modern times they didn’t move us into higher territory without a cyclic return via a Nina period..
it is in the record…..
http://www.scilogs.de/klimalounge/files/gistemp_nino_100.jpg
That plainly shows PDO/ENSO riding an underlying warming trend.
Toneb says:
That plainly shows PDO/ENSO riding an underlying warming trend.
An underlying natural warming trend.
Because the Null Hypothesis has never been falsified…
“So far nobody has offered any proof that the record 2015 ENSO event is not the main driver of record temperatures in 2015. Without that, the pause would likely have continued. …”
~ AW ~
?? And without the extraordinary spike of the ’97/’98 EN there would be no pause to begin with. Are you dismissively claiming the ’97/’98 EN caused the pause?
John@EF,
” And without the extraordinary spike of the ’97/’98 EN there would be no pause to begin with. Are you dismissively claiming the ’97/’98 EN caused the pause?”
Nonsense! We don’t need the 97/98 El Nino to demonstrate a pause. The pause is just as convincing if you take the data starting in 2001: http://www.woodfortrees.org/plot/rss/from:2001/to:2016/plot/rss/from:2001/to:2016/trend
Besides:
“For a lot of the last 10 years the Global Worriers have been claiming that we can’t start a pause with an El Nino. So why is it OK to stop a Pause with one?”
This is a quote from Joanna Nova
The point is that it’s misleading, not that it’s unintentional.
Can anyone please locate the dog that isn’t barking, the global direct mapping of CO2 concentrations from the now nearly 2 year old OCO-2 satellite?
The mission to make “global measurements of atmospheric CO2 with the precision, resolution, and coverage needed to characterize sources and sinks on regional scales”, in other words to identify (and shame?) the anthropogenic sources of demon “carbon” seems to have gone into eclipse.
Is the data proving to tough to cook?
One graph proves that record high year of 2015 and record months of 2016 are not AGW driven
El Nino is one mechanism in the overall transfer/flow of energy through the system. Overall the mechanics are chaotic (or produce chaotic trajectories), and one graph can not “prove” much of anything. It is evidence that global warming events lag El Nino events, which is pretty much what you expect if El Nino entails the transfer of energy to the atmosphere from the oceans.
Somebody touched a nerve …
The Absurdists are Rising.
I’ve been reading here and elsewhere for some months now that the current el Nino is not as strong as the 97/98 one. Then February happened.
So, with a weak solar cycle, and by the reasoning in the article, the current el Nino is now considered the strongest on record?
A lot of people are going to be revising their opinions it would seem. I wonder if they’ll notice that they’ve done so.
barry,
So a one month blip in global T has you convinced it was caused by manmade emissions?
Really?
Who said that? Not me.
Do you think the current el Nino is stronger than 97/98?
DB: “So a one month blip in a physically meaningless global T has you convinced it was caused by manmade emissions?”
Fixed it for ya 😉
Thanx, that’s what I meant.
Most climate scientists agree in the consensus saying that human activities have probably caused most of the warming we have experienced in the last 2- 3 decades. We can discuss whether the majority actually is as high as 97%, but there is no doubt that a majority has that opinion.
On the other side, I don’t think you can find many scientists who think that the record high temperatures over a few months proves anything at all. I doubt that you can find any serious scientist at all who would say that.
El Nino has no doubt caused the warming in the recent months.
However, AGW has probably caused the temperature level
we have experienced in the last decades.
This temperature level was the starting point for the last El Nino, and that is the reason why a normal event like El Nino, now causes record high temperatures.
That is at least how I see it.
Regards
/Jan
I see it that way, Jan. Unless one is denying that CO2 is a greenhouse gas, the globe will continue to warm. How quickly may be debated, but as long as the GHE is accepted no one should be surprised or shocked when a big el Nino brings record temps from occasional spikes over a long-term warming trend. We’ll see troughs and peaks, periods when warming seems to have slowed down or accelerated, but that’s just oscillations around the trend, and the long-term trend is what matters. The fertile ground for debate is the rate of that change. Anything else misses the woods for the trees.
I fully agree Barry.
As I see it, the AGW is real, the question is how large the climate sensitivity is and what consequences some warming will have. I think the debate would be more interesting if more people accepted this as the starting ground for the discussion.
I see that my link was broken. I tried to link to http://www.csens.org
I have generated some time series there which I think give an interesting overall picture.
/Jan
For all those people that want to claim 2015/2016 “proves” that human caused global warming is at work (while at the same time ignoring a record El Niño event as seen above)
These remarks are strange.
Pretty much every article I read, news and research, mentioned the lift to temps from the el Nino. Some even tried to quantify it. I’ve just googled “record global temperature” and every article of recent events more than 3 paragraphs mentions it. Comments here, prior to February, over and over referred to the attention the ‘opposition’ was giving to the el Nino. There was no “ignoring” of it. We were all talking about it. So was the press and research outlets.
For months prior to February, commenters here were scorning articles and mentions of a “Godzilla” el Nino. The narrative then was that the el Nino was being hyped, and Bob Tisdale was arguing that it was weaker than 1997/98.
So do people here now believe that this was a “Godzilla” el Nino after all, and that its strength eclipses the one in 97/98?
If you run a linear regression for RSS TLT from 1979 to 1997 (incl), the trend estimate is 0.08C/decade.
If you run a linear regression for RSS TLT from 1979 to 1998 (incl), the trend estimate is 0.15C/decade.
The trend is nearly twice as much just by adding one year.
The periods for those two trends are 20 and 21 years respectively.
Clearly, using such time periods to estimate a trend in the RSS data is specious, especially if one end of the trend sports a very high anomaly. Same goes for the 18 years 1997-2015 (incl). Not to mention that all these trends fail to achieve statistical significance.
All the talk about a pause, and the current rumblings about a warming trend since 1998 have always been, and still are, premature. You need more data, and not just from one slice of the climate system if you want to get a decent fix on global warming or not.
All the talk about [no] pause…
…began during the past few months with the newest talking points:
1. There never really was a ‘Pause’, and
2. Satellite data is NFG.
All the same data on both has been available for the past couple of decades. But until last year the overwhelming ‘consensus’ has been the universal attempt to explain why global warming stopped for so many years.
The number of attempts to explain why the warming stopped is around 60 now. They were suggested by the same alarmist crowd (IPCC) that accepted the fact that global warming had stopped.
But then, the new talking point #1 appeared. So now they are lying outright, claiming that global warming had never stopped.
Since the same data has always been available, the conclusion is obvious to even the most casual observer: the eco-lemmings have all turned 180º, and they now contradict what they were saying only last year — and the year before, and the year before that, etc.
The alarmist crowd has no credibility because they will ‘Say Anything’, rather than admit that the hated skeptics have been right all along.
If you say so db