Guest Post by Bob Tisdale
It should come as no surprise that surface temperature products are showing record highs for the meteorological year of December 2014 to November 2015 and that lower troposphere temperature products are not.
This post illustrates the meteorological year (December to November) temperature anomalies for the lower troposphere from RSS and UAH and the land-ocean surface temperature products from NASA GISS, NOAA NCEI and UKMO HADCRUT4. Temperature anomalies are referenced to the base years of 1981-2010.
I have not discussed the specifics of each product in this post. If you’re new to the global temperature products presented here, see the dataset descriptions in the November 2015 Global Surface (Land+Ocean) and Lower Troposphere Temperature Anomaly & Model-Data Difference Update.
LOWER TROPOSPHERE
We illustrated the annual (January to December) lower troposphere temperature data in the recent post here. The meteorological-year (December to November) lower troposphere temperature anomalies from RSS (data here) and UAH (data here) are shown in Figure 1. Like the annual data, they too show that the 2015 values came in a remote 3rd warmest for both products.

Figure 1
Then again, lower troposphere temperature anomalies are expected to rise sharply in 2016 in a lagged response to the 2015/16 El Niño. See the post Evolutions of Global Surface and Lower Troposphere Temperature Anomalies in Responses to the 1997/98 and 2015/16 El Niños.
LAND AIR + SEA SURFACE
Figure 2 includes the meteorological-year (December to November) land air plus sea surface temperature anomaly data from GISS (data here), NCEI (data here) and UKMO (data here). All three are showing record warm years in response to the 2015/16 El Niño.

Figure 2
NOTES: We discussed the primary reason for the 2014 record high (or near record high) surface temperatures numerous times. See the series of posts about The Blob. The cause of The Blob and its impacts on global surface temperatures were also discussed in the chapter titled General Discussion 2 – On the Claims of Record-High Global Surface Temperatures in 2014 in my (free) ebook On Global Warming and the Illusion of Control – Part 1 (25MB). Also in the book, see the chapter General Discussion 3 – On the Reported Record High Global Surface Temperatures in 2015 – And Will Those Claims Continue in 2016?, which is an expansion of the September 2015 post Tired of the Claims of “Warmest Ever” Month and Year? They Will Likely Continue Next Year.
LOWER TROPOSPHERE VERSUS SURFACE TEMPERATURE PRODUCTS
Figure 3 compares the lower troposphere and surface temperature products, including all five datasets. I’ve averaged the lower troposphere temperature datasets and the surface temperature products in Figure 4.

Figure 3
# # #

Figure 4
I don’t recall ever presenting lower troposphere and surface temperature comparisons where the data are smoothed with 5-year running-mean filters. See Figure 5. Global temperature data suppliers often use 5-year running-mean filters to reduce the annual wiggles associated with El Niño and La Niña events and with explosive volcanic eruptions (like El Chichon in 1982 and Mount Pinatubo in 1991).

Figure 5
The divergence between the two metrics stands out over the past decade. I’ll let you speculate about that graph.
NOTE: Gavin Schmidt, Director GISS, recently acknowledged that lower troposphere temperatures are supposed to be warming at a faster rate than surface temperatures. See the WattsUpWithThat post here.
CLOSING
As soon as the surface temperature data suppliers furnish their December 2015 updates, I’ll provide a post similar to this.
NOAA is showing here that they will be releasing the December 2015 (and l likely annual) data on January 20, 2016. I suspect we’ll see combined NOAA/GISS online press conference like last year, with all sorts of alarmist hoopla being generated by the mainstream media about surface temperatures…while overlooking the lower troposphere temperatures.
Discover more from Watts Up With That?
Subscribe to get the latest posts sent to your email.
Up thread comments were made about how GISS has been changed. Here’s a couple of examples.
(I hope it post correctly.)
Jan 4 2012
Year Jan Feb Mar Apr May Jun Jul Aug Sep Oct Nov Dec J-D D-N DJF MAM JJA SON Year
2010 69 75 85 76 65 56 49 53 54 63 72 43 63 65 68 76 53 63 2010
Jan 2015
2010 73 79 92 87 75 64 61 65 62 71 79 49 72 73 72 85 63 71 2010
1/4/12
1936 -20 -28 -14 -11 -9 -7 11 1 -2 5 6 10 -5 -7 -20 -12 2 3 1936
Jan 2015
1936 -28 -39 -24 -20 -15 -18 -5 -11 -5 -2 -4 -2 -14 -16 -29 -20 -11 -3 1936
The “Jan 2015” numbers are from Bob’s link.
The “Jan 4 2012” numbers are from copying Bob’s link into the “Browse” part of TheWayBackMachine.
( http://archive.org/web/web.php )
Many here know that such changes (adjustments) have happened. But for those who don’t, have a look and see the fiddling for yourselves.
PS 2012 is AFTER Hansen started playing with the “official” GISS numbers. Who knows what they were before then.
Something besides the internet might need to be consulted. (I believe they are called “books”.)
Sorry Gunga..it failed !!
I just tried it again and it worked fine.
Gunga Din:
You rightly say
I think it is easier to look at pictures than at numbers so I direct them to this.
I hope that helps.
Richard
Harry Twinotter says: “You are basically arguing that it is warmer because it is warmer. I think most climate scientists will agree with you on that one.”
Harry, you’ve been hanging out at Miriam O’Brien’s HotWhopper for too long (or maybe you’re Miriam O’Brien, a.k.a. Sou) because the nonsensical “warmer because it is warmer” argument is one promoted by Miriam. Because you appear to have trouble comprehending my arguments, let me set the record straight for you. My arguments have been and continue to be that natural variability plays a very large role in global warming and that the climate science community still cannot differentiate between natural and anthropogenic warming.
Harry Twinotter says: “You want to claim that the satellite record is superior and the surface record should be ignored…”
Wow, Harry, you just make up crap as you go along. Please advise where I wrote or implied that “…the satellite record is superior and the surface record should be ignored…”. I stated in the post regarding Figure 5:
The divergence between the two metrics stands out over the past decade. I’ll let you speculate about that graph.
NOTE: Gavin Schmidt, Director GISS, recently acknowledged that lower troposphere temperatures are supposed to be warming at a faster rate than surface temperatures. See the WattsUpWithThat post here.
Harry Twinotter says: “Meanwhile ignore what Dr Roy Spencer says, and Carl Meares [sic] says. The scientists actually collecting the satellite data know nothing, don’t they?”
Even more make-believe from you, Harry. Please link where Roy Spencer and Carl Mears have stated that they know nothing.
And now for the most nonsensical portions of your reply:
Harry Twinotter says: “Look, I know who you are and what your agenda is. You are what is know [sic] as a ‘fake expert’.”
Obviously, if the only way you can define me is as a “fake expert”, Harry, then you have no idea who I am or what my agenda is. And, if you believe I’m a fake expert, then you should stop reading my posts, Harry. Based on your comments to me on this thread, you clearly do not understand what I’ve written or presented, and you clearly cannot comprehend my “agenda”.
Harry Twinotter says: “No, you are are [sic] spinning from the very first paragraph. You poorly present some data, and then pad it out with speculations.”
My opening paragraph reads: It should come as no surprise that surface temperature products are showing record highs for the meteorological year of December 2014 to November 2015 and that lower troposphere temperature products are not.
There’s no spin in that. Recall that you, Harry, had to ask “OK please tell – why is it not a ‘surprise’?” If you don’t understand what I’d written, then common sense dictates that you, Harry, can’t claim it’s spin. Then again, common sense is something that eludes you, Harry.
Please illustrate and discuss, Harry, how I “poorly present” the RSS, UAH, GISS, NCEI and UKMO meteorological year data. And please quote what you believe to be speculation on my part that I have already not replied to.
Goodbye, Harry. If you haven’t figured it out yet, you’re wasting your time here. If I can make a suggestion, go back to Miriam O’Brien’s HotWhopper and falsely claim victory here at WUWT. They’ll love you for it. Here at WUWT, you, Harry, simply make me laugh. Thanks.
Adios.
Bob Tisdale.
Explain the shape of your graphs for the years 2010 to the end of 2015. Both the synthesized TLT estimates and the surface estimates.
It should be easy for you, considering you feel you know better than the scientific community.
Harry Twinotter, you haven’t yet replied to my requests of you in my reply to you above. Yet for some reason you’re back here at WUWT requesting that I respond to your request of: “Explain the shape of your graphs for the years 2010 to the end of 2015. Both the synthesized TLT estimates and the surface estimates.”


This is the last time I’ll play along with your one-sided game.
First thing to note is that you stated above that I “poorly present some data”, yet you’re asking me to use those graphs in response to your latest comment. To those who bother to read your comments on this thread, Harry, you’re going to come across as confused and foolish. But that’s your choice, Harry.
Be that as it may, the variations in the lower troposphere and surface temperature records are easy to explain from 2010 to present. But since you, Harry, apparently do not understand what causes the basic wiggles, I’ll explain them for you. Then again, you have no wish to understand, which is why I’m really writing this for people reading this thread who want to learn.
Let’s start with the lower troposphere data. I’ve added the annual grid lines to make it easy for you to follow along, Harry.
There was a moderately strong El Niño event (El Niños are naturally occurring, sunlight-fueled events) that evolved in 2009 and decayed in 2010. Due to the time lag in the response of the lower troposphere data to an El Niño, the lower troposphere temperature anomalies peaked in 2010. The 2009/10 El Niño was followed by back-to-back La Niña events: the first one in 2010/11 was stronger than the second one in 2011/12. As a result, lower troposphere temperature anomalies were depressed in 2011 and 2012. The 2012/13 and 2013/14 ENSO seasons were ENSO neutral (no El Niño and no La Niña) so lower troposphere temperatures rebounded in 2013 and 2014. A weak El Niño developed during the 2014/15 ENSO season, so the 2014/15 El Niño conditions along with The Blob (a naturally occurring warming event in the eastern extratropical North Pacific according to NOAA) and the further development of the 2015/16 El Nino helped to cause lower troposphere temperature anomalies to rise again in 2015. And as I’ve stated in the article above, lower troposphere temperatures should spike in 2016 in response to the 2015/16 El Niño.
Let’s add the surface temperature data to the graph, Harry. Again, I’ve added the annual grid lines to make it easier for you to see. As you’ll note, I’ve presented the averages of the surface temperature reconstructions and the lower troposphere temperature composites.
The first thing that stands out in the comparison is that the lower troposphere temperature data have much greater variations in response to the El Niño and La Niña events. I explained the reasons for this above in my reply to a question by Phil R:
http://wattsupwiththat.com/2016/01/08/138002/#comment-2115384
Let me repeat it for you here, Harry.
Phil R, the lower troposphere warms in two ways during an El Nino. First, it warms in response to the warming surfaces globally.
Second has to do with how an El Nino releases most of its heat…and that’s through evaporation in the tropical Pacific. During an El Nino, the surface of the tropical Pacific is warmer than “normal”. As a result of the warmer surfaces, there is more evaporation taking place in tropical Pacific. The warm moist air rises, and it condenses and forms clouds as it rises into the cooler atmosphere. When it condenses, it releases heat to the troposphere. Thus the greater response of troposphere temperatures than surface temperatures.
[End of earlier comment.]
If you, Harry, would like an overview of the naturally occurring processes that cause global surface temperatures to warm outside of the tropical Pacific during an El Niño, refer to Trenberth et al (2002):
http://www.cgd.ucar.edu/cas/papers/2000JD000298.pdf
Trenberth et al (2002) also discuss how the warm water for El Niño events are created during La Niña events through a reduction in cloud cover over the tropical Pacific, which permits sunlight to reach into and warm the tropical Pacific, replenishing the heat released during the previous El Niño. Thus my earlier statement “El Niños are naturally occurring, sunlight-fueled events”.
Back to our discussion of ENSO and lower troposphere temperatures:
The opposite holds true for a La Niña, Harry. The lower troposphere cools in two ways during a La Niña. First, it cools in response to the cooling surfaces globally.
Second, during a La Nina, the surface of the tropical Pacific is cooler than “normal”. As a result of the cooler surfaces, there is less evaporation taking place in tropical Pacific. Less evaporation means less heat is released to the lower troposphere than normal during a La Niña. So that helps to explain for you, Harry, why the lower troposphere cooled more from 2010 to 2011.
But there is another reason the surface temperatures did not cool as much as lower troposphere temperature anomalies during the transition from the 2009/2010 El Niño to the 2010/11 La Niña, Harry. And that reason has to do with the leftover warm waters from the 2009/10 El Niño.
As part of phenomena called downwelling Kelvin waves, a strong El Niño transports a tremendous volume of warm water from the western equatorial Pacific to the eastern equatorial Pacific, where some of it rises to the surface through upwelling and is carried away from the equator due to the Coriolis effect. Some of the warm water is carried poleward along the west coasts of the Americas in coastally trapped Kelvin waves.
At the conclusion of the El Niño, that warm water doesn’t just disappear, Harry. The leftover warm water that’s on the surface is carried west by the trade winds where it initially warms the surface of the West Pacific Ocean and the Eastern Indian Ocean. Nor does the leftover subsurface warm water disappear. It’s returned to the western tropical Pacific through slow-moving (off equatorial) Rossby waves. It eventually rises to the surface of the West Pacific and Eastern Indian Oceans and along with the leftover surface waters they’re transported through ocean currents to the South Atlantic.
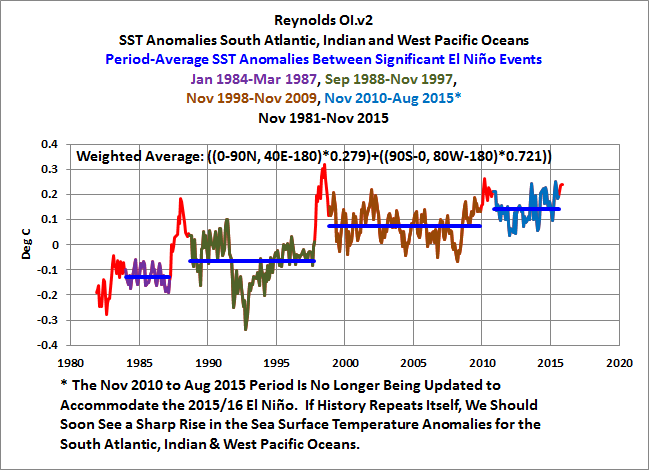
That’s why the surface temperatures of the South Atlantic, Indian and West Pacific Oceans warm in steps in responses to strong El Niño events, Harry.
I present that graph in my monthly sea surface temperature updates. The November 2015 update is here:
https://bobtisdale.wordpress.com/2015/12/07/november-2015-sea-surface-temperature-sst-anomaly-update/
Those steps are also known as Trenberth “big jumps”. See the posts here:
https://bobtisdale.wordpress.com/2014/05/20/the-201415-el-nino-part-9-kevin-trenberth-is-looking-forward-to-another-big-jump/
And here:
https://bobtisdale.wordpress.com/2013/06/04/open-letter-to-the-royal-meteorological-society-regarding-dr-trenberths-article-has-global-warming-stalled/
Just in case you, for some unknown reason, don’t like Reynolds OI.v2 sea surface temperature data, Harry, here’s the same graph using the UKMO HADSST3 data, which is the ocean portion of the UKMO HADCRUT4 land-ocean surface temperature data.
Trenberth with his “big jumps” in global temperatures is admitting that strong El Niño events contribute naturally to long-term global warming, but he simply hasn’t taken the time to show and explain the processes through which they do. On the other hand, I have. Once again, see the post here:
https://bobtisdale.wordpress.com/2013/06/04/open-letter-to-the-royal-meteorological-society-regarding-dr-trenberths-article-has-global-warming-stalled/
Back to the discussion of the comparison of lower troposphere and surface temperature anomalies:
You’ll note that the surface temperature and lower troposphere temperature data run in parallel from 2011 to 2015, so my earlier explanation of the variations in lower troposphere also apply to the surface temperature data as well.
However, you’ll note the surface temperature data show a stronger uptick in 2015. That uptick is the combined effects of The Blob, the 2014/15 El Niño conditions and the initial impacts of the 2015/16 El Niño. And you can see the stronger uptick in the surface temperature data in 2014 as well. That, of course, is a response to The Blob. I showed with time-series graphs how The Blob was responsible for reported record high surface temperatures in chapter “General Discussion 2 – On the Claims of Record-High Global Surface Temperatures in 2014” in my (free) ebook:
https://bobtisdale.files.wordpress.com/2015/11/tisdale-on-global-warming-and-the-illusion-of-control-part-1.pdf
If you’re not aware of it, the climate science community understands that The Blob is a naturally occurring warming event. See Bond et al (2015):
http://onlinelibrary.wiley.com/doi/10.1002/2015GL063306/pdf
In fact, NOAA discusses The Blob repeatedly in their Monthly Ocean Briefing:
http://www.cpc.ncep.noaa.gov/products/GODAS/ocean_briefing_gif/global_ocean_monitoring_current.pdf
NOAA just hasn’t bothered to explain that The Blob was the primary reason for the record high surface temperatures in 2014…and that it contributed to the record highs in 2015.
Harry, you wrote, “It should be easy for you, considering you feel you know better than the scientific community.”
Where have I ever stated that I “know better than the scientific community” what causes the annual variations? Once again, Harry, you’re making up crap as you go along.
Now, I understand I presented a lot for you to comprehend in this reply. If you try to understand it, it should take you a couple months to grasp everything presented and linked. So in a couple of months I’ll be happy to reply to more of your comments. You’ll also need to reply to my earlier requests of you. See my January 9, 2016 at 4:52 am comment here:
http://wattsupwiththat.com/2016/01/08/138002/#comment-2116268
Since I suspect you’re not going to try to understand (trolls like you normally do not) and since you’re not going to bother to reply to my earlier requests that you back-up your statements, I fear this is good-bye, Harry.
Bob Tisdale
Thank you for your comments and explanations above.
Perhaps my mental geography is off a bit, or perhaps (the lack of) deep ocean currents on my globe is cuasing the problem, but I’m stuck trying to resolve the apparent contradiction between the “traditional southern Pacific surface currents”: Warm tropical water flowing south towards Antarctica and cooling, then the cool water flowing back north along the Andean coast towards the equator, where it turns and heads west to be recycled. Do not those surface currents oppose the Kelvin and Rossby waves?
Or are the Kelvin and Rossby waves deep water (colder, saltier and thus denser water) separate from the surface (Coriolis-driven currents) like the Japanese current and Gulf Stream of our northern oceans are separate phenomena from the Trade winds and doldrums, and thus act in different latitudes and different environments?
Well Bob, I will try to respond. But a lot of what you write is a Gish Gallop which I take as rhetorical. I was taught in high school you do not answer rhetorical questions.
“Harry Twinotter, you haven’t yet replied to my requests of you in my reply to you above…”
You wrote the article, not me. I commented on it. I am under no obligation to respond to “requests”; you are the one making claims. I spotted something interesting in the 2010-2015 data, but for clarification I asked you to describe the data from your article.
OK I will respond to two questions about your article, or my comments on your article. Fire away, and give me your questions.
harry thinkotter;
“…Harry Twinotter says: “Look, I know who you are and what your agenda is. You are what is know [sic] as a ‘fake expert’.”…”
No evidence from Harry, just his insults.
Can’t take the science? Too much information for a ten second attention span? Harry theotter knows everything?
Not a chance. You are the one showboating harry. You are waving your arms, pointing at things and making odd claims to distract other folks from the thread of discussion.
Typical doom monger CAGW troll response.
– You commented, but you are under no obligation to defend your comments with answers… An absurd twist of logic.
– Bob has not made ‘claims’. Bob has stated the science and provided the data along with extensive explanations.
– Harry refuses to read anything extensive or provide anything beyond insults and absurd statements based on false interpretations of data.
– Harry recognizes no history unless it has been fully maladjusted by GISS and BOM.
– Harry recognizes no data from satellites, no matter how accurate, because satellite data does not suit Harry’s purposes.
– Harry gets stuck on barely warmer temperatures.
Barely warmer temperatures is fully compatible with global warming since the LIA (Little Ice Age).
Earth’s current temperature is significantly colder than recent Optimum Climate episodes since the last Ice Age.
Barely warmer temperatures are a definitive signal that temperatures are not in lockstep with CO2!
CO2 effects on temperatures are so small that identifying CO2’s exact effect is impossible!
* Arctic ice is within recent ice extents.
* Antarctic ice is well above average extent.
* Storms are not more frequent! Nor are they more powerful!
* Weather is well within normal patterns and temperatures.
* Rainfall is within normal levels and frequency.
* Polar bears are not endangered; in fact they’re downright abundant!
* Penguins are only in danger from researchers that are all too willing to burden penguins with oversized and heavy radio gear.
* After being predicted incorrectly for a number of years, a relatively strong El Nino has finally occurred. Which happens to be a fairly normal weather phenomena in the Pacific. James Hansen predicted that there would be a super El Nino every year until he retired.
While El Nino’s have only been recently accurately tracked, by those satellites you hate; there is a long history of El Nino and La Nina weather effects indicating their cycles are well within normal variability.
Hi Bob,
Excellent work; do your best to keep that sense of humor with “Dr. DeHavilland”.
You’ll notice that nowhere has he bothered to actually answer any of your points. These are his tactics:
1) Misdirection; he’ll accuse you of ‘cherry-picking’ something, while telling you (asking you) to focus only on 2010 – 2015. I asked for a simple analysis of 750 million years of published, cited, vetted temperature vs. CO2, and was told that such analysis is a ‘non-sequitur’.
2) Never reading your posts, while accusing you of dodging his posts; notice I pointed out his serious mis-reading of ferdberple’s post, and he responds by telling everyone that I’m a ‘fan’ of his.
3) Raising a challenge, citing a source, but refusing to look at any source you cite, or responding to a challenge you raise (since, your challenge or source is “agenda-driven”, while his are “not agenda-driven”).
Of course good ol’ Dr. DeHavilland thinks that my appearance here at WUWT is new. He doesn’t know that on 06 March 2012, Anthony graciously published my analysis of why the Permian extinction was not the result of “global warming” caused by the Siberian diabase putting vast amounts of CO2 into the atmosphere, and ‘cooking’ the planet. He is unaware that I’ve been visiting Jo and Anthony for quite a few years now. His ego is such that he thinks I only started showing up here because he’s here, and he’s ‘flattered’.
Such is the mentality of the warmist-alarmist. Try to have some type of discussion with this individual, and you’ll be disappointed by the lack of intelligent response.
Interesting hypothesis you have there; I think he’s been accused of being Canadian; the time stamps on his posts tend to suggest he is not in the Australian time zone(s). Like most trolls, he has to hide behind the veil of secrecy. Now, before Dr. DeHavilland can accuse me of the same, I’ve posted most of my responses or comments under my actual name; one of our latest exchanges at Jo’s, he bestowed the moniker “Vlad the Impaler” on me, and so I adopted it immediately. I advised Jo and Anthony of the change, and both approved of it.
So, good luck playing this ‘large-mouth bass’; you’ll never land him, since he is incapable of admitting a mistake (see ferdberple’s post, way up-thread).
Peace be upon you Bob, and best regards,
Vlad the Impaler
Vlad the Impaler, thanks for the background info on Harry Twinotter/Dr. DeHavilland.
Vlad the Impaler.
Still at it I see – you don’t come to climate change conspiracy blogs for a discussion about climate change, do you?
“I asked for a simple analysis of 750 million years of published, cited, vetted temperature vs. CO2”.
Is that all? That is 0.75 BILLION years. Why stop there, why not extrapolate right back to the Big Bang?
Hello, Dr. DeHavilland (“Harry Twinotter”):
Oh, au contrare, my dear Professor. I DO come to “… climate change conspiracy blogs …” to discuss climate, climate change, paleodata, and the like. I’ not sure exactly WHY you’re here; it certainly isn’t to engage in any kind of discussion. Notice that many of the participants in this “… climate change conspiracy blog … ” ask each other questions, give answers, point to sources (which participants refer to), and generally elevate the level of discussion. It looks a lot like Jo’s, where Dr. Evans’ hypothesis has undergone some extensive peer review.
You show up, refuse to answer questions posed to you, make accusations (” … you don’t come to climate change conspiracy blogs for a discussion about climate change, do you?”) (“I don;t believe you’re a scientist”, even though I provided the link to the State agency which licenses me), then drive off to the next discussion to spray some undeserving vitriol (and you know you have referred to skeptics, such as myself, using the “D” word, as Jo’s moderators have cautioned you).
I would enjoy a spirited discussion on climate change; if you like, we can indeed go back to the origin of the Universe; unfortunately, all that does is prove that the skeptical side is right — — the only CONSTANT in the whole of the Universe is CHANGE. The Universe evolves, things change, stars create the elements heavier than Helium in stellar nucleosynthesis, which recycles into new stars which start using the CNO fusion process, … … … …, and then at some point, a proto-solar nebula condenses into what we will come to know as ‘our Solar System’, and ‘our planet, Earth’.
The climate of the Earth has always changed; what’s so unusual about this ‘change’?
Since it is a difficult concept for you, I’ll be happy to help out. We should examine 750 m.a. worth of data, as these data are a longer record than some 150 – 200 years of data, give or take. If the present is the key to the past, then the past is the key to the future. Look at the past, see what happened before, when it happened, why it happened. It’s called “science”. Observing, hypothesizing, testing, refining, and then starting over. It’s a process. It’s a body of knowledge. It’s a way to try to understand. It is never settled, or static; science itself changes constantly.
I note that above, Bob asked you some questions; as usual, you ducked them. I asked a question; you refused. My guess is that you actually looked at Veizer vs. Berner & Kothavala, and knew the gig was up. There is no correlation between ‘temperature’ and atmospheric CO2 concentration, other than it appears that temperature may drive CO2 concentration; but that goes against your meme, that human activity is rapidly and catastrophically altering the global climate. By all means, let us discuss it. Don’t ask, ‘look at 2010 to 2015’, then accuse someone of cherry-picking. If anyone here cherry-picks, it is you. You think two centuries of data are more important than the whole of the Phanerozoic (give or take the Edicaran and Cryogenian). You accuse the ‘non-believers’ here of having an agenda, and engaging in conspiracy theories. This is not productive. Let us start with you answering Bob’s questions to you. We can work our way back to the question I posed some months ago (the famous, “non-sequitur”). The bad news for you is that it DOES follow! You claim that CO2 drives temperature; I say there is an indication that your hypothesis is inaccurate, and here are the data which contradict your position. Instead of providing some kind of analysis, you dodge (per usual) by accusing, “non-sequitur”; and just so you know, I learned the meaning of that way back in the early 60’s; when did you become enlightened?
Stick around here and Jo’s enough, and the enlightenment might happen. You have a question? I’ll bet someone is willing to answer it. You have a reference (other than SkS or “Real” Climate)? Present it to the group, let us discuss it with you. Have an analysis of some data? Put it out there; if your hypothesis is spot-on, believe that the participants here will support it; if it is spurious, you’ll know that too, but you have to be willing to have an open discussion about it, and not fling accusations.
Welcome to the discussion, Dr. DeHavilland; please jump in!
Regards,
Vlad the Impaler
Thanks, Bob, for the data view. As always, refreshing. I’m looking forward to your next report.
We are learning about the effects of ENSO, during the onset and the decay.
We are learning about the influence of oceans in local climates around the world.
Instead of endless arguments about the flaky atmospheric and surface temperature measurement data can’t we get a serious discussion of the ARGO ocean energy measurements. I regard the 0.42 watt/m2 power level as much more reliable since the spread in ocean temperature measurements has orders of magnitude less wild gyrations than the atmosphereic temperatures and besides the ocean represents 93% of all global warming power rather than highly vulnerable to noise response of the 7% of energy represented in the surface and atmosphere.
http://www.cbc.ca/news/canada/british-columbia/what-else-does-el-nino-have-for-us-1.3393850
It is so funny to watch this weather girl argue about El Nino with a graphic showing winter should have been dry and warm in the west, the perfect opposite of what happened!
No shame!
And she even dares to claim the 2015 El nino is bigger than the 1998.
With information like this in Canada’s public broadcaster…. who needs agitprop?
It looks like the remnant of the warm blob is sitting off the NW US coast, in the middle of the “split flow” of winds off the Pacific trough. The GODAS animation shows the blob dissipating during the offshore storms in December. Are we actually seeing the blob warming again, or is it just not continuing to chill (increasing anomaly)?
Why don’t we see a more pronounced spike in lower troposphere temperature in 1983?