Guest Post by Bob Tisdale
It should come as no surprise that surface temperature products are showing record highs for the meteorological year of December 2014 to November 2015 and that lower troposphere temperature products are not.
This post illustrates the meteorological year (December to November) temperature anomalies for the lower troposphere from RSS and UAH and the land-ocean surface temperature products from NASA GISS, NOAA NCEI and UKMO HADCRUT4. Temperature anomalies are referenced to the base years of 1981-2010.
I have not discussed the specifics of each product in this post. If you’re new to the global temperature products presented here, see the dataset descriptions in the November 2015 Global Surface (Land+Ocean) and Lower Troposphere Temperature Anomaly & Model-Data Difference Update.
LOWER TROPOSPHERE
We illustrated the annual (January to December) lower troposphere temperature data in the recent post here. The meteorological-year (December to November) lower troposphere temperature anomalies from RSS (data here) and UAH (data here) are shown in Figure 1. Like the annual data, they too show that the 2015 values came in a remote 3rd warmest for both products.

Figure 1
Then again, lower troposphere temperature anomalies are expected to rise sharply in 2016 in a lagged response to the 2015/16 El Niño. See the post Evolutions of Global Surface and Lower Troposphere Temperature Anomalies in Responses to the 1997/98 and 2015/16 El Niños.
LAND AIR + SEA SURFACE
Figure 2 includes the meteorological-year (December to November) land air plus sea surface temperature anomaly data from GISS (data here), NCEI (data here) and UKMO (data here). All three are showing record warm years in response to the 2015/16 El Niño.

Figure 2
NOTES: We discussed the primary reason for the 2014 record high (or near record high) surface temperatures numerous times. See the series of posts about The Blob. The cause of The Blob and its impacts on global surface temperatures were also discussed in the chapter titled General Discussion 2 – On the Claims of Record-High Global Surface Temperatures in 2014 in my (free) ebook On Global Warming and the Illusion of Control – Part 1 (25MB). Also in the book, see the chapter General Discussion 3 – On the Reported Record High Global Surface Temperatures in 2015 – And Will Those Claims Continue in 2016?, which is an expansion of the September 2015 post Tired of the Claims of “Warmest Ever” Month and Year? They Will Likely Continue Next Year.
LOWER TROPOSPHERE VERSUS SURFACE TEMPERATURE PRODUCTS
Figure 3 compares the lower troposphere and surface temperature products, including all five datasets. I’ve averaged the lower troposphere temperature datasets and the surface temperature products in Figure 4.

Figure 3
# # #

Figure 4
I don’t recall ever presenting lower troposphere and surface temperature comparisons where the data are smoothed with 5-year running-mean filters. See Figure 5. Global temperature data suppliers often use 5-year running-mean filters to reduce the annual wiggles associated with El Niño and La Niña events and with explosive volcanic eruptions (like El Chichon in 1982 and Mount Pinatubo in 1991).

Figure 5
The divergence between the two metrics stands out over the past decade. I’ll let you speculate about that graph.
NOTE: Gavin Schmidt, Director GISS, recently acknowledged that lower troposphere temperatures are supposed to be warming at a faster rate than surface temperatures. See the WattsUpWithThat post here.
CLOSING
As soon as the surface temperature data suppliers furnish their December 2015 updates, I’ll provide a post similar to this.
NOAA is showing here that they will be releasing the December 2015 (and l likely annual) data on January 20, 2016. I suspect we’ll see combined NOAA/GISS online press conference like last year, with all sorts of alarmist hoopla being generated by the mainstream media about surface temperatures…while overlooking the lower troposphere temperatures.
GISS and NOAA cooled off the Great El Nino of 1997-8 and cooked the most recent books in order to set “records”. In another 18 years, they’ll cool off the current El Nino if need be to manufacture fake record warmth.
Gloateus Maximus says, “GISS and NOAA cooled off the Great El Nino of 1997-8…”
Surface temperatures and lower troposphere temperatures respond differently to El Nino events. See my reply to Phil R below.
Cheers.
Bob,
I was comparing surface “data” sets with each other, not with the satellite record. Please explain why the Great El Nino still exists in the slightly less cooked HadCRU “surface record”, if not from GISS and NOAA cooking their books to a crisp.
Thanks.
Bob
I thought that it was well known that the 1997/98 data was cooled. This took place when there was a squabble as to whether 2010 was or was not the warmest year ever on record. I suspect that there have been further changes post 2010.
Probably, Steven Goddard has some interactive charts showing the cooling to 1997/98.
Richard,
Yup. GISS and NOAA drastically cooled the hot 1920s and ’30s, warmed up the cold ’40s, 50s ’60s and early ’70s and now have chilled the Great El Nino. HadCRU seems to have done so less, which was my point. Maybe not made well, since Bob misunderstood me.
All the surface based data sets are at it and they have cooled off El Ninos and warmed La Ninas. They have also changed their distribution of stations or observations/techniques around the Arctic to further increase the warming overall in the NH especially since 2001. It is no coincidence not long after 2001 the divergence becomes clear between surface and satellite. The ENSO has always shown to be stronger in the satellite data, but the weaker response in the surface data sets has also be reduced further. The changes are to increase chances that any El NIno in future will show a little higher peak, due to the simple reason previous ones were slightly reduced. This behavior can continue while duping the public into believing something that these con artists are trying to invent.
This is the example from hadcrut.
http://i772.photobucket.com/albums/yy8/SciMattG/NHTemps_Difference_v_HADCRUT43_zps8xxzywdx.png
Notice how only bit of adjusted significant cooling recently in numerous data points occur around the strong El Nino during 1997/98. The La Nina straight after was also warmed to reduce the natural trend in the data set. Warmer periods in the past have also been cooled and cooler periods in the past have been warmed. This is deliberate manipulation of data (cherry picking points) to reduce the natural changes in global temperatures. Just warming other data points that don’t involve El Ninos effectively reduces the influence the ENSO previously had.
Notice how they don’t cool very recent El Nino’s because they want to try and cause warming over the recent decade (‘the pause’) and try and create tampered yearly records.
But if the scam is still running in 15 years, the hucksters will cool the El Ninos from the 2000s and 2010s, too.
Exactly, because it’s all about trying to keep the current period the warmest and desperate measures have already been implemented.
Matt G, isn’t it curious that the biggest changes to HadCRUT4 start in the 90s when you’d think the data would be the best ever. The reason 3 and 4 diverge is supposed to be the addition of high altitude stations. If the departure is genuine, the only explanation I can think of is that the loss of sea ice affecting those high latitude stations. Basically the ice kept the temperatures low until it started melting earlier and earlier in the year. A bit like year long frost pockets. You can see a similar blip in the 40s. Is the temperature of the troposhere affected by that?
Gloateus Maximus, the reason HADCRUT4 data has a higher spike in 1997/98 appears to be on the sea surface temperature side, so it’s really a NOAA tweak. But that could be explained as the difference between a sea surface temperature dataset that’s not infilled (HADSST3) and one that is (ERSST.v4).
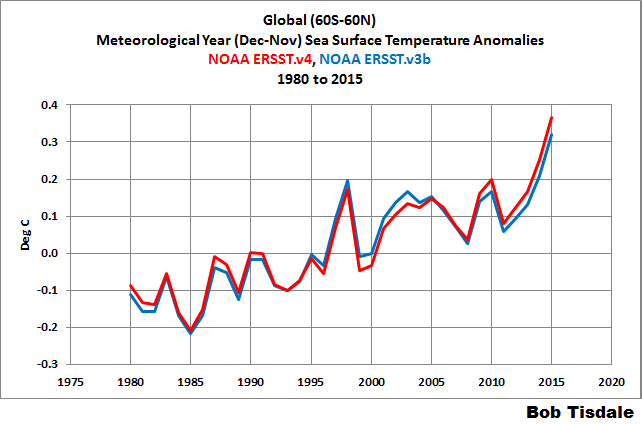
richard verney, I’ll agree. NOAA did suppress the 1997/98 warming in their new ERSST.v4 pause-buster sea surface temperature data, versus their former ERSST.v3b data. In fact they “cooled” the data from the mid-1990s to 2005…then tweaked it upwards from 2006 to present.
Cheers
Looking at the diff between Hadcrut 3 and 4, it’s no wonder people are suspicious.
http://woodfortrees.org/graph/hadcrut3gl/from:1980/mean:12/plot/hadcrut4gl/from:1980/mean:12
Bob,
The Stalinists “disappearing” data are not just at NOAA but also GISS.
As I recall correctly, the 98 El Nino was adjusted down in 2007, and 2007 was adjusted in 2010. Isn’t there an archive of all previous adjustments to the land/sst data sets?
It seems like the surface data stopped responding to La Nina’s in 2005 and all else is equal. Makes you wonder about the specifics.
to add — What made the temperature to stay high [jump] even after 1997-98 El Nino decayed? Is it that after each El Nino, rise in temperature maintain the rise in future? This jump clearly an indicator of coocking up of data to show there is a rise. Though this jump is not that high with the satellite data after 1997-98.
Dr. S. Jeevananda Reddy
Dr. S. Jeevananda Reddy, my most recent discussion of the jump in surface temperatures in response to strong El Ninos is here:
https://bobtisdale.wordpress.com/2014/05/20/the-201415-el-nino-part-9-kevin-trenberth-is-looking-forward-to-another-big-jump/
And see Chapter 3.7 of my (free) ebook “On Global Warming and the Illusion of Control – Part 1”:
https://bobtisdale.files.wordpress.com/2015/11/tisdale-on-global-warming-and-the-illusion-of-control-part-1.pdf
The discussion of how strong El Nino events contribute to long-term global warming begins on page 603 of the text (page 604 of the pdf).
Bob,
I apologize if this has been explained before and I missed it, but I’m curious about one thing. Both the 1998 and current El Ninos are supposed to be strong El Ninos, and simplistically, I would expect similar responses for the land+sea records and the Lower Troposphere records (within the groups, but not necessarily between them). What I’m curious about is, all else being equal (and I’m guessing it’s probably not), Why is there such a large spike for the Lower Troposphere records and a muted spike for the land+sea records in 1998 (and 2010, though less pronounced), but the reverse for 2015 (LT spike is muted and land+sea spike is larger)?
Why is there such a large spike
=========================
the surface temperature report had a similar spike until the latest “pause buster” series of adjustments.
Keep in mind, none of these graphs are showing actual temperatures. The are showing a report of what temperatures are believed to be. Not all belief is correct. It is subject to error, as are the underlying records.
Phil R, the lower troposphere warms in two ways during an El Nino. First, it warms in response to the warming surfaces globally.
Second has to do with how an El Nino releases most of its heat…and that’s through evaporation in the tropical Pacific. During an El Nino, the surface of the tropical Pacific is warmer than “normal”. As a result of the warmer surfaces, there is more evaporation taking place in tropical Pacific. The warm moist air rises, and it condenses and forms clouds as it rises into the cooler atmosphere. When it condenses, it releases heat to the troposphere. Thus the greater response of troposphere temperatures than surface temperatures.
Bob,
Thanks for the response. I guess the second part of my question would then be, why isn’t the lower troposphere response greater currently (e.g., Figure 4), or is it only because this cycle isn’t finished yet?
Don’t forget some key factors in how much of that heat actually gets transferred to the atmosphere; wind speed, low surface atmospheric pressure, and clear skies.
Phil R, the greater rise in lower troposphere temperatures in response to an El Nino typically occurs in the El Nino decay year, so we should see a spike in the lower troposphere temperatures in 2016.
Bob, with the RRR apparently vanquished, and the AMO turning down, do you think this El Nino will perhaps produce a smaller spike in global T?
BTW, it is interesting that Gavin admits that per CAGW theory, the troposphere as a whole, should warm 20 percent faster then the surface. This clearly makes the divergence even more damming for the highly homogenized surface record.
David A says, “Bob, with the RRR apparently vanquished, and the AMO turning down, do you think this El Nino will perhaps produce a smaller spike in global T?”
One can only hope.
While there had been reports that the RRR (ridiculously resilient ridge) has disappeared, NOAA’s GODAS T300 (depth-averaged temperature anomalies to 300 meters) maps are still showing elevated subsurface temperatures in the eastern extratropical North Pacific (caused by The Blob).
http://www.cpc.ncep.noaa.gov/products/GODAS/pent_gif/xy/movie.h300.gif
The NOAA CPC “Monthly Ocean Briefing” dated Jan 8 2016…
http://www.cpc.ncep.noaa.gov/products/GODAS/ocean_briefing_gif/global_ocean_monitoring_current.pdf
…mentions The Blob a number of times. On Page 38, they show the outputs of 2 long-term weather models. One shows The Blob dissipating soon, while the other shows it hanging around through the spring.
If the North Atlantic SSTa is going to have a sizeable rise in response to the 2015/16 El Niño, we should start to see it by boreal spring 2016. We’ll have to keep an eye on it.
The short answer is that the Super El Nino of 1998 was predominantly a 1997 event, and with lag this showed up most in the 1998 record.
It appears that the 2015 El Nino may be waning, but even if this is the case, it is likely that the satellite record will be most impacted in 2016 by the 2015 El Nino..
I always refer to the 1998 El Nino as the 1997/98 Super El Nino, because although it peaked in 1997, the satellite data was most impacted in 1998. I refer to it as a Super El Nino since one interpretation of the satellite data is that there was a long lasting step change in temperatures (of about 0.27degC) coincident with that El Nino.
One interpretation of the satellite data is that temperatures were essentially flat from inception in 1979 through to the run up to the 1997/98 Super El Nino (there is a slight positive trend but not statistically significant when one takes account of measurement uncertainties/errors), then there was a long lasting step change in temperatures of about 0.27degC coincident with that event, and following the Super El Nino temperatures have again been essentially flat (there is a slight negative trend but not statistically significant when one takes account of measurement uncertainties/errors).
Of course, this may be mere coincidence, and it does not explain why the step change in temperature has not dissipated these past 18 or so years.
Whilst one may expect to hear loud shrills that 2015 or 201 are the warmest year ever on record, in my opinion, whether the current strong El Nino will be judged to be a Super El Nino can only be answered in about 5 years time when we know whether it merely produced a short term peak (say similar to the 2010 El Nino which is entirely eradicated by a following La Nina with temperature anomaly settling once more at around the 2001 to 2003 level) or whether there is a long lasting step change in temperatures coincident with it, as appears the case with the 1997/98 Super El Nino. In my opinion, that is the acid test..
All of this may make writing AR6 very interesting; is it simply natural warming, is it a short term spike, is there a step change in temperatures, if there is no step change, then it is likely that the ‘pause’ will be more than 21 years in duration etc.
GT,
Heh, you answered my question before I asked it! I didn’t see your post before I posted mine.
If Ocean temperatures around the Great Barrier Reef were 1 C warmer during the “Climate Optimum” we still have a long way to go, but don’t get discouraged.
CO2 GHG theory requires that the atmosphere warm first, then the surface. What we are seeing is the opposite. While part of the explanation for this may lie in the “pause buster” adjustments, an alternative explanation is that something other than CO2 is causing the warming.
The simple fact is that we do not know the cause of the LIA cooling, and we do not know the cause of the warming that followed. The warming that continues to this day.
ferdberple,
Thanks for your comment. Can I assume that the atmosphere warms first under the CO2 GHG theory because the CO2 is dispersed through out the atmosphere so that the heat is “collected” though out the atmosphere not at the earth surface?
heat is “collected” though out the atmosphere
=====================
1. the CO2 molecule must heat up (capture IR) before it can radiate energy back to the surface. however most of the CO2 molecules that capture IR will instead lose this energy via conduction to surrounding O2 and N2 molecules, before the CO2 molecule can radiate back to the surface. thus warming the atmosphere more than the surface.
2. most of the warming under GHG theory is not due to CO2, it is due to increased water vapor feedback (3x amplification according to theory). This water cools the surface as it evaporates, and warms the atmosphere as it condenses. Thus the increased warming of the atmosphere as compared to the surface.
The density is higher at the surface, so there is more warming at the surface. It should raise the temps of solids at the surface the most.
Arron, ??
Yes, and also that the air should warm more than the surface, not just before it.
From every angle, the man-made GHG hypothesis has been falsified. Indeed, it was born falsified.
Roger R. D. Revelle himself figured that out and stated it before his death, but it was too late, Hanson and Strong had picked it up and were gaining disciples like Gore and Mann, plus many in the science realm who feel the noble cause of saving the world from humanity.
Sad but true.
Same as Callendar before him, who concluded that the frigid winter of 1962, et seq, falsified his AGW (which he thought beneficial) hypothesis from 1938.
What if the Precautionary Principle applied to Medicine? Medicine operates under the “Do No Harm” principle. If the doctor is not clear on what is causing your sore leg, they don’t cut off the leg on the chance it might be gangrene, even though you will die if it is gangrene.
However, under the Precautionary Principle, because your sore leg could be gangrene, the doctor should not wait to be sure, because there is a risk that you will die as a result of the wait. So the Precautionary Principle requires that the doctor operate immediately and remove the leg.
In the current US health care system, they operate on the “Where can I get the most money?” Principle.
So if the sore leg can be treated with an ice pack/heating pad or be removed, the leg will be removed because that will generate $100K to the doctor/health care system, not $100.
Not unlike the AGW mess.
the current US health care system
===============
a good friend of mine went into hospital (true story) to have a growth removed from his back. by accident the hospital mailed him the bill directly. $15,000. He called his insurance provider and told them the bill was outrageous. The insurance provider told him not to worry, they ALWAYS negotiate the claims. He subsequently learned that the final settlement on the $15,000 bill, the amount actually paid by the insurance company, was $800.
The “chargemaster” rates are a loophole in the health care system that needs fixing and is why those who cannot afford health insurance get stuck with outrageous fees. Although it could be argued that it should be permissible in a “free enterprise” system, what actually happens is that it becomes a form of legalized health care robbery much like the Martin Shkreli drug pricing scams.
Per wiki the chargemaster “usually contains highly inflated prices at several times that of actual costs to the hospital” that “typically serves as the starting point for negotiations with patients and health insurance”. Gee I wonder just how much an individual patient has in the way of “negotiating” power with a hospital entity. One fix would be to require the hospital to give individuals those rates provided to insurance, but I can already hear the right wing screams of “excessive regulation” and “trampling on private enterprises rights” protests.
https://en.wikipedia.org/wiki/Chargemaster
The Precautionary Principle is a novel artifact of the global warming culture, not a revered dictum dating to Aristotle.
https://books.google.com/ngrams/graph?content=precautionary+principle%2Cglobal+warming&year_start=1900&year_end=2000&corpus=15&smoothing=3&share=&direct_url=t1%3B%2Cprecautionary%20principle%3B%2Cc0%3B.t1%3B%2Cglobal%20warming%3B%2Cc0
Gosh that’s an ugly link.
Gang Green I like to call the civilization destroyers.
I keep trying to tell people, we are highly unlikely to be the only sentient beings in the universe. And there’s a high probability that some of those other beings are way more advanced than we are, and that some of them might think nothing of coming here and destroying us so they can have our wonderful planet for themselves.
Therefore, under the PP, we need to build ourselves a planetary shield. Sure, it could cost us the entire GDP of the world, but think of the possible consequences if we don’t. Time is of the essence. They could be speeding here as we speak.
PS. Think of all the jobs it would create.
What does “PP” stand for?
Christopher:
“PP” is ‘Precautionary Principle’.
Vlad
(Or Piss Poor ; )
Please take a look Bob at this also.
Stratosphere temps during last El ninos.
1997-98 at 10 hPa was much warmer.
http://www.cpc.ncep.noaa.gov/products/stratosphere/temperature/archive/10mb9065_1998.gif
Current year
http://www.cpc.ncep.noaa.gov/products/stratosphere/temperature/10mb9065.png
All levels past data.
http://www.cpc.ncep.noaa.gov/products/stratosphere/temperature/
Look at 96-97 10 hPa temps and sunspot data for that year.
Thanks, always enjoy your posts and charts you do. I have several things that need charting and if you up to chalange that would be great. One in Antarctica sea ice area anomalies , not extent and PDO data. Invert one.
njsnowfan, satellite-era stratosphere temps show cooling, which is supposed to be one of the fingerprints of human-induced global warming. The fact that the stratosphere is cooler now is not unexpected.
BTW, those graphs would be easier to compare in anomaly form.
Cheers
This whole notion of GHG’s depriving the stratosphere of their rightful energy bears some serious scrutiny. The stratosphere, unlike the troposphere is not primarily warmed from below. The stratosphere is primarily warmed top down by incoming high energy solar radiation exciting Oxygen. Why we should think we are cooling it with CO2 is a mystery to me.

Just as the atmosphere is partially warmed top down by short wave excitation of water, so the stratosphere is partially warmed from the bottom up by long wave excitation of ozone, a highly underappreciated GHG.
The well known shark bite out of earth spectrum by CO2 and water is the one to the left. The smaller bite to the right is from ozone. Graphically you might say it is about a quarter the size of its big brother. Notice how the ozone bite and all the ragged weak water absorption lines change with different locations and altitudes but the bottom of the CO2 bite always stays the same.
That’s because those bands are saturated. There was zero transmission to the stratosphere in those bands even at pre industrial CO2.
Furthermore, CO2 does mix very well and its concentration in the stratosphere is increasing. Any loss of earth radiation from the unsaturated “wings” of CO2 would seemingly be balanced by increased absorption in those bands in the stratosphere.
So how are we cooling the stratosphere?
Stratospheric cooling would also happen under tropospheric/surface warming such as during the Medieval Warm Period, a period of time that anthropogenic CO2 from fossil fuels would not be present. I continue to lean towards present warming related to CO2 increase being connected to natural warming, until someone can directly measure CO2 as fuel-sourced versus “other”. The isotopic ratio does not do this.
The cooling lines right up with Solar activities decreasing. So what one is it?
Someone please correct me if I’m wrong. Isn’t there supposed to be a sort of heat pump effect whereby warmer sea surface temperatures are (slightly) depressed by water evaporating and tropospheric temperatures are (slightly) elevated by the energy released when that water vapor condenses/freezes? So, if anything, the troposphere should be warming (slightly) faster than the surface?
So, if anything, the troposphere should be warming (slightly) faster than the surface?
==================
if the GHG theory is correct, that is what should be observed. all the models predict this.
the obvious conclusions is that since the observations don’t match the predictions, the observations must be wrong. 97% of government funded climate scientists agree.
They don’t call it ” MANN ” Made Glo.Bull Warming for nothing !
The troposphere as a whole shoul warm, per a discredited CAGW hypothesis, 20 percent faster then the surface, making current warming per CAGW theory less then 1/3 of expected. Indeed, since 1998, the sign is wrong.
Oh boy. Lots of spinning. You should write for politics. The TLT data set has NOT been ignored.
The bottom line is both the surface and satellite data sets show global warming. This is a pretty good agreement considering the differences on how both the estimates are derived.
I don’t think you can average the surface and satellite temperature estimates together. I could be wrong, but in that case show me evidence that it is OK to average them.
“It should come as no surprise that surface temperature products are showing record highs for the meteorological year of December 2014 to November 2015 and that lower troposphere temperature products are not.”
OK please tell – why is it not a “surprise”?
The ” ADJUSTED ” land temperatures show twice as much warming as the satellites…SURPRISE !!
And both are STILL lower than all the models…
That is the money quote. the models do not do reality.
Further, one interpretation of the satellite data is that such warming as has been observed is mainly of natural origin, ie., the step change in temperature of about 0.27degc coincident with the 1997/98 Super El Nino.
Not simply does the satellite record show that the atmosphere is not warming quicker than the surface, it suggest that almost all the warming is coincident upon a natural event (ie., a Super El Nino) when there has been a one off and isolated step change in temperature.
See my comment above:
Marcus.
“The ” ADJUSTED ” land temperatures show twice as much warming as the satellites…SURPRISE !!”
The satellite measurements are adjusted as well.
The bottom line is both the surface and satellite data sets show global warming.
====================
actually they don’t. some places are warming, some are cooling. most of the warming is in the arctic. the eastern US in contrast has shown no warming for 50 years. the same is true for large areas of the Antarctic. The South Pole for example also shows no increase for 50 years. So to call the warming “Global” is incorrect. It is regional warming.
Which is why the cooling of the LIA is so significant. The areas that are showing the most warming today are a nearly identical pattern to the areas that showed the most cooling during the LIA. This pattern was not predicted by GHG theory. It was predicted however, by the LIA itself. Thus, the most likely reason for the current warming is that it is the reverse process to whatever caused the LIA. To paraphrase, “What goes down must come up”.
For example, if the tide goes out, you would predict it would come back in on its own, without any need for humans to be the cause. Similarly if temperatures dropped during the LIA, you would expect them to rise afterwards without any need for humans to be the cause.
The reason we don’t understand the climate the way we understand the tides, is that the tides operate on a much faster cycle than climate. You can see the tides operate many, many times during a single human lifetime. In contrast climate takes much longer. Since climate is generally regarded as the 30 year average of weather, you only see at most 3 measurements of climate during your entire life time. Most grad students in University that study climate have only seen a single data point for climate in their entire lives. They have very limited personal experience on which to draw conclusions.
Excellent post…+ 1,000
IMO the hypothesis with the most support is solar activity, as modulated by orbital and rotational mechanics and oceanic circulation.
The LIA was a period of reduced average solar activity, as evinced by the Spörer (1460-1550), Maunder (1645-1715) and Dalton (1790-1820) Minima, preceded by the Wolf Minimum (1280-1350) as the Medieval Warm Period (associated with the Medieval Maximum) began to deteriorate. By contrast, the Modern Warming picked up steam during the Modern Maximum (c. 1950-present or just over). There are naturally lags during the transitions from maxima to minima and the reverse.
ferdberple.
“Which is why the cooling of the LIA is so significant…”
This is the first time I have seen someone argue there is no global warming, because the globe is warming.
As far as I know the tides are not related to global warming, unless you are referring to sea level rise.
Harry Twinotter, you must be a new troll here.
You wrote: “Oh boy. Lots of spinning. You should write for politics. The TLT data set has NOT been ignored.”
I don’t spin, Harry. I present data. My statement, “I suspect we’ll see combined NOAA/GISS online press conference like last year, with all sorts of alarmist hoopla being generated by the mainstream media about surface temperatures…while overlooking the lower troposphere temperatures”, was based on the response of the mainstream media’s response to last year’s NOAA/GISS press conference. In those many articles, please show me where they all noted that lower troposphere temperatures were not at record high levels in 2014.
Harry Twinotter, why is it not a “surprise”?
First: there is a strong El Nino taking place. Surface temperatures jump in response to an El Nino during the El Nino’s development year and its decay year. Historically, lower troposphere temperatures usually make their jump in the decay year of the El Nino.
Second: As a result of the El Nino, NOAA has been claiming record highs almost every month this year.
Harry Twinotter says: “I don’t think you can average the surface and satellite temperature estimates together. I could be wrong, but in that case show me evidence that it is OK to average them.”
Actually, it’s your responsibility to show that I can’t average them. What you think and reality are likely two different things. For many years, the climate science community has presented the model mean of the climate models stored in CMIP archives. And if you’re not aware of it, the differences between models are much greater than the differences between the surface temperature datasets and the differences between the lower troposphere temperature datasets.
Cheers.
Don’t you hate having to repeat yourself for trolls !!
Bob Tisdale.
Look, I know who you are and what your agenda is. You are what is know as a “fake expert”.
No, you are are spinning from the very first paragraph. You poorly present some data, and then pad it out with speculations.
“NOAA has been claiming record highs almost every month this year.”
Well yes, broken records are newsworthy. They have been presenting them monthly, as well as all the annual records broken over the last several decades, that happen to include both El Nino and La Nina years.
You are basically arguing that it is warmer because it is warmer. I think most climate scientists will agree with you on that one.
You want to claim that the satellite record is superior and the surface record should be ignored – fine you are allowed to do that. But also include evidence why you think this is the case. It would not just be because (some) of the satellite record agrees with your narrative and the surface record does not, by any chance?
Meanwhile ignore what Dr Roy Spencer says, and Carl Meares says. The scientists actually collecting the satellite data know nothing, don’t they?
Hairy — or should we still call you ‘Svante Callendar, the Sockpuppet’? says:
You are what is know as a “fake expert”.
What is YOUR CV, chump?
You can always submit your own article here if you want, but you will never do that because your inept pseudo-science would get ripped to shreds.
For example, your gullible worship of NOAA’s “broken records” displays your ignorance: records are broken all the time. That is the nature of records.
And:
You want to claim that the satellite record is superior…
Satellite data is by far the most accurate, and it is corroborated by thousands of radiosonde balloon measurements. You just don’t like it because it debunks your alarmist eco-religion. And you say you want evidence? No, you don’t. You want confirmation bias of your nutty beliefs.
You’re just a site pest, arguing by assertion. You disregard the mountains of solid evidence that falsifies your “dangerous AGW” belief system, and you ignore the climate Null Hypothesis, and you pay no attention to the fact that your alarmist cult is trying to convince an increasingly skeptical public that a tiny ±0.7º wiggle over the past century is something to worry about. It isn’t. In fact, it is the flattest, least changing century-long temperature record ever observed.
You aren’t a ‘fake expert’, Hairy, because you have zero expertise. What you are is a know-nothing who infests this science site with your clueless eco-beliefs. If I’m wrong, post your expertise like Bob Tisdale constantly does.
“Look, I know who you are and what your agenda is. You are what is know as a “fake expert”.”
Well, if the real experts were as accurate and honest as you think they are, maybe the “fake experts” wouldn’t get as much traction.
dbstealby.
“Satellite data is by far the most accurate, and it is corroborated by thousands of radiosonde balloon measurements. You just don’t like it because it debunks your alarmist eco-religion. And you say you want evidence? No, you don’t. You want confirmation bias of your nutty beliefs.”
Balloon data – you raise an interesting point. Balloon data such as RATPAC for example? This is an interesting comparison:
Just an FYI for everyone:
The person using the handle of “Harry Twinotter” has trolled Jo’s site for quite sometime. Be advised that he never actually reads a post, just reads what he wants to see in your post.
E.g., note where he says, “As far as I know the tides are not related to global warming, unless you are referring to sea level rise.”
If Dr. DeHavilland (my name for him) had actually read ferdberple’s post, he would have seen that ferd was making an analogy, trying to explain why we can understand one phenomenon, and have trouble with another phenomenon. Dr. DeHavilland missed it completely, as he usually does.
He’ll expect you to genuflect when he provides a reference, but won’t take a simple step to view any of YOUR references (despite asking for a ‘reference’ incessantly), because your sources are “contaminated”, and “biased”.
Don’t waste time and energy trying to talk sense to this troll. He’s not worth it; stopping long enough to fire off a volley or two, then off to the next thread or convenient place to stop and unleash some vitriol … … …
Regards to all,
Vlad the Impaler
(Dr. DeHavilland’s moniker for me)
Harry,
RATPAC “data” (so-called) are, like the bogus “surface data” are adjusted for homogeneity. And, “Our reliance on metadata, which is often incomplete or unclear, adds further, unquantified uncertainty that could be comparable to the uncertainty from the FD processing. Because the first differencing method cannot be used for individual stations, we also provide updated station time series that are unadjusted after 1997.” The goal was to bring balloon “data” into line with the man-made “surface data”.
Radiosonde Atmospheric Temperature Products for Assessing Climate (RATPAC): A new dataset of large-area anomaly time series (PDF Download Available). Available from:
https://www.researchgate.net/publication/228653775_Radiosonde_Atmospheric_Temperature_Products_for_Assessing_Climate_RATPAC_A_new_dataset_of_large-area_anomaly_time_series
Bob, you might also want to remind HarryTwit about where GISS gets 70 percent of their temperature data, at least since 1982.
The temperature index is formed by combining the meteorological station measurements over land with sea surface temperatures obtained from in situ data before 1982 (Rayner et al. 2003) and from satellite measurements thereafter (Reynolds and Smith, 1994; Smith et al. 1996). Any users of the temperature index data, i.e., the results including sea surface temperatures, should credit Reynolds and Smith (1994) and Smith et al. (1996). (See references.)
http://cdiac.ornl.gov/trends/temp/hansen/hansen.html
Harry, if you do not believe anyone is allowed to average surface and satellite, talk to GISS.
http://weather.unisys.com/surface/sst_anom.gif
Pretty cool waters to be record temps?
Harry the Twit….The liberal left must really be getting desperate if you are the best troll they can send !!
Vlad the Impaler.
It looks like I have a fan, I am flattered 🙂
And a dog whistle as well. That is about his standard.
DD More.
I do not know where you get “GISS gets 70 percent of their temperature data” from, I cannot see it in your reference.
You forgot to mention this paragraph in your reference:
“They describe the use of satellite-observed nightlights to identify measurement stations located in extreme darkness and adjust temperature trends of urban and peri-urban stations for non-climatic factors, verifying that urban effects on analyzed global change are small. ”
As to the map you show, you do release that is estimates for one day only? I think the averages over a period of time would be more interesting.
Dr. DeHavilland:
More like the vaccine.
Regards,
Vlad the Impaler
And there is nothing global about it, and therein lies one of the issues.
Some areas of the globe have cooled, some areas have undergone no change, and some areas have warmed. the most warming (perhaps not unsurprisingly) has occurred in places where there is little or no direct measurement and simple kriging.
Besides the fact that “observations”, despite being manipulated, are all below the model averages, is the fact that the GCM-predicted tropical tropospheric hot spot has failed to appear. The models’ predictions and the hypothesis based upon them have been repeatedly shown false, ie falsified, and in both senses of the term.
Hairy Twinotter sez:
The bottom line is both the surface and satellite data sets show global warming.
Hairy otter pay attention. That’s a meaningless statement, unless a time frame is included. So allow me to propose a reasonable time frame:
http://realclimatescience.com/wp-content/uploads/2015/06/ScreenHunter_9549-Jun.-17-21.12.gif
As usual, hairy is wrong: satellite temperatures have not shown any global warming for almost 20 years now. And that data is corroborated by thousands of radiosonde balloon measurements.
So as usual, it is Hairy doing the spinning. He adds:
I could be wrong, but in that case show me evidence…
I’ve shown HT mountains of solid evidence over the past couple of years proving that he’s wrong. But none of it can penetrate his eco-religious belief system. Global warming stopped many years ago, which is strong evidence falsifying the “dangerous AGW” scare. Hairy not only “could be wrong”, he has been wrong consistently, no matter how many fake screen names he uses.
Well, at least the Twit is consistent !!
Marcus, ” A foolish consistency is the hobgoblin of small minds.”
So perhaps you are not helping Harry.
(-;
Well, who knows, H. Twinotter (he must be Canadian – I flew in Twin Otters quite a bit as a field geologist in northern Canada years ago) he may come right back and thank you for your patient reply.
Gary, please don’t insult all Canadians..or Twin Otters…..or twins.. or otters… by comparing them to TWITotter !!! Thank you
Just curious….Will this strong El Nino give way to a strong La Nina? And if so, will this lower the global land and sea temps? When this Nino is gone, is it possible that we could be on a down slope in temps for several years?
Current forecast models show likely medium strong La Nina developing, but these tend to be not accurate until the summer.
http://www.cpc.ncep.noaa.gov/products/predictions/90day/tools/briefing/sstaa.gif
This will lower the global land and sea temperatures.
The science behind how ENSO cools/warms global temperatures long term is in it’s infancy. As far as I am aware I am the only person that thinks a strong El Nino could cause a step down in global temperatures, once the following La Nina after is finished. (not just a step up like back in 1997/98)
Whether a step up or step down occurs depends on the overall net energy in the top 300 m of the Pacific ocean lost or gained. Lower solar activity will increase the chances for a step down once the excess energy previously accumulated has been given chance to be lost to space via the atmosphere. The strong El Nino is the key in losing energy from the ocean to the atmosphere and eventually lost to space for good. Although the atmosphere energy lost to space is a slow process and global temperatures have showed this to be roughly 0.1 – 0.2 c per decade. Any further El Ninos tops up the atmosphere energy and the process delays again.
Matt, I am with you on this. High SST relative to below surface are a cooling event. We had a series of strong solar cycles, in conjunction with a positive PDO and positive AMO, plus the blob, produced by the RRR.
If nature puts all these together in the opposite manner, then 1979 ice age scare, here we come! I.M.V. of course.
I always wonder why the USCRN temperature data is not considered more often:
http://wattsupwiththat.files.wordpress.com/2014/06/uscrn_average_conus_jan2004-april20141.png
Need you ask?
Those data have been cursed and cast into Outer Darkness by the Collective!
USCRN has 2015 in second place behind 2012. So does ClimDiv
Now how about someone look at UAH USA48 and USA49.
The trend in both USCRN and ClimDiv since 2005 is as close to zero as no matter.
Actual values on an ordered year by year basis
(I have a sore eye and could have made mistakes.. someone needs to check these)
USCRN
2012 — 2.531
2015 — 1.755
2006 — 1.343
ClimDiv
2012 — 2.460
2015 — 1.563
2006 — 1.428
The trend in USCRN is 0.03ºF/year and in ClimDiv (since 2005) its 0.007ºF/year.
ie basically ZERO trend.
———————————————————————————————————————
Moderators….. If I post more results, will I get accused of spamming or thread bombing ?
ps.. Cat, your USCRN data is well out of date… see link further down thread.
thanks for the updated link. The question remains as to why it is rarely presented or used in postings.
Interesting. UAH and RSS seem very similar, and GISS and UKMO seem very similar. I am prejudiced against claims of conspiracy, but it does seem that there is coordination ocurring with the corrections with the files surface measurement files v satelite and balloon temperature files. Climategate, anyone?
Bob, thanks for all your hard and great work. A request: For a single, important graph from the ones you plotted, could you plot the absolute temperature on “my thermostat’s scale,” i.e., 5 to 35 degC? Could you add error bars, or an estimate of the error. WE NEED THIS TO USE IN OUR ARGUMENTS WITH WARMEST. Much thanks and appreciation
Figure 7 of http://www.drroyspencer.com/2015/04/version-6-0-of-the-uah-temperature-dataset-released-new-lt-trend-0-11-cdecade indicates that according to radiosondes, the very lowest troposphere has warmed .02 maybe .03 degree/decade more than the satellite-measured lower troposphere or the lower troposphere as a whole during 1979-2014.
While the usual mantra is:”The Arctic has warmed more than the rest of the Globe”, at least Finland has not.The Finnish Meteorological Institute’s data shows that Finland is not warmer than 80 years ago.Actually our Sodankylä-station shows slight cooling, and that station can truly be considered “arctic”.So, exactly where the Arctic has warmed?Northern Russia has not,and only couple of stations in Siberia outside local cities show any warming, and those are south-east ones.While our FMI is also infested by warmists, there still are couple of honest scientists that keep those Finnish-language net pages true.Those same pages in English are already different…
Google : ilmatieteen laitos – ilmatieteen laitos:Etusivu – ilmasto -vuositilastot (FMI – front page – climate -yearly records) , the pages in Finnish are still honest, those in English are already warmist propaganda.You can only see those honest pages if you make the search in Finnish.That says something.
Thank you Bob Tisdale for the nutshell summary.
A number of interesting observations can be made from the charts (assuming they are accurate):
Over the last 35 years results from the three surface temperature systems do not at any time vary by more than 0.05 C
Aside from a period during 1987-88 the same can be said of the troposphere results
Only 2 conclusions can be made from this:
The measurements are extremely accurate and we can take the trends as factual
Or
Collaborative adjustments have been made
I simply cannot believe that results for land and sea temperature from 3 independent institutes could be within this degree of precision and similarity. Everything is near-perfect, the pigs are fed and ready to fly
Given the political and economic stake in this subject any collaboration between research institutions to collude and make adjustments is just as serious and as subject to legal liability as business cartels that fix prices
On the basis of this evidence there should be a governmental enquiry to ascertain that collusion to ‘normalise’ outputs is not taking place
I see a difference between HadCRUT4 and GISS. Have a look at:
http://woodfortrees.org/plot/rss/from:1978.99/to:1997.51/trend/offset:0.134/plot/hadcrut3gl/from:1978.99/to:1997.51/trend/plot/hadcrut3gl/from:1998.99/to:2014.34/trend/offset:-.1994/plot/rss/from:1998.99/to:2014.34/trend/offset:-.0315/plot/gistemp/from:1978.99/to:1997.51/trend/offset:-.163/plot/gistemp/from:1998.99/to:2014.34/trend/offset:-.325/plot/hadcrut4gl/from:1978.99/to:1997.51/trend/offset:-.003/plot/hadcrut4gl/from:1998.99/to:2014.34/trend/offset:-.223
I plotted linear trends of RSS, HadCRUT3, HadCRUT4 and GISS from 1979 to the start of the 1997-1998 El Nino spike, June 1997. Next, I did some steps, not all shown here: I plotted a linear trend second segment of each each, with the next segment from June 1997 to (IIRC) March 1998. The third segment of each was from the end of the second segments to 1/1/1999 (shown as 1998.99). The 4th segment was from 1/1/1999 to the time of the last datum for HadCRUT3, the end of April 2014.
Next, I added an offset so that all four 4-piece linear plots restarted as close together as they can together at 6/1/1997 (IIRC – I may have had the restart offset done at the end of 1998). To improve clarity, I omitted the 2nd and 3rd segments of each, during the 1997-1998 El Nino spike.
Results of HadCRUT3, HadCRUT4 and GISS, for comparison to RSS:
(I also used http://woodfortrees.org/plot/rss/from:1978.99/to:2014.34/trend/offset:0.134/plot/hadcrut3gl/from:1978.99/to:2014.34/trend/plot/gistemp/from:1978.99/to:2014.34/trend/offset:-.146/plot/hadcrut4gl/from:1978.99/to:2014.34/trend/offset:-.005)
HadCRUT3 outwarmed RSS by an impressively constant .019 degree/decade. HadCRUT3 has a cooling bias due to its coverage according to a study using the ECMWF model, but I suspect very slight warming biases at the institutional level and in insufficient consideration of growth of urban effects roughly cancel out the cooling bias. Even with all its warts and shortcomings, I think HadCRUT3 is (was) probably the most accurate surface temperature index, even if only accidentally or by the grace of God. The radiosonde data indicate this is not “overcooked”.
HadCRUT4 and GISS outwarmed RSS from 1979 to 2014.33 by nearly identical rates around .035-.036 degree/decade. As I see from the radiosonde data, I think these are “a little overcooked”.
The difference between HadCRUT4 and GISS is in warming rates before and after the 1997-1998 El Nino spike. HadCRUT4 outwarms RSS only slightly more after that El Nino than before, and like HadCRUT3 and RSS has a slower warming rate after that El Nino than before. GISS outwarmed RSS by a plausible amount from 1979 to 6/1/1997, less than HadCRUT4 did, but after the end of 1998 warmed at such a rapid pace as to be an outlier – warming more rapidly after the end of 1998 than from 1/1/1979 to 6/1/1997.
Would someone please do an ordered year by year analysis for UAH USA48, USA49, RSS ContUSA, USCRN, ClimDiv.
Then look at UAH NoPol, SoPol, and the closest equivalents in RSS.
I have results for these which I think are very interesting, but I need confirmation of my calculations.
I asked on a previous thread and was basically told to shut up.. very strange. !!
ps.. for the Aussies here…. in UAH Australia.. 2015 was in 11th place.
And yes Richard, I have done my homework.. your turn. 😉
USCRN (ºF average anomaly)
2012 — 2.531
2015 — 1.755
2006 — 1.343
ClimDiv (ºF average anomaly)
2012 — 2.460
2015 — 1.563
2006 — 1.428
Still.. the trend in USCRN is 0.03ºF/year and in ClimDiv (since 2005) its 0.007ºF/year.
ie basically ZERO trend.
Hint.. Look at the POLES !!
You can get USCRN and ClimDiv data here
http://www.ncdc.noaa.gov/temp-and-precip/national-temperature-index/time-series?datasets%5B%5D=uscrn&datasets%5B%5D=climdiv¶meter=anom-tavg&time_scale=p12&begyear=2005&endyear=2015&month=12
UAH data http://vortex.nsstc.uah.edu/data/msu/v6.0beta/tlt/uahncdc_lt_6.0beta4.txt
RSS data http://data.remss.com/msu/monthly_time_series/RSS_Monthly_MSU_AMSU_Channel_TLT_Anomalies_Land_and_Ocean_v03_3.txt
As the mods have passed my post where are asked them about posting more data analysis…. I’m going to post the ones people don’t seem to like.
Again.. I could be wrong. CHECK for yourselves.
USA48 (ºC average anomaly)
2015 — 0.788
2012 — 0.742
2007 — 0.568
USA49 (ºC average anomaly)
2015 — 0.760
2012 — 0.544
2007 — 0.469
RSS has Continental USA 2015 in 2nd place. (ºC average anomaly)
2012 — 1.008
2015 — 0.831
1999 — 0.727
1998 — 0.727
That’s all for now.. I have other regions, but would rather someone else posted those results
AndyG55:
Please state your point (if you have one) then report the data you claim is evidence which supports or refutes your point.
Data on its own is meaningless. A phone directory is filled with numerical data but randomly selected numbers from the directory are meaningless.
You have posted several temperatures for “Continental USA”. So what?
If there is a point you are trying to make then please state it.
I add that anybody can post temperature data for any time from anywhere. The temperature in Torquay, UK, at 9.00am today was measured as being 11°C. I can post and/or link to many other temperature values, but that would also be as meaningless as the data you have posted.
Richard
The words “record year” should always be followed by the sentences below, or some other explanation, to avoid misleading and scaring people:
(1) “record” excludes 99.999% of Earth’s climate history, even ignoring prior cool centuries from 1300 to 1800, and
(2) Earth is always warming or cooling, in cycles … but these measurements were all made DURING a warming trend — half of a full cycle — so new “records” are to be expected, and will continue until the next cooling trend starts.
climate blog for non-scientists.
no footnotes.
however, does have climate centerfold:
http://www.elOnionBloggle.Blogspot.com
Every time the trolls try to use that ” warmest ( day, week, month, year ) ” crap someone should immediately ask them to post the fine print that NASA, NOAA, GISS hide – where they show the error range in their number and then the percent probability that their alarm is meaningful – the surface temp records are really nothing more than guesses, to withing + or – one degree F AT BEST.
I was being way too kind, they are ADJUSTED GUESSES to further the AGENDA !
In a few years our global population will be living with consequences of a summer months total Arctic sea Ice melt back and all its ramifications. We are less than a decade away from game over and this was supposed to be happening in 2030 and beyond.
You do realize that the Arctic ice melting 100% will have no affect on the sea level ?? It is an ice cube floating in water….and at the rate we are heating it, it will take 10,000 years to melt it all !