Guest Post by Bob Tisdale
SEE UPDATE 2 – Dr. Boslough’s wager is truly a sucker bet.
TheHuffingtonPost published a laughable post on December 31st by Sandia Labs’ Mark Boslough titled Are Climate Bullies Afraid to Bet Me? It begins (You’re going to enjoy this):
I, Mark Boslough, being of sound mind, do hereby challenge any individual or organization to a $25,000 bet that global warming is real and will continue. If the climatological average global land surface temperature goes up again in 2016, setting another new record, the party that accepts my challenge must donate $25,000 to a science education nonprofit of my choice. If not, I will donate $25,000 to a nonprofit designated by the accepting party.
Details are below. But it doesn’t matter. It’s a sucker bet. Everyone knows that global warming is real.
Dr. Boslough is correct, inasmuch as it is a sucker bet, but not for the reason or reasons he claims. Even skeptics expect global surface temperatures (and global lower troposphere temperatures) will be higher in 2016 than they were in 2015, but skeptics understand the reasons for it…that a strong El Niño raises global surface temperatures in the El Niño evolution year AND (typically) even more in the El Niño decay year. That means, as the 2015/16 El Niño winds down in 2016, global surface and lower troposphere temperatures will continue to rise in response to the El Niño. I reminded readers of this likelihood back in September 2015, in the blog post Tired of the Claims of “Warmest Ever” Month and Year? They Will Likely Continue Next Year. Not too surprisingly, Dr. Boslough’s blog post failed to mention El Niño.
NOTE: I do not recall ever hearing of Dr. Boslough before reading that blog post. I’m assuming he’s whining about human-induced global warming and not the warming associated natural variability. Maybe Dr. Boslough is someone who believes that any global warming is bad, regardless of whether it was caused by the hypothetical impacts of manmade greenhouse gases or by naturally occurring ocean-air processes. Then again, maybe Dr. Boslough is just another alarmist, one who disregards natural variability and is playing to the other alarmists in his audience with his publicity stunt. I would tend to believe he fits into the latter category. [End note.]
In addition to the 2015/16 El Niño, skeptics also understand that another naturally caused warming event was responsible for the reported record high (much-fiddled-with) SURFACE temperatures in 2015. That naturally caused warming event in the eastern extratropical North Pacific is known as The Blob. And we understand the reported record high SURFACE temperatures in 2014 were a response to The Blob. The Blob is another natural factor Dr. Boslough just happened to overlook. (See The Blob series of posts here.)
Another thing skeptics understand: Dr. Boslough failed to mention lower troposphere temperatures in his publicity stunt…that lower troposphere temperature anomalies are not close to record highs in 2015, though they will likely make a jump in 2016 in response to the current El Niño. See Figure 1. It includes meteorological annual mean (December to November) Lower Troposphere Temperature anomalies from Remote Sensing Systems (RSS). (Data here.)

Figure 1
Note: I presented the meteorological annual mean data because the December 2015 data from GISS (Figure 2) is not yet available and I wanted the two graphs to agree. A graph of the annual (January to December) RSS TLT data is here. 2015 came in a distant 3rd warmest with the RSS lower troposphere temperature data. [End note.]
As one might expect, Dr. Boslough chose the GISS Land-Ocean Temperature Index as the metric for his publicity stunt. He writes:
Mark Boslough (MB) hereby presents a challenge as to whether the Earth’s climate will set a new record high temperature in 2016. The challenge will be settled using the NASA GISS mean global land surface temperatures for the conventional climate averaging period (defined by the World Meteorological Organization as 30 years) ending on December 31, 2016. If the global average temperature does not exceed the mean temperature for an equal period ending on the same date in any previous year for which complete data exist, MB will donate $25,000 to a nonprofit to be designated by the accepting party. Otherwise, tie accepting party will donate $25,000 to a science education nonprofit designated by MB.
One last thing Dr. Boslough overlooked: The naturally caused (El Niño and The Blob) uptick in global surface temperatures in 2015 did not eliminate the difference in warming rates (linear trends) between surface temperature observations (his choice of GISS LOTI) and climate model simulations of surface temperatures. See Figure 2, which presents meteorological annual mean (December to November) values and linear trends for the period of 1980 to 2015. GISS and NOAA (the supplier of the sea surface temperature data for GISS) would have to tweak the data a whole lot more to get those two trend lines to agree…even with another naturally caused uptick in 2016.

Figure 2 (Corrected title block.)
The GISS Land-Ocean Temperature Index (December to November) are available here. The graph also includes the multi-model mean of the climate model simulations of global surface temperatures from the models stored in the CMIP5 (Coupled Model Intercomparison Project Phase 5) archive. The climate models stored in the CMIP5 archive were used by the IPCC for their 5th Assessment Report (AR5). See the post here for the reasons we use the multi-model mean. Those climate model outputs are available from the KNMI Climate Explorer. To highlight the difference in warming rates, the data and model outputs have been shifted so that the trend lines are zeroed at 1980.
CLOSING
As of this writing, Dr. Boslough has published a not-very-noteworthy 20 blog posts for TheHuffingtonPost since April 2013. I suspect we’ll be seeing more from him in 2016 when no one accepts his foolish bet and he tries to play additional silly games.
UPDATE
Forgot to mention that Gavin Schmidt, Director GISS, recently acknowledged that lower troposphere temperatures are supposed to be warming at a faster rate than surface temperatures. See the WattsUpWithThat post here.
UPDATE 2 – Dr. Boslough’s Wager is Truly A Sucker Bet
Bloggers MikeN and 1sky1 remind us here and here on the cross post at WUWT that the Dr. Boslough’s wager isn’t that global surface temperatures will be warmer in 2016 than they were in 2015. Dr. Boslough’s wager is for the average of 30-year periods. I should have read the wager more closely. (Thanks, MikeN and 1sky1.) Here are the specifics of the bet again:
The challenge will be settled using the NASA GISS mean global land surface temperatures for the conventional climate averaging period (defined by the World Meteorological Organization as 30 years) ending on December 31, 2016. If the global average temperature does not exceed the mean temperature for an equal period ending on the same date in any previous year for which complete data exist…
As an example, Figure 3 shows the last 30 years (1986-2015) of the meteorological annual mean (December to November) GISS Land-Ocean Temperature Index. In order for the 30-year average for the period of 1987-2016 to equal the value for the period of 1986-2015, the 2016 value has to equal the 1986 global temperature anomaly of 0.19 deg C. In other words, global surface temperatures would have to drop 0.65 deg C in 2016 for the average of 1987-2016 just to tie the average for 1986-2015.

Figure 3
Again, I should have read Dr. Boslough’s wager more closely. It truly is laughable.
It’s a double sucker bet. You have to bet against nature AND against the adjusters at GISS. Good luck with that. I wouldn’t take 10:1 odds…
Catastrophic anthropogenic global warming or PC (progressive corruption) of science, politics, rights, etc. in short.
The sucker bet is in thinking there’s a global temperature in the first place.
I Agree. Talk about fighting against wind mills at two fronts.
Regarding the update why would anybody trust the tampers of GISS? It is still a sucker bet and would he be up for it using only all the satellite and balloon data instead?
Now way can these be trusted for climate data, just increasingly becoming estimated and interpolated made-up data using the crudest forms with very slight regular historic changes to all inconvenient points.
Shows how awful GISTEMP is compared with satellite data.
http://i772.photobucket.com/albums/yy8/SciMattG/GlobalvDifference1997-98ElNino_zps8wmpmvfy.png
So many alterations that do not relate to previous older data-sets.
http://i772.photobucket.com/albums/yy8/SciMattG/GISS-corrected2_zpssymskhge.png
I’d imagine he would be quite happy to use satellite data. The El Nino warmth is likely to show up quite noticeably in the satellite readings in the coming year.
Come on guys – it’s a 30 year comparison and turns out to be 1987 vs 2016. 2015 cancels out in the math!
Yes, the strong El Nino will have a very significant influence over the first half of 2016.
It would be very different betting conditions to change the bet not based on a straw man argument. Like base the 30 year period from 2016 to 2045 and must be at least 1.5 c warmer to even justify that there is even a remote possibility of CAGW.
It really means it not only a sucker bet, but also becomes a straw man bet.
“A straw man is a common form of argument and is an informal fallacy based on giving the impression of refuting an opponent’s argument, while actually refuting an argument which was not advanced by that opponent.”
This example of behavior from the alarmists is very typical, when they can only put forward straw man arguments.
The main point that even if in 30 years time the year 2045 is 0.1 c warmer than 2015 means CAGW has been a complete failure and the apparently d-word’s will have been shown to be correct any how.
In 2045 global temperatures need to be around ~1.5 c higher than 2015 for any CAGW claim to be remotely possible. The so called d-word’s disagree with catastrophic global warming, not a little warming that will have no noticeable affect from the natural sine wave in climate, which the alarmists love to be pseudoscience charlatans.
Just for the record…
This “den1er” has seen no evidence making it even plausible that human CO2 emissions can alter the climate of the earth — at all. Not even “a little.”
It may be true, but to assert it at this point is mere belief or speculation.
The null hypothesis, that natural drivers control earth’s climate, and, further, the ice core data which makes the CO2-lags-temperature hypothesis plausible, FAR outweigh the conjecture that the properties of CO2 in the laboratory make human CO2 emissions capable of altering the climate of the earth. There is simply no evidence of causation.
Please, Matt G, forgive my blunt tone — I fervently wanted to make it clear that not ALL of us are in the same “lukewarm” camp, here on WUWT.
Please accept my HEARTY ADMIRATION and thanks for all the excellent science (graphs, etc…) above on this thread — you are one of WUWT’s science giants!
Janice
It is possible that any link with CO2 and climate is not even a little. I have seen far bigger human changes in climate by ongoing adjustments to the surface data sets especially prior the satellite era. Natural cycles leaves very little room for CO2, If any and the tampering to data sets removes any remote possibility that CO2 had any influence. Since the strong El Nino in 1997/98 the surface data has mostly only shown a little warming once the tampering of data has occurred just prior it.
A really interesting bet would be whether the nearly inevitable record high, before the equally inevitable post nino decline, is still below the model mean. Bet he doesn’t have the stones for that one.
He might as well challenge a bet on whether the Earth will not be struck by a huge meteor tomorrow; it’s totally idiotic, as is making it sound like “no takers” is some kind of victory.
Oh yes, the third reason why this is a sucker bet: slowly increasing temperatures (since the 18th century) have an arcsine distribution, meaning there’s more likely to be extremes at the ends.
Don’t us a Gaussian distribution to calculate the odds…
Peter
I haven’t got the money to make a sporting bet but will he take one that the 2016 mean will not be 0.6°C warmer than the warmest year before 1995 in the RSS satellite global temperature anomaly?
Hell, make that HadCRUT4 even.
You could rest assured that the climatological average global land surface temperature will go up again in 2016 as the record keepers have been instructed that it will go up in 2016. It is no longer science but a puppet show with the IPCC et al. pulling the strings.
Dr. Boslough seems to ignore a simple function of El Niño events. Ocean heat is moved to the atmosphere and any heat in the atmosphere is guaranteed to leave the Earth system forever. In fact no surface/ocean heat can ever leave the planet without first traversing the atmosphere. The impulse of ocean heat in the atmosphere is short-lived. I’m 70 and have experienced several El Niño events in my lifetime and none of them have ever created permanent global warming. They can’t – they’re not a heat source – they are a heat leak. If global warming terrifies you, Dr. Boslough, then take solace in knowing El Niños are a good thing for people with your affliction.
Even skeptics expect global surface temperatures (and global lower troposphere temperatures) will be higher in 2016 than they were in 2015
I don’t. 2015 was pretty damned warm. The chances of 2016 being lower are well below 50%.
dammit, warmer not lower
I agree Juice. From all the indicators with the latest up to day plots of the barometric pressure, the diurnal (or what happens at noon every day) has been reducing in strength. This big change began on 12/27/15 when it went from a low value to a high value. It does appear to be following the solar wind speed now. High pressure appears to allow the temperature to drop while the low pressure allows the temperature to rise.
But let me put in the disclamer. Even though it appears to follow a set pattern, the Sun is in charge and being that it is a highly erratic signal generator, I would not place any kind of bet as to what is going to happen this winter or the next ten years. But he did put his money where his mouth is. I believe it is just a set up to cause another diversion from REAL climate research. As they have said “its settled”.
I don’t think he honestly put his money where his mouth is.
I can understand that sensible sceptics wouldn’t want to take on the bet. Most of us understand that the earth is likely to continue warming – albeit at a slower rate than predicted by the ‘experts’ – for some time to come, but I can’t understand why the solarphiles aren’t trying to grab a piece of the action. Why aren’t the likes of David Archibald and Tallbloke issuing counter challenges. They don’t need to focus on a single year. They could devise their own bet which used 5 year periods, say, e.g. 2021-25 will be cooler than 2011-15 – AND insist on the satellite record being used. That would be fantastic publicity – not only for the role of the sun in climate – but also to highlight the fact that there are more reliable global temperature datasets.
They won’t do it, of course, because they are likely to suffer the same fate as the 2 Russian Solar scientists who bet James Annan $10000 that 2012-2017 would be cooler than 1998-2003. They are going to lose – badly.
John Finn
You are of course exactly right. Skeptics are happy to use short term variability to show cause uncertainty in the warming,but wouldn’t dare go for a five or ten year average. Wouldn’t matter which data set you used, a five year average bet would almost certainly cost them a lot of money and skeptics being the free market capitalists they are, hate to lose money. Hurts more than anything else, which is why (for most) they fight that AGW thing in the first place.
It sounds like you have a burr under your blanket about more than just the questions about science. If you want to be taken seriously, you should work on your anger management. What you fail to acknowledge is that the available data sets generally show long-term warming. Therefore, a smart bet would be an extrapolation of past trends. However, that doesn’t prove that anthropogenic CO2 is the primary driver. Indeed, there are many questions about past warming (and cooling) events prior to the industrial revolution that cannot be explained adequately. What is needed is a way to eliminate the confounding factors and demonstrate that anthropogenic CO2 is the primary forcing causing the recent warming. The magnanimous ‘sucker bet’ does nothing to address that issue. I must compliment you on your insight into the mind of the “free market capitalists.” You have greater understanding than psychologists and even politicians. But a question: How can you be certain that ALL ‘skeptics’ have the same motivation? You must be psychic.
Simon, you are soooo out of your league.
Weather, or averaged weather, is highly variable at all scales.
See, Simon? It’s not just me. Most everyone knows you’re wrong. You say:
Skeptics are happy to use short term variability to show cause uncertainty in the warming,but wouldn’t dare go for a five or ten year average.
Here’s the left-leaning Washington Post’s graph, covering more than 10 years:
Want more? I got ’em, just ask.
Simon, I can’t resist. You want long term? Here’s the really scary temperature change for the past century and a half:
http://catallaxyfiles.com/files/2012/05/Mean-Temp-1.jpg
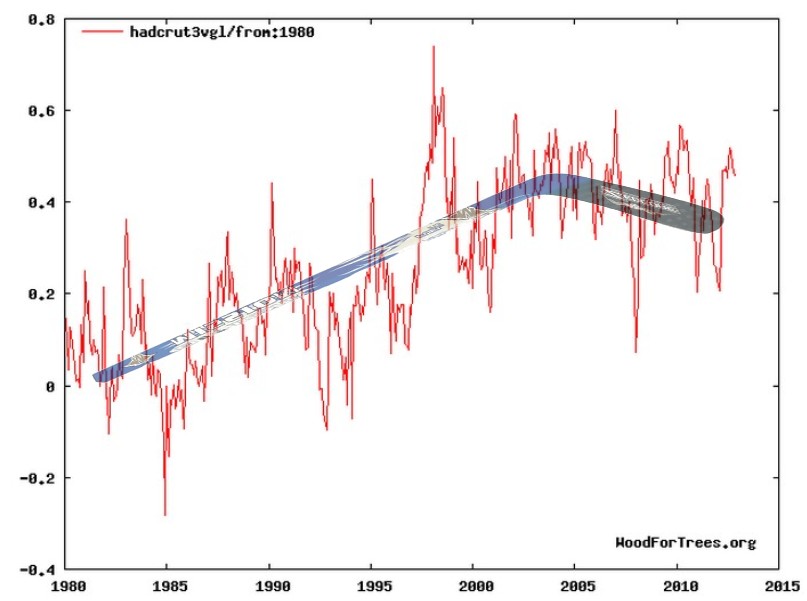
And here’s HadCRUT3 (changed to version 4 because they hated what v3 shows):
http://www.friendsofscience.org/assets/documents/FOS%20Essay/HadCrut3Global.jpg
Then, just for fun, here’s the ‘hottest decade’ chart:
And my fave ‘Hockey Stick’ chart:
Are you ready to panic yet? Wait a minute…
http://oi35.tinypic.com/2db1d89.jpg
UAH satellite says no global warming in the new millennium:
http://climate.mr-int.ch/images/graphs/SatelliteUAH.png
Another chart debunking the “2014 is the hottest year EVAH!!”:
Got plenty more. Just ask…
This is simply not true and is a straw man argument. I can go nearly 80 years in the Arctic and show no warming overall.
http://i772.photobucket.com/albums/yy8/SciMattG/ArcticTempsSurface1936_zpspod7pd2i.png
Little warming in Arctic since 2001, very little since 2005 and cooling since 2010.
http://i772.photobucket.com/albums/yy8/SciMattG/UAH_ArcticTemps2001_zps4ffhcszg.png
No warming in Antarctica since the satellite era.
http://i772.photobucket.com/albums/yy8/SciMattG/UAH_AntarcticTemps1978_zpsd4yjaujj.png
Not including recent strong El Nino both hadcrut versions showed cooling. (12 years)
http://www.woodfortrees.org/plot/hadcrut3gl/from:2002/to:2014/plot/hadcrut4gl/from:2002/to:2014/plot/hadcrut3gl/from:2002/to:2014/trend/plot/hadcrut4gl/from:2002/to:2014/trend
Not including the recent strong El Nino RSS also shows cooling. (12 years)
http://www.woodfortrees.org/plot/rss/from:2002/to:2014/plot/rss/from:2002/to:2014/trend
Even with strong El Nino still shows cooling and with not even including the strong El Nino in 1997/98 that makes the cooling trend longer.
http://www.woodfortrees.org/plot/rss/from:2002/to:2016/plot/rss/from:2002/to:2016/trend (14 years)
There are many versions in global temperatures (ocean, surface and troposphere) with all data sets showing no warming for over 10 years, especially before they were tampered with. In climate science the ‘pause’ was a infamous reference to this period especially for the alarmists.
BTW, that you claim we won’t risk our money on bets like this is evidence that we don’t get any Big Oil money.
DB
“Simon, you haven’t got a clue. Try explaing to Richard Courtney that skeptics are free market capitalists. He’s a socialist and a skeptic, and he will set you straight in no uncertain terms.”
That’s why I said “most”. People come in all variants, but by and large skeptics hate the concept of having someone else’s hand in their pockets. DB you are a classic for that
Here’s why if you use the data over a decade skeptics will not even be in the ballpark.
Click on the first graph for the decadal average. I’m sure even you will get it DB
http://nca2014.globalchange.gov/highlights/report-findings/our-changing-climate
Simon,
Extrapolations are always fraught with risk unless one has a firm grasp of the mechanism(s) controlling the change. Trends can change abruptly, as they have many times in the past. The simplistic government cartoon fails to indicate if ocean temperatures are conflated with land temperatures, although I suspect they are. Where are the error bars? What is so magic about a particular interval of time that we call a decade? That cartoon has little resemblance to the analysis I did on the land surface BEST data. It is obvious what the intent of the cartoon is, but the veracity is questionable.
Actually, to win the bet, I think the temperature would need to drop from 2015 to 2016 more than it increased from 1986 to 1987 – so, according to my eyeballs (and my understand of the bet, which could be wrong), a drop of about 0.13 degrees Celsius (or more) from 2015 to 2016 would win the bet.
Yes, a somewhat meaningless bet, basing such bets on individual years.
…a somewhat meaningless bet, basing such bets on individual years.
Exactly right. Any one year is meaningless. It’s the trend that matters, not the temperature.
Simon sez:
Wouldn’t matter which data set you used, a five year average bet would almost certainly cost them a lot of money and skeptics being the free market capitalists they are, hate to lose money. Hurts more than anything else, which is why (for most) they fight that AGW thing in the first place.
Simon, you haven’t got a clue. Try explaing to Richard Courtney that skeptics are free market capitalists. He’s a socialist and a skeptic, and he will set you straight in no uncertain terms.
The problem is that folks like you really believe that skeptics as a group have the motivations you assign to them. Speaking for myself, the only money problem I have is the enormous waste of tax money on the “dangerous AGW” scare.
Otherwise, it’s all about the knowledge. I would change my position fast if the planet told me I was wrong. That’s the difference between skeptics and climate alarmists: it’s the duty of skeptics to be skeptical, and outlandish DAGW claims require much more evidence to support them. But “dangerous AGW” has been so debunked by Planet Earth that you have essentially no evidence. You only have your belief.
You can’t produce a single measurement of something you insist must be leading to a climate catastrophe. That’s lame, Simon. “Put up or shut up” comes to mind. Scientists want to quantify everything. But they can’t quantify AGW. What does that tell you?
Finally: if you want to bet, go to Longbets.org. Someone will fade you on the global warming scare. But this wager is trumped-up, self-serving nonsense. It’s politics and public relations, not science. You don’t seem to understand the difference.
I don’t agree that this sort of propaganda should just be ignored. Why not take it on? Accept the bet – very publicly – but state clearly that the original terms are ridiculous, saying why (as you have here). Then lay out a alternative form, perhaps that the global, satellite measured temperature in 2018 will be lower than 2015.
It would be hilarious to observe his manoeuvering to refuse you.Just ignoring you would look cowardly.
Accept the bet but claim the original terms are ridiculous? You’ll wind up looking rather silly. And out $25K.
He won’t maneuver, he’s very good at ignoring critics. He will accept the bet and look forward to next year.
Except (as I clearly said) the bet will be for 2018.
Dr Boslough set the terms. He said 2016. You said “accept the bet”. Even if you could talk him into 2018, 2018 will likely be warmer than 1987.
And check the terms – the test will be the 30 years from 1987 to 2016 versus all preceding 30 year periods. We’ve just been looking at the immediately preceding period because that reduces to a comparison of two years. I’m sure if you look for some 30 year period, say 1950 to 1979, you’ll find a pretty chilly 30 years to compete against. I’m sure you can’t talk Dr Boslough into changing that!
Some people think we’re on the brink of 30-50 years of cooling, perhaps you should suggest 2050.
“if I tortured my data like that, I could make it confess to anything ”
Precisely. This is why I can’t waste my time reading all the nits and shits along the way on this subject. There has been no one method of comparing temperatures that existed over millennia because we didn’t have the technology to do so, so now we are extrapolating and can have no fool-proof assurances that we are correct. To whatever degree our data about temperatures over many thousands of years is any bit accurate, we can be pretty darn certain that the planet will see many more ice ages and warm ages before its life is done, and those coming trends are likely to have very little if anything to do with what sources of energy we people use. The long trends in temperature changes or climate changes (and far, far greater changes at that) we have been able to assume, based on various methods of calculating the past by application of science we have today that we never had before, demonstrate that fussing over a handful of decades of supposed temp rises is silly.
Within a framework of appropriate priorities, it makes sense to judiciously manage our natural resources. It makes sense to reasonably and rationally do all we can to maintain a “clean” planet. It makes sense to work out ways to help underdeveloped countries along the way. Beyond that, it’s pretty much out of our control I’m afraid and that’s why it all just looks like a crapload of politics to me and many others. So when ‘someone’ categorically states that “climate change” is our top crisis of concern while people’s heads are being chopped off and Christmas parties are being massacred, it’s no wonder skeptics raise eyebrows.
I’m not educated like all you folks, but I think I’ve got some common sense.
the divergence problem not exclusively in climate models vs observed conditions.
“This figure tells a story that is no way surprising to anyone who has worked on software projects before: demand for fixes and features is rapidly outpacing the supply of development time invested, and so the issue tracker is no longer serving as any sort of meaningful project planning tool.”
http://tinyletter.com/programming-beyond-practices/letters/the-sad-graph-of-software-death
It would appear that Dr. Boslough’s wager shows he is quite aware of what he is doing (or trying to pull off). So that public assertion could in itself show possible malfeasance in the future should the so-called “climate scientists” face criminal charges for their participation in a great scam involving government grants. That coming day is a real possibility. Dr. Boslough will have some difficulty claiming ignorance as many involved in the scheme will probably do.
Take him on. Make the bet on 1989-2018 v 1987-2016 (or 1986-2015). Using UAH or RSS – he’d lose. I’m not sure about GISS or Hadcrut. I’ll cjheck out GISS.
WUWT just need $5 a head from 5000 people. I think Boslough will back down.
Actually forget what I posted. It’s doubtful that the bet can be won for several years. We’d need a deep La Nina in 2017 and 2018 to have any sort of chance.
It’s Boslough’s bet. he doesn’t need to back down. He might not take on your bet, which has extremely different terms.
John Finn: then propose a bet that can be won by either party, and which does not rely on known-altered reconstructions. Something like the future values of Mauna Loa C02 and RSS, for example, and which, by its own terms, exposes the small (if any) extent of actual causal relationship. Or, more directly toward the impending doom/sea level scenario, a bet on a statistically significant change in the rate of sea level change measured at geologically stable locations. Just a thought…
It doesn’t matter what we use. RSS or UAH will give the same problem from a sceptical viewpoint. The crux of the matter is that recent La Nina years are warmer than El Nino years of 30 years ago. It’s therefore virtually impossible to foresee a future 30 year period which might be cooler than an earlier 30 year period.
This is quite a cleverly constructed bet which, if I’m honest, provides a fairly powerful argument for an enhanced greenhouse effect.
I disagree with your attribution of the overall temp increase. The current warming is no more rapid than the first 40 years of the 20th C, and the years since the 1998 El Niño statistically flat.
At any rate, my point was to pick a bet that you might win, and that puts those betting against you at risk for more than their bet by also putting a tenet of their belief system on the line as well. Something simple would do, like A smaller wager that the avg RSS global temp for the current El Niño is no greater than the prior 2.
The difference between the 1980’s and 21st century strongest La Nina’s are only around 0.2 c. This difference changes to around 0.3 c with El Nino’s except the 1997/98 event. Just this change says nothing about an enhanced greenhouse effect when natural ocean cycles become positive between this same period and global low cloud levels declined. We only need a drop in global temperatures of 0.3 c to be back to square one. This is almost possible with a strong El Nino if it caused a step down in global temperatures after the event.
The El Nino during 1997/98 caused a step up.
http://i772.photobucket.com/albums/yy8/SciMattG/RSS%20Global_v1997-01removal_zpszk83g0xi.png
I have already mentioned about the change in low levels clouds and global natural cycles above, during this period. (Matt G January 2, 2016 at 4:47 pm)
When Intrade was still in business it offered 9 different climate-related bets we could make, on varying time scales. Residents of Britain and other countries where gambling is legal can still bet at bookmakers on such things, I believe.
I’ll bet that over the next 30 years, Dr. Boslough never admits that the skeptics disagree with him over the magnitude of global warming but agree that global warming is real.
Finally, someone who understands! Thank you.
It’s like a magician misdirecting your attention from the main question. The question is how close to the temp increase predicted ten years ago will the 2016 temp be?
Bob – could you do a post on why the 102 IPCC models that are above the observational temperature rise have not been dropped from the scenarios? And where in the models are there scenarios that take us from where we are today to the extreme of 4C by 2100?
If the IPCC narrative cannot be debunked in principle, could not, by now, a bunch of their scenarios be shown to be based on false premises?
The terms of the bet refer to GISS global land-only data and awkwardly state the challenge is that the 30 years from 1987-2016 is colder than the coldest 30 year period in GIStemp. Unfortunately Wood for Trees only has the global land and ocean data. That data plotted as monthly and with 30 year centerweighted smoothing (i.e. mentally shift the smoothed line 15 years to the right for the end point) is:
http://www.woodfortrees.org/graph/gistemp/mean:12/plot/gistemp/mean:360?foo.jpg
So you’ll be competing against the early 20th century when the anomaly was some -0.2 C°. the most recent 30 year period has an anomaly of about +0.5 C°. It looks like in the next year we’ll be dropping a year with a +0.2 C° anomaly, and we’ll need a year cold enough to reduce the anomaly to that -0.2 C°. To undo 30 years of that +0.7 C° difference, we’ll need a year about -30 times that, i.e. with an anomaly of -21.0 C°. Well, only -20.8 C° thanks to dropping a year at +0.2 C°.
Ric, your analysis assumes a non-overlapping 30 year period. I’m not sure those are the terms of the bet. For example
1987-2016 is a 30 year period
1986-2015 is also a 30 year period.
So my understanding is that a valid bet would be 1987-2016 v 1986-2015. Basically the bet boils down to 2016 being warmer than 1986. Obviously that’s a no-brainer. No-one with any sense would take it on.
However, it’s possible that 2017 (and 2018) will be La Nina years, i.e. cooler. Furthermore 1987 was an El Nino year, so there’s a slight chance that 2017 will be cooler than 1987 which means the 1988-2017 period would be very slightly cooler than 1988-2017. However even that looks unlikely. The Boslough challenge clearly demonstrates that
La Nina years NOW are warmer than El Nino years of 30 years ago.
And it doesn’t matter what dataset is used for reference. That’s a red herring. UAH and RSS would give the same result as GISS.
Sorry that should be “cooler than 1987-2016”
I’m not clear why you think I wasn’t using non-overlapping periods. The graph from WoodForTrees displays overlapping periods with monthly granularity. My reference to the early 20th century was intentionally vague since the graphs shows so many choices for 30 year periods that are equally low.
No, the bet is 1987-2016 vs a 30 year period to be named later per the terms. Boslough’s text states:
See the word “any”? That implies looking all of the 30 year periods. In actuality, he knows taking the coldest 30 year period gives him the best chance of winning. Dr Boslough is employing misdirection (remember, he’s involved with CSICOP and probably knows James Randi) to make people look at 1986-2015 when he knows full well that any of those early 30 year periods guarantee that anyone who takes him up on the bet can’t win.
Yes I do. This implies ANY 30 year period. Not the coldest – Not a specific named period – but ANY 30 year period, e.g 1986-2015.
But it doesn’t actually matter. There is no chance that 1987-2016 will be cooler than 1986-2015. For that to happen 2016 would need to be cooler than 1986 was and that’s not going to happen – not in UAH nor RSS nor GISS nor Hadcrut.
He’ll definitely win this year and next year and the year after and the year after that …… and so on.
I’m not entirely sure of that aspect of Boslough’s intended meaning! If by “does not exceed in any” is meant simply less than or equal to any, without any restriction of choice, then it would suffice for the trailing 30yr average for 2016 to be equal to that for 2015, which is currently the highest, to win the bet. If, on the other hand, the intended meaning is less than or equal to any and all previous such averages, then Ric Werme’s parsing would prevail. That ambiguity is the sly part of a sucker bet.
I am quite sure, however, that the trailing 30yr average will NOT continue to rise idefinitely.