Satellite data shows globe will stay below 1.5°C target at the current rate of warming, resulting in 1.1°C
 December 18: University of Alabama, Huntsville
The average temperature of Earth’s atmosphere has warmed just over four tenths of a degree Celsius (almost three fourths of a degree Fahrenheit) during the past 37 years, with the greatest warming over the Arctic Ocean and Australia, said Dr. John Christy, director of the Earth System Science Center at The University of Alabama in Huntsville. Microwave sounding units on board NOAA and NASA satellites completed 37 complete years of collecting temperature data in November, giving us nearly global coverage of climate change during that time.
If that trend was to continue for another 63 years, the composite warming for the globe would be 1.1 C (about 2 degrees Fahrenheit) for the century, Christy said. That would put the average global temperature change over 100 years well under the 2.0 C (3.6 degrees F) goal set recently at the climate change summit in Paris.
Due in part (but not exclusively) to the ongoing El Niño Pacific Ocean warming event, the global temperature trend has been trending slightly warmer over the past several months, Christy said. While the current global trend is just under 0.115 C (rounded down to 0.11), he expects the trend line to cross 0.115 C in the next several months, raising the global trend to 0.12 C per decade.
Two major volcanic eruptions in the first half of the 37-year satellite temperature record (El Chichon in 1982 and Mount Pinatubo in 1991) depressed temperatures over large portions of the globe. While natural events, their random eruptions during the first half of the dataset has the effect of tilting the trend upward more than it otherwise would have been.
While a 0.12 C trend isn’t exactly a sprint to climate catastrophe (the 1.2 C or 2.2 degrees F rise over 100 years would be roughly equal to the warming seen most spring days between 10 a.m. and noon), it nonetheless has been a steady trend for the past several years. Take away the random variations caused by warm and cold weather systems, and any long-term trend, no matter how small, will produce climate records on a regular basis. Add to that long-term warming the additional heat of a large El Niño, and record-setting monthly average temperatures should be both routine and expected.
Despite that, early indications are that 2015 will end as the third warmest year in the satellite temperature record, behind 1998 and 2010. That is the early indication. Typically, the warmest temperatures are seen in the second year of an El Niño warming event, although there have been exceptions. If the typical pattern holds true, the second year of the current El Niño would be expected to bring more record high temperatures in 2016, perhaps including a new record high temperature for the year.
The fastest warming place on Earth over the past 37 years has been in the Arctic Ocean north of the Svalbard archipelago, where temperatures have been rising 0.5 C (about 0.9 degrees F) per decade. The fastest cooling spot was over the eastern Antarctic near Dome C. Temperatures there have been falling at the rate of 0.41 C (about 0.74 degrees F) per decade.
Global Temperature Report: 12/1978 through 11/2015
Global climate trend since Nov. 16, 1978: +0.11 C per decade
37-year temperature trends:
Global average trend.: +0.11 C (about 0.20 degrees Fahrenheit) per decade since December 1978.
Northern Hemisphere: +0.14 C (about 0.25 degrees Fahrenheit) per decade since December 1978.
Southern Hemisphere: +0.09 C (about 0.16 degrees Fahrenheit) per decade since December 1978.
Tropics: +0.10 C (about 0.18 degrees Fahrenheit) per decade since December 1978.
37-year composite changes:
Global Composite: +0.41 C (about 0.73 degrees Fahrenheit) composite change since December 1978.
Northern Hemisphere: +0.52 C (about 0.93 degrees Fahrenheit) composite change since December 1978.
Southern Hemisphere: +0.33 C (about 0.60 degrees Fahrenheit) composite change since December 1978.
Tropics: +0.37 C (about 0.67 degrees Fahrenheit) composite change since December 1978.
37-year warming
Trend per decade Composite
Globe +0.11 C +0.41 C
Land +0.20 C +0.74 C
Ocean +0.08 C +0.30 C
N.H. +0.14 C +0.52 C
Land +0.21 C +0.78 C
Ocean +0.09 C +0.33 C
S.H. +0.09 C +0.33 C
Land +0.18 C +0.67 C
Ocean +0.07 C +0.26 C
Tropics +0.10 C +0.37 C
Land +0.21 C +0.38 C
Ocean +0.07 C +0.26 C
NoPole +0.23 C +0.85 C
Land +0.19 C +0.70 C
Ocean +0.26 C +0.96 C
SoPole -0.01 C -0.04 C
Land -0.01 C -0.04 C
Ocean -0.01 C -0.04 C
USA48 +0.19 C +0.70 C
Australia +0.24 C +0.89 C
The complete version 6 beta lower troposphere dataset is available here:
http://vortex.nsstc.uah.edu/data/msu/v6.0beta/tlt/uahncdc_lt_6.0beta4.txt
Archived color maps of local temperature anomalies are available on-line at:
As part of an ongoing joint project between UAHuntsville, NOAA and NASA, Christy and Dr. Roy Spencer, an ESSC principal scientist, use data gathered by advanced microwave sounding units on NOAA and NASA satellites to get accurate temperature readings for almost all regions of the Earth. This includes remote desert, ocean and rain forest areas where reliable climate data are not otherwise available.
The satellite-based instruments measure the temperature of the atmosphere from the surface up to an altitude of about eight kilometers above sea level. Once the monthly temperature data are collected and processed, they are placed in a “public” computer file for immediate access by atmospheric scientists in the U.S. and abroad.
Neither Christy nor Spencer receives any research support or funding from oil, coal or industrial companies or organizations, or from any private or special interest groups. All of their climate research funding comes from federal and state grants or contracts.
— 30 —
The relative humidity has been falling since 1947 throughout the Troposphere:
http://www.climate4you.com/images/NOAA%20ESRL%20AtmospericRelativeHumidity%20GlobalMonthlyTempSince1948%20With37monthRunningAverage.gif
That is also the case for specific humidity except for near the surface:
http://www.climate4you.com/images/NOAA%20ESRL%20AtmospericSpecificHumidity%20GlobalMonthlyTempSince1948%20With37monthRunningAverage.gif
Chris Hanley,
Relative humidity tells us virtually nothing about LW optical thickness of the atmosphere due to water vapor … specific humidity is the better metric. At the surface is where we’d expect to see the largest positive correlation with surface temps … and so it is. (The Clausius–Clapeyron relationship is really difficult to argue with … it’s been around since 1850ish, and meteorologists were learning about it and using it since before Al Gore’s parents were even born, if not earlier …)
Finally, note how very different the y-axis scales on in the bottom plot for each pressure level … three orders of magnitude smaller at 300 mbar than at the surface meaning that the radiative forcing in the upper troposphere due to water vapor is essentially negligible compared to near the surface.
Cloud feedbacks … well that’s something I really can’t argue confidently about being almost certainly positive.
“Cloud feedbacks … well that’s something I really can’t argue confidently about being almost certainly positive.”
===========
Did you in a round-about way, just say, you don’t have a clue ?
The increase in specific humidity near the surface would also imply an increase in lapse rate near the surface. The lack of increase in specific humidity at the 600mb and 300mb levels imply that there is no increase in radiative forcing for the mid to upper troposphere. Perhaps that’s why the UAH and RSS both report a relatively small amount of waring of the mid to upper troposphere.
The lack of increase in specific humidity at the 600 and 300mb levels is at odds with what many of the climate models predict.
Brandon,
During the period 1980 to 1998 where average global temperatures rose faster than at any time in a century, specific humidity near the surface was essentially constant. Also no one expects water vapor to have any significant effect on energy flux at 300 mbar. I submit to you that water vapor and CO2, for that matter, exert their influence mostly by inducing convection after absorption of LWIR near the surface. Where is the evidence that increases in IR active gases increase global temperatures?
u.k.(us),
Pretty much. I know clouds are hard, and figuring out how to describe the ways in which they’re hard is one of those things that exceeds my willingness (if not capacity) to claw up the learning curve.
Chic Bowdrie,
I’ll have to poke around on my laptop tomorrow and look for the data on that.
I don’t make such assumptions. That climate4you guy likes posting a bunch of plots of things with dubious context, IMO. I never know what people will make of them.
There’s no doubt in my mind that convection and evaporation is a major component of heat loss from the surface, and that convection is driven in large part by radiative transfers in addition to surface heating. My understanding is that the upper troposphere — where convection begins to stall out and most precipitation happens — is where downward radiative flux comes into its own as a contributor to the “greenhouse” effect.
Well if these two plots don’t sway you …
http://3.bp.blogspot.com/-44o767sAtyg/VnYjEZvlczI/AAAAAAAAAgQ/V54mqEugVV0/s640/HADCRUT4%2Bvs%2BCO2%2Bmonthly.png
http://2.bp.blogspot.com/-8uR50mjSJ2E/VUQ4mCn9x-I/AAAAAAAAAdY/IIUsevfnRzw/s1600/GW%2BPetty%2BIRIS%2BTropical%2BWestern%2BPacific.png
… then we may need to discuss it from first principles of physics. Try Beer-Lambert law for starters.
Here are some books …
Introduction to Atmospheric Chemistry, by Daniel J. Jacob, Princeton University Press, 1999. Completely free online:
http://acmg.seas.harvard.edu/people/faculty/djj/book/
Principles of Planetary Climate, Ray Pierrehumbert. A classic, but not free:
http://geosci.uchicago.edu/~rtp1/PrinciplesPlanetaryClimate/index.html
The Discovery of Global Warming by, Spencer Weart, more of a history lesson on how we got from Arrhenius to Hansen, completely free online:
https://www.aip.org/history/climate/index.htm
Too tired to do more than spam you with links, discussion will have to wait until tomorrow.
erikemagnuson,
I’m up too far past my bedtime to say much other than the uncertainty in the observations in the upper layers of the troposphere limits our ability to say whether the observations are right enough to quantify how wrong the obviously wrong models are (duh, they’re models). I will perhaps be able to compose a more cogent and referenced response tomorrow.
The change in total water column shows the rise and fall was mainly due to ENSO and Tropics ocean behavior. Many areas over land had recorded increase in sunshine hours with decreasing relative humidity. The specific humidly decline in the atmosphere especially occurs at height where any change in greenhouse effect should be greatest. The specific humidity increases a little at the surface, but that is again mainly due to ENSO and Topical regions behavior. Generally where there is a decline or increase, rules for both relative and specific humidity except at the surface. The main reason for the differences at the surface is down to latent heat over the oceans.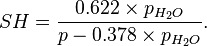

http://images.remss.com/figures/climate/vapor_global60.png
http://images.remss.com/figures/climate/temperature_and_vapor_trop20.png
There is not much difference between relative and specific humidity and both can easily be calculated from each other.
Using this definition of specific humidity, the relative humidity can be expressed as follows:-
“Total column water vapor is a measure of the total gaseous water contained in a vertical column of atmosphere. It is quite different from the more familiar relative humidity, which is the amount of water vapor in air relative to the amount of water vapor the air is capable of holding. Atmospheric water vapor is the absolute amount of water dissolved in air.”
The total column water vapor and specific humidity has always been restricted to how much the air is capable of holding it, like relative humidity.
Brandon,
You say “My understanding is that the upper troposphere — where convection begins to stall out and most precipitation happens — is where downward radiative flux comes into its own as a contributor to the ‘greenhouse’ effect.”
I assume the graphs you show are intended to argue that temperature rise over several past decades are caused by increases in the atmospheric concentration of IR absorbing gases. This is an invalid causation by correlation argument. And it’s not even that good, because there are relatively long periods where temperatures decline while CO2 increases. [Note my earlier response to your comment beginning with “Hundreds of papers….”] To show causation, one has to demonstrate how the changes apparent in the spectra result in temperature changes that aren’t confounded by the influence of other factors, the most important of which are convection and advection.
The radiation absorbed by water vapor and CO2 near the surface is completely assimilated into the bulk air. There is little net radiation at middle elevations until the atmosphere is thin enough that emissions overwhelm molecular collisions. This occurs mostly in the upper troposphere above where most water vapor condenses. There is little radiation at those temperatures that will return to the surface in the face of a convective engine constantly moving energy skyward.
This isn’t my field. However, if it was, I would want something more definitive than vague correlations between model output and temperature. Simple model physics cannot determine the relative contributions to global temperatures. Maybe a complex enough model isn’t feasible. But until models can accurately predict temperature changes due to atmospheric composition, much of what you assert is wishful thinking.
We can append the lower troposphere data from the radiosondes as well and go back to 1958 (57 years).
And we can account for the ENSO variations, the volcano variations (noted in the top post) and the solar cycle variations (which are actually too small but are included since there is a tiny hint of them) and the AMO cycle variation (there really is a 60 year cycle in temperatures probably caused by the AMO) and the CO2 warming influence then becomes the residual.
If we model the lower troposphere temps based on those influences, we get a really, really good match.
http://s21.postimg.org/420tn9opj/UAH_RSS_Had_AT_Model_Nov2015.png
Then is take the warming influence left over and compare that the climate model forecasts. Well, they are a disaster. But there is a tiny warming signal.
http://s11.postimg.org/9fwmivglv/UAH_RSS_Had_AT_Adj_versus_IPCC_Models_Nov2015.png
Going out to the year 2100, there is nothing to worry about because all that we will see in the lower troposphere in another 0.3C of warming. The “adjusted” surface temperature data will, of course, depend on what the people in charge of the NCDC are doing at the time – continue to just make up the temperatures or have finally gotten rid of all the people who have no integrity.
http://s10.postimg.org/y29k2xqzt/UAH_RSS_Had_AT_Warming_vs_IPCC_AR5_Nov2015.png
I’ve been running this system for 7 years now and it seems to continue performing every time I put new actual observations into it.
Chic Bowdrie,
I wouldn’t expect a single variable to explain all temperature changes in a system as complex as this planet.
I agree it helps to identify and isolate as many confounding factors as possible. However, change in the mean temperature of the planet is a function of energy absorbed vs. energy emitted … all convection and advection do is move energy from one place to another.
Please show me the evidence of changes in convection/advection which explain surface temperature trends since the mid- to late-19th century …
http://climexp.knmi.nl/data/iheat2000_global.png
… and which can explain the addition of some 25×10^22 J of energy to the upper two kilometers of ocean.
Now it is my turn to ask what evidence you have to support all this. While you’re coming up with it, we have directly observed downward flux at the surface, by spectral line …
http://www.skepticalscience.com/images/infrared_spectrum.jpg
… and as you can see, the 15 micron CO2 band is quite well represented, as is water vapor on the wings and ozone at 10 microns.
What model output?
What “simple” models are you talking about?
How complex does the model need to be?
My wishes aren’t relevant, evidence of physical phenomena is.
No model will ever be able to exactly predict anything.
Matt G,
One of the key features of an ENSO positive phase is a positive temperature anomaly. Higher temps, higher specific humidity.
Yes that makes sense, decreasing RH implies conditions less likely to produce cloud formation.
I don’t follow. I would expect specific humidity to decrease at night because the sun isn’t driving surface evaporation. Keep in mind that the change in greenhouse effect we’re talking about here is on the order of 3.7 W/m^2 since the mid-19th century, whereas the change in insolation between day and night is on the order of a thousand W/m^2, give or take a few hundred depending on latitude (and season in higher latitudes).
So long as you know all the inputs, the main ones being temperature and pressure. My main point was that the relationship between specific humidity and temperature is not linear …
… and that using relative humidity as a proxy for specific humidity is not a good idea unless temperature is pretty tightly constrained.
Brandon,
“Please show me the evidence of changes in convection/advection which explain surface temperature trends since the mid- to late-19th century …”
Convection and advection are phenomena like evaporation. They are processes that are influenced by conditions like atmospheric composition and temperature. Your position seems to be that another phenomenon, radiation, is predominately responsible for energy fluxes through the atmosphere and their influence on temperature. I contend that the role of evaporation, convection, and advection along with radiation are integrally linked in a way that further increases in CO2 have minimal effect on global temperatures. Natural factors may be sufficient to explain nearly all observed temperature changes. Matt G and Bill Illis provided evidence of this.
“Now it is my turn to ask what evidence you have to support [my characterization of energy fluxes through the atmosphere].”
I refer you to Roy Clark for the answer: http://venturaphotonics.com/GlobalWarming.html
“What model output?”
Model output are the values of a dependent variable calculated from an equation containing a set of independent variables. For example, temperature is dependent on solar insolation, albedo, cloud cover, etc.
“What “simple” models are you talking about?”
One dimensional models using only radiation to explain atmospheric temperatures.
“How complex does the model need to be?”
Complexity is not the goal. They only have to be good enough to predict results with reasonable accuracy. Climate models don’t do that yet.
Chic Bowdrie,
“Please show me the evidence of changes in convection/advection which explain surface temperature trends since the mid- to late-19th century …”
I asked for evidence of changes to those phenomena which explain surface and below-surface temperature trends since the 1800s.
Almost. My position is that the change in IR flux in the atmosphere is primarily responsible to the observed change in temperature since the industrial revolution.
I saw Bill Illis’ post here:
http://wattsupwiththat.com/2015/12/19/uah-un-climate-change-goal-new-trend-analysis-shows-were-there-now/#comment-2103166
I have my own regression model using HADCRUT4:
http://1.bp.blogspot.com/-oxFP6mUKqIY/VTWEdb3gJzI/AAAAAAAAAbU/YiRjFJ8Zb8M/s1600/HADCRUT4%2B12%2Bmo%2BMA%2BForcings.png
The natural factors I used do a great job of explaining inter-annual and -decadal fluctuations, but do a terrible job explaining the secular trend over the entire interval. There may be some combination of natural factors sufficient to explain that secular trend better than CO2, but I am not asking for speculation, I am asking for evidence. A time series of some measured natural phenomenon showing a secular trend combined with a description of plausible physical mechanism to explain its influence on temperature would be a good candidate.
Well, no. The crux of his argument is:
The temperatures in the upper troposphere are near 220 K. The assumption that small changes in LWIR flux in the upper troposphere or stratosphere can influence surface temperatures of 288 K requires a flagrant violation of the Second Law of Thermodynamics. Heat does not flow from a cooler to a warmer body.
He is saying what it can’t be, and then spends a lot of time aruging what else it might be.
“What model output?”
I accept that definition of model. Go back to Bill Illis’ post and tell me why his is “something more definitive than vague correlations between model output and temperature”, because I frankly don’t understand the distinction.
I agree. I take it you think 1960s vintage 1D models represent the current state of the art?
Good, I’m of the mind that they should be simple as possible but no simpler.
It’s arguable that everyone (who cares) wants models to be exactly accurate. I reiterate: ain’t never gonna happen.
Brandon,
“I asked for evidence of changes to those phenomena which explain surface and below-surface temperature trends since the 1800s.”
I’ll try to explain better so you won’t have to keep asking. Convection is not a force, or matter, or energy that can directly measured, AFAIK. It’s a response that happens to a system whose thermodynamic equilibrium has been disturbed. I suppose its influence can be demonstrated by measuring heat transfer through two materials of the same heat capacity, one a fluid and the other a solid. The problem is how to differentiate the relative contributions of convection and radiation to heat transfer through the atmosphere. That is what a good model would do. If I had the model and the data with the evidence, I would have presented it by now.
“My position is that the change in IR flux in the atmosphere is primarily responsible to the observed change in temperature since the industrial revolution.”
“and tell me why [the Bill Illis model] is ‘something more definitive than vague correlations between model output and temperature’, because I frankly don’t understand the distinction.”
Your regression model is impressive. So is his. Therefore, I should rephrase that my preference is for something other than a century-long regression model which is essentially a correlation as opposed to a radiative-convective model which more directly measures temperature as a function of specific variables during a relatively short time period. This is difficult given the problem of controlling for all the atmospheric variables and that CO2 doesn’t change that quickly. It appears that your model finds CO2 as primary component while the Illis model, not as much. That’s why a radiative-conductive model is necessary to determine whether or not it’s justified to conclude that the weight your model places on CO2 is correct. What if there is some other factor(s) that would provide a contribution obviating the need for a CO2 dependence in your model?
Did you find anything in Roy Clark’s article that is refutable or contradicts my rationale for asserting that any further increases in atmospheric CO2 can have no further influence on average global temperature?
Chic Bowdrie,
I recognize all too well the difficulty in obtaining quantified evidence of atmospheric phenomena. I am asking you for it because it is what you have asked of me.
I’m glad you brought that up because invoking changes to convection/advection wants a causal explanation.
I fully agree, and will add that it is apparently tremendously difficult to do this.
Fair enough. At the very least we seem to agree that models have an appropriate role IF they’re sufficiently representative, well-designed and validated.
Thank you. Bill does good stuff, but I obviously like my model better. 🙂
Reasonable. I would like to point out that a 1.5 century long model need not sacrifice high time resolution.
Which is the best argument I can think of for training/validating any model against as long a time interval as possible.
Here’s what I get in my model for temperature response to a doubling of CO2 (K/2xCO2) over two different sampling intervals:
1.67 1880-2015
1.65 1958-2015
Essentially no difference. The main difference between my model and his is almost certainly because the radiosonde data he used has a lower trend over 1958-2015 than HADCRUT4.
Or conversely whether the weight his model puts on ln(CO2) is correct — which is really an argument about whether HADCRUT4 is wrong and the ‘sonde data are correct. (Hint: they’re both wrong.)
I’ll shortcut this; the radiative transfer models exist and they are in good agreement with observations … that’s the point of Harries (2001) and other like studies. The problem, as ever, is separating out the temperature response to that signal from the much higher frequency AND amplitude “noise” in the system. Observational uncertainty in temperature measurements is a big part of the difficulty.
Models that include convection/advection also exist … I’d be very surprised to learn that any of the CMIP5 ensemble models don’t.
If there were something even close I would pay attention. Completely eliminating CO2 (or any other IR active species … like water vapor, methane, ozone, etc.) as a factor would be a tall order, I’d need to see that argument in a lot of peer-reviewed literature.
His basic premise that it violates the 2nd law of thermodynamics is the fatal flaw for me.
Brandon,
“I would like to point out that a 1.5 century long model need not sacrifice high time resolution.”
I don’t understand this and probably not necessary. I do appreciate having to separate out the temperature response is a problem with the long term regression models. Obviously you managed it to a good degree.
The radiative transfer models is another story. They only tell you how much radiation escapes to space based on a given atmospheric composition. It doesn’t tell you what effect that would have on temperature and the reason is the convection that is occurring is moving energy through the atmosphere and it’s not being quantitated by those radiative transfer models. Am I wrong?
I think we both agree that CMIP5 models incorporate all the known processes and variables. The problem I suspect is inadequate characterization of the inputs and invalid model assumptions, not the least of which could be the reliance on CO2.
This is why Roy Clark’s paper is so important. The only way heat can be transferred from cooler elevations is when the atmosphere is warmer than below. This only happens due to wind or at night if the surface cools faster than the air immediately above. Otherwise there is never a time when more LWIR transfers down than up. So that satisfies the 2nd Law. But the important part is that collisions are so much faster than emissions close to the surface that the vast majority of radiation absorbed by CO2 and water vapor is transferred to O2/N2 in the bulk air. It expands and rises carrying the energy with it. At sufficient elevation, according to Clark 1km, no DLWIR is capable of reaching the surface. From that point up, the downwelling LWIR and upwelling LWIR will cancel each other out. Only until the atmosphere is thin enough will emissions predominate and that is in the upper troposphere. An adequate radiative-conductive model has to be able to describe this daily dynamic phenomena.
The specific humidly decline in the atmosphere especially occurs at height where any change in greenhouse effect should be greatest.
Relative humidity increases during night due to the sun is driving surface evaporation. The reason during hot/dry days humidity decreases until around it’s highest point in the afternoon. On a similar typical day humidity increases again later in the evening with weakening sun and especially after sunset.
The change in greenhouse effect is only typically around 3.7 W/m2 at TOA and is around 1.0 W/m2 at the surface. Hence, it should be more pronounced higher up in the atmosphere. The 1.0 W/m2 at the surface makes hardly any difference compared to latent heat. Latent heat is a negative feedback from any warming at the surface. The insolation is huge compared with this tiny change and why no positive feedback is observed. Shortwave radiation doesn’t has this problem because it penetrates deep into the water.
Regarding below,
There is not much difference between relative and specific humidity and both can easily be calculated from each other.
There are numerous papers including ones based on models that use relative humidity with radiative forcing and not specific humidity.
http://www.sciencedirect.com/science/article/pii/S1352231008003567
http://www.atmos-chem-phys.net/9/2375/2009/acp-9-2375-2009.pdf
“It is now widely known that the water vapor feedback
in general circulation models (GCMs) is close to that which
would result from a climate‐invariant distribution of relative
humidity”
http://onlinelibrary.wiley.com/doi/10.1029/2009JD012585/pdf
Chic Bowdrie,
For a purely radiative model, you are not wrong. They’re only useful for very approximate estimates, and I think best only used for instructional/conceptual (ie, teaching) purposes.
I’ve said many times in this forum that anyone who can sub in some other observable parameter for CO2 and improve the performance of an AOGCM by so doing will have my full and undivided attention. Nothing against you (I find you pleasant to talk to), my patience wears thin on this point because I’ve read it so often. A major function of science is to debunk bad hypotheses, but I argue that the most important function of science is to produce better hypotheses — which means for me a lot more than just proposing them.
I can never keep track of which version of Trenberth and Kiehl’s energy budget cartoon is current …
http://www.agci.org/classroom/images/trenberth_energy.png
… but this should be good enough. So, from the surface, upwelling LW is 396 W/m^2, downwelling LW (the infamous, much derided “back radiation”) is 333 W/m^2, NET is -63 W/m^2, indicating a net loss from the surface.
Suppose we reduce DWLR to 330 W/m^2 somehow, NET radiative loss from the surface then increases to -66 W/m^2. Assuming solar input stays constant, what do you think would happen to surface temperature?
Here are the numbers as I understand them: only 1 out of every million photons abosrbed by CO2 is re-emitted. The other 999,999 times, the CO2 molecule bumps an O2 or N2 molecule and transfers the energy to it. Since O2 and N2 aren’t good IR emitters, essentially the only way they can ultimately dump accumulated energy into space is to collide with an IR active molecule like CO2, methane, water, CFCs, ozone, etc. About 6% of such collisions cause CO2 to burp out a photon.
I buy that. (The statistic I know is that at sea level a beam of 15 micron radiation only penetrates a few tens of meters before being completely absorbed.) The converse is that from the surface, no upwelling LW is capable of being transmitted higher than 1 km. Another thing to keep in mind is that all along that 1 km path, CO2 is absorbing and emitting — in all directions — the entire time.
Going back to this plot and looking at the top figure …
http://www.skepticalscience.com/images/infrared_spectrum.jpg
… we see that the CO2 “notch” at 15 microns lies on the 225 K temperature curve, which corresponds to an altitude of about 10-15 km. This is sometimes called the “average emission altitude” for CO2, and the implication is that at altitudes above this point, more CO2 would result in cooling, below that — warming. From weather balloon data, this appears to be the case:
http://1.bp.blogspot.com/-rgGRw3GZqN0/VnBiqxSngtI/AAAAAAAAAgE/Qb_cVR0At9I/s640/RATPAC-A%2BTemperature%2BTrends%2Bby%2BAltitude.png
Even more interesting is that these data show us something else we expect — higher rates of warming in the upper troposphere and warming at the surface, but at a slightly lower rate. That is consistent convective and latent heat loss offsetting some of the radiative forcing at the surface up to the point that convection stalls and evaporated water condenses back to liquid (thereby releasing latent heat) in the upper troposphere.
I agree, and I’m telling you that current state of the art models take these things into account. I’m not going to say they’ve got it exactly right.
Matt G, thanks for the references. No time to read and respond right now, will check them out later today.
Good stuff, Brandon. I’m on the road, but will get back to you soon.
Brandon,
I don’t want to irritate you any further, but just because people can’t name a factor that could obviate CO2 doesn’t mean there isn’t one out there somewhere. Have you been following David Evans work? Anyway, I’m not talking about subbing in some other variables. The rap against
climate models is the overdependence on CO2. Is this because they are constrained that way or are they using something like principal component analysis? BTW, what does your model predict for future warming?
Doesn’t matter which Trenbert version of an energy budget model, because the diagram distorts the source and magnitude of DLWIR. As your spectra show, the magnitude near the surface will correspond approximately to 290K and the magnitude in the upper troposphere approximate corresponds to 220K. Because the up and down radiation will always be about the same, the magnitude must decrease as you go higher up. Depending on the solar input at the time and the humidity, at a certain elevation the whole of the radiation will have been absorbed. The energy flux from that point up will be totally due to convection or advection, with the exception of the atmospheric window radiation, until elevations high enough that the ULWIR can get through.
There is something strange about the weather balloon data. The 1998-2015 warming hasn’t been 0.2K/decade and certainly not more than 1979-2004, has it? In any case, I have to think about how that data supports your implication that CO2 warms the surface.
Brandon,
“Even more interesting is that these data show us something else we expect — higher rates of warming in the upper troposphere and warming at the surface, but at a slightly lower rate.”
You lost me there. Greater rates of warming when compared to what? Except for a couple points around 10km and one just above the surface, the 1998-2015 period warmed at a faster rate than the 1979-2004 period. That seems the reverse of what the global temperatures have been doing. What am I missing? And where did you get this data? I don’t understand why the periods aren’t 1970-1979; 1979-1998; and 1998-2015 or something more closely corresponding to discontinuities in the global temperature record.
Chic Bowdrie,
I agree that it’s a logical possibility. However, I consider it more rational to believe what the preponderance of available evidence says. Go back to the beginning of this thread where you asked me for evidence to support my belief. I think that’s a good standard to apply to your own beliefs as well.
No … I can’t say that I even recognize the name.
Ok. But I am saying that to convince me that CO2 isn’t “it”, I would need to see data for some other variable(s) which better explain observations … not just during the instrumental period, but in the paleo record as well. And to be honest, you would have to overturn a large amount of well-established radiative physics going all the way back to Planck … which is what Clark’s “flagrant violation of the 2nd law” argument is attempting to do.
Yes, I’m familiar with that argument. 🙂
No. PCA is a statistical technique for describing co-variance among multiple variables. GCM designers attempt to model using formulations based on physical processes.
Practically anything I want depending on what I assume for the future values of any/all of the parameters. 🙂 Assuming changes to CO2 only (all other parameters fixed at 2014 average) following the RCP8.5 scenario:
http://1.bp.blogspot.com/-0vRIwuR2fhU/VnsZ_3uPpbI/AAAAAAAAAhM/ADCDUFGI1IA/s1600/CMIP5%2BRCP8.5%2Bvs%2BObservations%2Bto%2B2100.png
You’ll note that I compute 4.06 K/2xCO2 for CMIP5 sensitivity to CO2 vs a range of 2.80-3.22 K/2xCO2 based on three observational temperature series. CMIP5 does run hot over the hindcast portion, but not that hot, so this is not a strictly fair comparison because RCP8.5 also includes increases to other forcings (methane, land-use changes, ice albedo feedback, etc.) which my simple multiple regression model does not take into account.
Sorry, no. Every “GHG” molecule is constantly absorbing and radiating LW in all directions no matter what its vertical or horizontal position.
I agree, the 1998-2015 interval in that plot is strange-looking. I redid the trends over the entire interval for which data are available (1958-2015) …
http://3.bp.blogspot.com/-rVss1ZRHvx4/VnsKTcQxreI/AAAAAAAAAg4/VQyhN-gPj6o/s1600/RATPAC-A%2BTemperature%2BTrends%2Bby%2BAltitude%2B1958-2015%2Bglobal%2Bvs%2Btropics.png
… but this time compared the entire globe to the tropics, with … shall I say, interesting … results.
Chic Bowdrie,
I apologize, those numbers should all be multiplied by ln(2) to get temperature change for a doubling of CO2. The revised plot with corrected figures is here:
http://3.bp.blogspot.com/-OOr2sUDv-FA/VnslRfcz7DI/AAAAAAAAAhg/0CwFb2XolaE/s1600/CMIP5%2BRCP8.5%2Bvs%2BObservations%2Bto%2B2100.png
Compared to other layers of the atmosphere, the upper troposphere shows a higher rate of warming.
Data:
http://www1.ncdc.noaa.gov/pub/data/ratpac/ratpac-a/RATPAC-A-annual-levels.txt
Description:
https://www.ncdc.noaa.gov/data-access/weather-balloon/radiosonde-atmospheric-temperature-products-accessing-climate/ratpac-a
Those intervals were based on a particular discussion I was having a few days back, based on the time periods the other person was talking about. When my previous post to you comes out of moderation, you will see that I redid the plot over the entire 1958-2015 interval covered by the data.
Matt G,
If we both accept this plot as a reasonable representation of reality …
http://www.climate4you.com/images/NOAA%20ESRL%20AtmospericSpecificHumidity%20GlobalMonthlyTempSince1948%20With37monthRunningAverage.gif
… then specific humidity shows a net increase in the atmosphere, showing the strongest correlation with temperature at the surface … which is where the water vapor is coming from.
We agree.
That doesn’t make any sense to me. Where are you getting this information?
I agree that the upper troposphere should be more sensitive to a change in forcing than the lower.
I don’t understand, please explain.
I think the more appropriate comparison is change in SW with change in LW.
Energy absorbed is still energy absorbed.
First link: Relative humidity dependence of aerosol optical properties and direct radiative forcing in the surface boundary layer at Xinken in Pearl River Delta of China: An observation based numerical study
So that one is radiative forcing of aerosols, which they are saying is dependent on RH. Very interesting, but not directly relevant to my main point
Second link: Sensitivity of aerosol optical thickness and aerosol direct radiative
effect to relative humidity
Ditto.
Third link: Relative humidity changes in a warmer climate
Mmm hmm. So, assuming fixed RH, if temperature increases specific humidity MUST increase. Read the next sentence: This sometimes gives the mistaken impression that models predict that relative humidity will remain invariant everywhere in warmer climates.
While all this is interesting stuff, it doesn’t address my main point about RH not being a good proxy for SH unless temperature is well constrained. If you have good data for temperature, then yes, one can easily make a reasonable estimate for SH based on RH.
Brandon,
“Ok. But I am saying that to convince me that CO2 isn’t “it”, I would need to see data for some other variable(s) which better explain observations … not just during the instrumental period, but in the paleo record as well.”
I’m not trying to convince you that CO2 isn’t it as much as I’m looking for better evidence that it is. I can now put a name to the evidence I’m looking for, a mechanistic model (Amy Hurford, https://theartofmodelling.wordpress.com/2012/02/19/mechanistic-models-what-is-the-value-of-understanding/https://theartofmodelling.wordpress.com/2012/02/19/mechanistic-models-what-is-the-value-of-understanding/):
“Mechanistic model: a hypothesized relationship between the variables in the data set where the nature of the relationship is specified in terms of the biological processes that are thought to have given rise to the data. The parameters in the mechanistic model all have biological definitions and so they can be measured independently of the data set referenced above.
Phenomenological/Statistical model: a hypothesized relationship between the variables in the data set, where the relationship seeks only to best describe the data.”
The radiative-conductive model that I would like to see would use radiation and humidity data over a fixed relatively short time period to verify how changes in water vapor affect temperature. Water vapor would serve as a proxy for CO2 which wouldn’t change in so short a time interval.
Your model is largely phenomenological. You claim you can predict anything with it depending on your assumptions of future parameter values. I don’t think that would be the case if temperatures don’t rise and CO2 does.
“And to be honest, you would have to overturn a large amount of well-established radiative physics going all the way back to Planck … which is what Clark’s “flagrant violation of the 2nd law” argument is attempting to do.”
There is no well-established physics that validates any claim to LWIR from elevations above 1km making it back to the surface. That is the point of Clark’s paper and why I’m convinced that eventually it will become accepted science that convection moves nearly all energy through the atmosphere except for that going through the window and that any change in CO2 from current levels will have negligible positive effect, if not negative.
I graphed the global RATPAC data you reference and didn’t get the same curve. My plot has surface warming at almost 0.2 K/decade. The upper troposphere also warms, but not as fast over the whole interval. However, that’s not saying much because the whole interval hides a lot of information. I broke it down to 1958-1976, 1977-1999, and 2000-2015. If I did it correctly, all three periods show close to uniform rates of warming at altitudes up to about 9 km. The early period cooled at about -0.25 K/decade and both the other periods at about 0.05 K/decade. I got much different profiles depending on what year I chose the break between the two later periods. I don’t see how any of these data can be used to argue that CO2 has any effect on the lower atmosphere profiles. The data does support a claim that more CO2 helps cool the upper atmospheres.
“Sorry, no. Every “GHG” molecule is constantly absorbing and radiating LW in all directions no matter what its vertical or horizontal position.”
I’m not saying otherwise. What I meant was that at a sufficiently high elevation in the lower troposhpere, all the ULWIR will have been absorbed within 1 km or less. Between that elevation and higher up, where the atmosphere is thin enough, the net radiation will be zero other than that going through the window. The only way for energy to move through those middle distances is by convection/advection.
I think that catches me up. Hope you had a nice Christmas.
I actually find it very difficult to believe that specific humidity has fallen globally in such a consistent manner and strongly question the veracity of this data, however, it raises additional questions if correct. If the more humid time periods are evaluated for total enthalpy versus drier times, what does that indicate in terms of actual change of heat content in the atmosphere. Global warming seems to preoccupy itself with temperature change only. Moisture content of the air can be a tremendous quantity of additional heat. I suppose it is theoretically possible that modern times are warmer but drier and heat content hasn’t changed- but like I said at the outset, I find it hard to believe as air and moisture have a great affinity.
john harmsworth,
The specific humidity plots posted in this thread are based on NCEP reanalysis data, which I wouldn’t normally expect to be taken as reality by most folks in this forum.
Going back to the NCEP reanalysis dataset for precipitable water …
http://www.esrl.noaa.gov/psd/cgi-bin/data/timeseries/timeseries.pl?ntype=1&var=Precipitable+Water&level=2000&lat1=90&lat2=-90&lon1=-180&lon2=180&iseas=0&mon1=0&mon2=0&iarea=1&typeout=1&Submit=Create+Timeseries
I get a linear trend of 5.97E-04 kg m^-2 yr^-1 over 1948-2015. Noting that the latent heat of vaporization of water is 2,264.76 kJ/kg:
… which is actually rather smaller than I would have expected.
Isn’t the main point that we are looking at less than 1 degree C increase since 1880?
The appearance of rising, flat, or cooling temperatures depends on which length of time you choose for your graph. But at the end of the day it has risen less than 1 degree.
Many of the early temperature readings have been adjusted and there is uncertainty as to their accuracy.
Measurement of temperature in terms of variation from an average rather than plotting the baseline temperature creates the illusion of significant increases and this has happened because of the newness of climate science and the lack of defined procedures.
Does a world average temperature have any real meaning at all?
This possible small increase in temperature has not resulted in any increase in natural disasters so why are we about to spend so much money on a misdirected effort to stop further warming?
BusterBrown@hotmail.com (December 19, 2015 at 10:19 pm)
(Note: “Buster Brown” is the latest fake screen name for ‘David Socrates’, ‘Brian G Valentine’, ‘Joel D. Jackson’, ‘beckleybud’, ‘Edward Richardson’, ‘H Grouse’, and about twenty others. The same person is also an identity thief who has stolen legitimate commenters’ names. Therefore, all the time and effort he spent on writing 300 comments under the fake “BusterBrown” name, many of them quite long, are wasted because I am deleting them wholesale. ~mod.)
Now then, that plot is very telling. Because whilst it may suggest that there is no slow down in the rate of warming these past 20 years, it also clearly demonstrates that there is no increase in the rate of warming between 1950 to date (that is the rate indicated by the blue line linear trend), and 1910 to 1945.
If anything the rate of warming between about 1910 to about 1945 is greater than the rate of warming as from 1950 to date.
That is particularly damning since the IPCC accepts that manmade CO2 did not cause or contribute towards the 1910 to 1940 episode. And we know that whilst there has been significant mandmade Co2 emissions post 1950, this has not led to an increase in the rate of global warming; . the rate between 1950 to date, being no more than the rate between ~1910 to ~1945. The fact that the rate has not increased is strong evidence to suggest that CO2 at current levels does nothing of significance.
Satellite data
Cherry picking 1997/98 El Nino? Why using the strong El Nino currently then? Hypocrite
Data from only after excluding the 1997/98 El Nino and the following La Nina.
RSS shows cooling not including the recent El Nino.
http://www.woodfortrees.org/plot/rss/from:2002/to:2014/plot/rss/from:2002/to:2014/trend
UAH shows very little warming not including the recent El Nino.
http://www.woodfortrees.org/plot/uah/from:2002/to:2014/plot/uah/from:2002/to:2014/trend
Surface
Oceans showed no warming until the deliberate tampering data change to show some extra warming with hadsst3gl. NOTE – even from 2001 when global temperatures had not recovered from the La Nina yet.
http://www.woodfortrees.org/plot/hadsst2gl/from:2001/plot/hadsst2gl/from:2001/trend
Yet still doesn’t show warming when the recent El Nino is excluded.
http://www.woodfortrees.org/plot/hadsst3gl/from:2001/to:2014/plot/hadsst3gl/from:2001/to:2014/trend
Hadcrut3gl before data tampering showed cooling.
http://www.woodfortrees.org/plot/hadcrut3gl/from:2002/to:2014/plot/hadcrut3gl/from:2002/to:2014/trend
Hadcrut4 even after tampering still shows cooling not including the recent El Nino.
http://www.woodfortrees.org/plot/hadcrut4gl/from:2002/to:2014/plot/hadcrut4gl/from:2002/to:2014/trend
Gistemp despite all the ongoing tampering, only shows a little warming without the recent El Nino.
http://www.woodfortrees.org/plot/gistemp/from:2002/to:2014/plot/gistemp/from:2002/to:2014/trend
Quite clearly the pause was seen and the strong El Nino now doesn’t change this FACT. All the surface data has had recent tampering to data to show more warming, either with changing different cherries or altering historic data using increasing estimates and less observations.
WFT shows 5.6 which is no longer valid. For 6.0beta4, use:
http://moyhu.blogspot.com.au/p/temperature-trend-viewer.html
Thanks,
Version 6.0beta4 shows slight cooling from between 2002 and 2014.
ScienceRules:
The “intense arguments”? I thought the science was settled.
And:
The physics of the Greenhouse Effect and the calculation of back radiation increases over the decades based on measured increases in atmospheric greenhouse gases should give us the answer needed to determine our state of alarm, or lack thereof, shouldn’t it?
Indeed it should. Can you produce empirical, testable measurements quantifying the fraction of man-made global warming? To one decimal point should be sufficient.
Of course, if you can produce such measurements, you will be the first — and on the short list for a Nobel Prize.
When the warmist can put forward a convincing case explaining why the rate of warming post 1950 to date is no greater than the rate of warming between ~1910 to ~1945, then they may be onto something.
But presently given that the warming episode ~1910 to ~1945, which even the IPCC accepts that CO2 did not play a role, is greater than the rate of warming between 1950 to date, it would appear that CO2 at current levels has no measurable impact.
As many have observed, the signal to CO2 cannot be detected using our best measuring devices and the data that results therefrom. It cannot be extracted from the noise of natural variability and the inherent error bounds of the equipment and the data set that it produces.
Verney makes big mistakes in his reply: That “the IPCC accepts CO2 did not play a role. {in the 1910-1945 warming}. No, the IPCC says that it’s very likely the warming from 1950 is man caused. That statement does not ‘accept that 1910-1945 warming is not man caused. A considerable difference.
And then Verney cites his own faulty conclusion as proof that CO2 has no measureable impact on warming in general.
I suggest he make his incredible case in a peer reviewed journal (other than Energy and the Environment).
ScienceRules,
Aorry, my fault. I was responding to your comment about ‘intense debate’ when I wrote ‘I thought the science was settled’.
Of course it’s not settled, in fact, there’s no convincing evidence that dangerous AGW exists. There are no measurements of AGW, as Richard Verney pointed out above. That makes the ‘man-made climate change’ scare no more than an opinion.
Forget “100% certainty”. There is zero percent certainty about AGW.
And a nice xMass thought for you. Mann might have been right all along, just for the wrong reasons. ?dl=0
?dl=0 ?dl=0
?dl=0
There are ‘hockey sticks’ in nature. You just have to decide of they match what you are looking for 🙂