
November 30, 2015 – Today, on the first day of the United Nations’ twenty-first conference of the parties (COP-21) taking place in Paris, a new book emphatically rejects claims of a “scientific consensus” on the causes and consequences of climate change.
The authors are three prominent climate scientists affiliated with the Nongovernmental International Panel on Climate Change (NIPCC). The book is titled Why Scientists Disagree about Global Warming: The NIPCC Report on Consensus.
About the Book
“Probably the most widely repeated claim in the debate over global warming is that ‘97% of scientists agree’ that climate change is man-made and dangerous,” the authors write. “This claim is not only false, but its presence in the debate is an insult to science.”
With these words, the authors begin a detailed analysis of one of the most controversial topics of the day. The authors make a compelling case against claims of a scientific consensus. The purported proof of such a consensus consists of sloppy research by nonscientists, college students, and a highly partisan Australian blogger. Surveys of climate scientists, even those heavily biased in favor of climate alarmism, find extensive disagreement on the underlying science and doubts about its reliability.
The authors point to four reasons why scientists disagree about global warming: a conflict among scientists in different and often competing disciplines; fundamental scientific uncertainties concerning how the global climate responds to the human presence; failure of the United Nations’ Intergovernmental Panel on Climate Change (IPCC) to provide objective guidance to the complex science; and bias among researchers.
The authors offer a succinct summary of the real science of climate change based on their previously published comprehensive review of climate science in a volume titled Climate Change Reconsidered II: Physical Science. They recommend policymakers resist pressure from lobby groups to silence scientists who question the authority of IPCC to claim to speak for “climate science.”
CRAIG D. IDSO, Ph.D., a climatologist, is one of the world’s leading experts on the effects of carbon dioxide on plant and animal life and is chairman of the Center for the Study of Carbon Dioxide and Global Change.
ROBERT M. CARTER, Ph.D., a paleogeologist, is emeritus fellow of the Institute of Public Affairs in Australia and author of Climate Change: The Counter Consensus (London: Stacey International, 2010).
S. FRED SINGER, Ph.D., a physicist, is president of the Science and Environmental Policy Project and founder of the Nongovernmental International Panel on Climate Change (NIPCC).
About NIPCC
The Nongovernmental International Panel on Climate Change (NIPCC) is an international panel of nongovernment scientists and scholars who have come together to present a comprehensive, authoritative, and realistic assessment of the science and economics of global warming. Whereas the reports of the United Nations’ Intergovernmental Panel on Climate Change (IPCC) warn of a dangerous human effect on climate, NIPCC concludes the human effect is likely to be small relative to natural variability, and whatever small warming is likely to occur will produce benefits as well as costs.
NIPCC is sponsored by three nonprofit organizations: the Center for the Study of Carbon Dioxide and Global Change, the Science and Environmental Policy Project (SEPP), and The Heartland Institute.
This volume, like past NIPCC reports, is edited and published by the staff of The Heartland Institute, a national nonprofit research and educational organization newly relocated from Chicago to suburban Arlington Heights, Illinois.
For More Information
For more information about the book, or to interview the authors, contact Donald Kendal, new media specialist, The Heartland Institute, at dkendal@heartland.org or 847/877-9100.
The Heartland Institute is a 31-year-old national nonprofit organization headquartered in Arlington Heights, Illinois. Its mission is to discover, develop, and promote free-market solutions to social and economic problems. For more information, visit our Web site or call 312/377-4000.
“….you will NOT find the word “dangerous.” …”
Great. Not dangerous? So what is all the fuss about then?
Quite true, you don’t find dangerous used in that specific report [ by the usual suspects ].
However there are plenty of other examples where it is used…..
I can give you “danger”……………http://www.dailymail.co.uk/news/article-3338274/Flying-boulders-danger-climate-change-Scientists-warn-giant-rocks-catapulted-air-powerful-superstorms-caused-global-warming.html
James Hansen got hot and sweaty over the giant rocks.
http://www.hickoryrecord.com/news/another-danger-of-climate-change-giant-flying-boulders/article_061d1d36-965c-11e5-8d48-3b5bc286704c.html
Unfortunately the so called “flying boulders” are erosional remnants despite exciting claims to the contrary.
http://www.eleuthera-map.com/cow-bull-eleuthera.htm
https://gsa.confex.com/gsa/2002AM/finalprogram/abstract_39280.htm
Then there’s Dana Nuccitelli….always good for a bit of danger
http://www.theguardian.com/environment/climate-consensus-97-per-cent/2015/jul/02/new-study-warns-of-dangerous-climate-change-risks-to-the-earths-oceans
Quote
In 1868, a hydraulic engine was installed, with water being used to power labour-saving machines such as laundry equipment, a rotisserie and a hydraulic lift. In 1870, water from one of the estate’s lakes was used to drive a Siemens dynamo in what was the world’s first hydroelectric power station. The resultant electricity was used to power an arc lamp installed in the Gallery in 1878. The arc lamp was replaced in 1880 by Joseph Swan’s incandescent lamps in what Swan considered ‘the first proper installation’ of electric lighting.
https://en.wikipedia.org/wiki/Cragside
Unquote
Correct attributions are important
It’s a shell game, it’s *always* a shell game. They (the dreaded *They*, in this case CAGW-pushing scientists and hangers-on) push CAGW to the press and politicians and then subtract the “C” when you challenge them to make them sound more reasonable and you less.
It’s exactly like saying “weather isn’t climate” when it’s cold and then running around like a chicken with their head cut off on a hot day.
When someone continually lies to me, I stop trusting them. I know, it’s shocking.
Instead of debate over what is the major cause of Global Warming, find the ways to stop it, it looks like now or never.
Eh, stop throwing yourself on the floor to get attention.
Its unbecoming.
Let’s get past this CAGW business and get onto the real business.
I’m not willing to give you my money for energy sources that don’t work as well as the one I currently have.
I’m also not willing to give you money for some grand global save the planet scheme.
So stop already.
I am interested in this. Your men, Gates, Buffet, Soros, Zuckerman others are funding this tech.
How far out is it till I can use it to replace what I have.
Stop the childish arm flailing and send me a plan.
http://terrestrialenergy.com/imsr-technology/
A quick summary of the facts:
The planet experienced rapid warming from between 17500 and 11000 years ago, with low CO2 levels and no human industry whatsoever. Great ice sheets a mile think melted quickly and raised sea levels 130m. Now that was true catastrophic warming.
Then from 11000 years ago to today, the planet has become progressively cooller on aggregate from the Holocene Optimum, even as CO2 levels have continued to rise. Sea level rise has dropped to a few mm a year. The world has been for most a warm, wet, productive land that has allowed us to grow immensely as a species, with a few relatively small-scale catastrophes here and there.
In the short term, the temperatures dropped from the Medieval Warm Period into the cold of the Little Ice Age and then warmed slightly into the Modern Warm Period, coinciding with the beginning of the Oil Age but not caused by it.
In the short-short term, satellite data, the most reliable and globe-covering, not relying on data from ships and buckets and buoys and weather stations that haven’t provided data since the 1920s and “adjustments” like the GHCN and HadCRUT studies, has shown no warming for the past 18 years. The Modern Warming Period has plateau’d…even as CO2 continues to rise.
So, conclusions?
A. Today’s “warming” has stopped in the very short term, is less than the Medieval Warm Period, far less than the Holocene Optimum, far far less than the warming of the first third of the Holocene Interglacial. In fact it has become cooler since the Holocene Optimum.
B. CO2, man-made or otherwise, has shown no cause on the temperatures of any of the last 17500 years. Anyone screaming that the planet is going to die due to CO2 in the atmosphere is a fool. CO2 is a vital building block of life and it’s amazing how many people failed elementary school biology.
C. The IPCC models are complete garbage since they use premises at their core that has been shown to be false. Even the IPCC admitted they had “low confidence” in their first models yet continue to pump out ever more models, each one predicting worse calamity than the one before. Why? We can only surmise that they want the funding gravy train to keep flowing in their direction.
D. Throwing billions upon billions of tax dollars at a problem that doesn’t exist is insane. We could be using that money to clean up real environmental issues, not planning bizarre concepts such as ” carbon sequestration”.
Your facts are, of course, pretty much spot-on, Andy. But it doesn’t really matter. It’s the old “don’t confuse me with facts, my mind is made up” syndrome.
Doesn’t mean we (“we” being rational, open-minded, scientifically literate to various degrees, believers in evidence, and the geological record is about as unambiguous as you could wish for) should stop pointing out the obvious, but we should expect long-term frustration rather then short-term gratification.
There is maybe a hint of progress; I seem to see more unbiased comment in the MSM (at least the print media) than a few years back. Maybe the tide is starting to turn.
Well, after four decades of constant “The End is Near!” pronouncements from the AGW religion and not a single one has come true, I’m not surprised that people are beginning to realize them for the crackpots that they are.
Nope the “Premise: of the book is reflected in the title of the book. Why Scientists Disagree about Global Warming: The NIPCC Report on Consensus. the “97%” quote is one of the reasons why “honest” scientists disagree about global warming.
Mr. Hue
Please explain to me how +60 miles of glacier melted prior to the existence of Big Oil or an increase of CO2 levels.
http://www.alaska.org/assets/content/maps/glacier-bay-national-park-detail-map.pdf
Or that 1200 to 1400 years ago the Mendenhall glacier had advanced to its present location. The forest was there thousands of years prior to that glacier advancing over it. If not for the LIA, these glaciers would not exist. The Earth suffered a 550 year cold spell with low temperatures exceeding all previous Holocene lows with the exception of the short lived 8200 event. We are still recovering from that nasty cold snap. And yes, I do live in Alaska.
http://juneauempire.com/outdoors/2013-09-13/ancient-trees-emerge-frozen-forest-tomb
Consensus is a political term with no connection what so ever to Therories of Science
Are you arguing that Climate Change isn’t dangerous, or are you just saying this is a misrepresentation that destroys the books credibility?
Jbird…who are you asking? 1oldnunwise is claiming that the authors are guilty of a misrepresentation that destroys the books credibility.
But to support that claim, he has to-
1. Completely ignore basic grammar, punctuation and launguage principles
2. Engage in all sorts of logical fallacies trying to present his own personal interpretation of what he read as being accurate, when the authors own words (and #1) demonstrate that he’s wrong.
3. Add to and subtract words from the authors’ words whenever he feels the need to.
4. Be oblivious to printing rights and laws in which a direct quote made by a specific person, or group of people, requires the authors to note/cite the source of that quote in the footnotes or bibliography of that book to avoid plagiarism. The authors give no such citation, but then again, they didn’t directly quote anyone so there’s no one, nothing to cite
That 1oldnwise4me continues to argue despite all of those things has only destroyed his own credibility here, if he had any prior to this.
Oh. My. Word! I cannot believe anyone is this stupid or oblivious.
“By adding that single word connected by the word “and” they have created a false statement. The statement is false because the scientific research that studied the “consensus” does not reference the word “dangerous.”
NO…moron. The paragraph in question does NOT reference “the scientific research that studied the consensus? When YOU assume/pretend that they ARE in reference to it, YOU create a FALSE STATEMENT about the paragraph. It is YOUR personal assumption/interpretation that the “debate” or debaters they are talking about is limited to just the “scientific research that studied the consensus”.
I downloaded the book and 1oldnwise4me only becomes MORE wrong as can be seen below. Here are the first THREE paragraphs of the Introduction-
“Probably the most widely repeated claim in the debate over global warming is that “97 percent of scientists agree” that climate change is man-made and dangerous. This claim is not only false, but its presence in the debate is an insult to science.
As the size of recent reports by the alarmist Intergovernmental Panel on Climate Change (IPCC) and its skeptical counterpart, the Nongovernmental International Panel on Climate (NIPCC) suggest, climate science is a complex and highly technical subject, making simplistic claims about what “all” or “most” scientists believe necessarily misleading. Regrettably, this hasn’t prevented various politicians
and activists from proclaiming a “scientific consensus” or even “overwhelming scientific consensus” that
human activities are responsible for observed climate changes in recent decades and could have “catastrophic” effects in the future.
The claim that “97 percent of scientists agree” appears on the websites of government agencies such as the U.S. National Aeronautics and Space Administration (NASA, 2015) and even respected scientific organizations such as the American Association for the Advancement of Science (AAAS,
n.d.), yet such claims are either false or meaningless.”
**********
Anyone can see (except apparently 1oldnwise4me) that the authors aren’t talking ( in this particular section ) about the scientific research that studied the consensus at all! They are talking about the claims made by “politicians”, “activists”, and “the websites of government agencies”. Anyone can see that the authors go on to attribute the word “catastrophic” to politicians and activists. NOT consensus studying scientists. NOT consensus research. Neither is even mentioned.
1oldnwise4me’s entire argument that this book is some kind of “strawman” is nothing but mess of logical fallacies and wackadoodle personal interpretation that is completely demolished by the actual evidence.
Jbird,
Some climate change is a problem; but most isn’t. The climate used to refer to a specific area, such as the Mediterranean climate. But now ‘climate change’ is the Orwellian term for ‘runaway global warming’, which had to be discarded because global warming has stopped.
Ooh, that must really sting! Planet Earth herself is busy debunking the alarmist crowd.
So you need to define “climate change”, before you give your opinion on it.
And then there’s our confused commenter, who feels it’s necessary to write “in the journals, where real science is done” — twice, just in case we didn’t get it the first time.
Well, real science may still be done in other fields, but as the Climategate email dump proved beyond any doubt, ‘climate science’ has been so thoroughly corrupted that the real science is mostly being done outside of the climate journal system.
As Dr. Phil Jones, the Director of the East Anglia climate center, wrote to fellow climate charlatan Michael Mann about scientists who were skeptical of the man-made global warming scare: We “will keep them out somehow — even if we have to redefine what the peer-review literature is!”
That’s pure corruption, and anyone who thinks it isn’t still going on is a naive and credulous true believer. Pass them the Kool Aid.
So now, that climate pal-review system is nothing more than a clique of self-serving rent seekers. I have to laugh at anyone who still believes that it’s honest. It’s not. And the same corruption has infected government bureaucracies like NASA, NOAA, and others because of the current President’s shameless politicizing of departments that were formerly left to pursue science, without government meddling.
oldndumb,
Wake up. I wrote “mostly” Lindzen is an exception.
Isn’t it past your bedtime?
oldfool says:
“Got it.”
But he gets nothing and never has, as I showed with the Climategate email dump.
It is as simple as this: the honest, skeptical scientists who disputed, or even questioned the ‘man-made global warming’ narrative were systematically kept out of the climate peer review process. That fact is documented repeatedly in the Climategate emails, by the same corrupt gatekeeprs that 1oldy is trying impotently to defend here.
That makes the climate alarmist clique ipso facto guilty of corruption and scientific misconduct. There is no other way to look at it.
It’s a sad state of affairs when someone has no shame, and sinks to defending reprobates like Mann and Jones. As I’ve often pointed out, it’s Gresham’s Law applied to human nature: the dishonest people in the population drive the honest ones out.
Skeptics are the only honest kind of scientists. That is not in dispute. And since the Climategate charlatans knew they were emitting bogus propaganda, they reverted to their ethics-challenged lack of character. They deliberately connived behind the scenes to drive out other scientists who simply had a different scientific point of view!
Their actions could not be more reprehensible, and their defenders here seem to be no different.
it is certainly a time for “useful idiots” – not surprised they were sent here – a compliment
What do you do with them? So far I haven’t found one useful thing about them 🙂
The title of the book is “Why Scientists Disagree About Cimate Change” To be true to its title it must adress the agreement among scientists. However, in its opening paragraph it uses a premise that is not part of the scientist’s claimed consensus.
All the reading comprehension comments have got it wrong. Let me illustrate with an exagerated example.
If I were to say: “It is claimed that “97% of scientists agree” that the moon is made of cheese.”
The bit in inverted commas is obviously supposed to relate to the bit they agree about.
If we can prove the claim was in fact made, we then have two options.
1) We can show the claim is wrong
2) We can show the “97% of scientists agree” is wrong.
We can easily show that the claim is wrong by surveying scientists and finding that in fact 100% disgree with the statement. This says nothing about whatever it is that 97% of scientists agree about.
Since we don’t know what it is they agree about from the given information, it is impossible to show the latter. In fact, what they agree about in my example is that AIDS is caused by HIV – but we cannot possibly know that unless the 97% are said to agree with the second part of the senrtence
Therefore unless the statement about what the scientists agree about is actually what they are claimed to agree about, whatever evidence we produce to show that the statement is wrong only shows the claim to be wrong, not what the agreement is supposed to be about.
Reblogged this on Norah4you's Weblog and commented:
Consensus is a political term and has nothing whatsoever to do with Theories of Science.
Nor does it matter if there had been a majority believing that there was a CO2-threat.
argumentum ab auctoritate
Professor X, Professor of Science A presents an argumentation for a thesis. You need to remember that due to the thesis being presented by a professor. That goes for all cases, whether this professor pronounce him-/herself within his/her own scientific field or in other science fields. A thesis or an argument presented by a professor does not mean that the professor is credible because he is a professor. In other words: It does not necessarily mean that the professor’s statement, even if it is within his own territory, is sound and free from biases as well as independent of the influence of research grants from the interest group. Business, individual interest groups, etc. Authority is no safe criterion of credibility.
Ad hominem
When ever an argument attacks a person instead of presenting valid arguments for the the own view by a speaker or writer behind a thesis being argued against, that’s one of the worst fallacies of all in Theory of Science. In other words if the arguments used to take down an opponent is related to person or person’s opinion instead of being related to the content of the discussed subject, those arguments aren’t valid arguments and can never ever be used for a sound conclusion.
Commonly found in newspaper articles, in political debates and being used to defend a criticized hypothesis. (cf. the climate debate) Fallacies in argumentation
Presenting a strawman argument about a non-existent strawman.
Pathetic
Many comments below expose your vacuous argument so try your links and trivial arguments back at the climate change carnival, where you will find willing marks who are happy to be entertained by drivel.
I’m as much of a skeptic as you are, Anthony, and I very much appreciate your efforts to combat the global warming insanity. But whenever I see material stemming from organizations such as the Heartland Institute or the Cato Institute on your site, my heart sinks. Not that there is necessarily anything wrong with these institutions, but they are so strongly identified with right-wing causes that their effectiveness in expressing skepticism is severely weakened. As with anyone supported by them. There is already far too much politically oriented bias in this debate, why add more? Isn’t it possible to find scientists doing meaningful research in this arena who don’t have a political ax to grind? Your blog would be much more effective if you were able to separate the wheat from the chaff in this respect.
I used to “feel” that way as well, but a fact is a fact whether it comes from Heartland or the WH. I know feel that in order to diffuse the power that the alarmists have by pointing to potentially biased sources that I should acknowledge it could be (trust but verify) more prone to bias but give it the due it deserves if it validly points out a fact.
If I can do that well, it forces them to acknowledge facts that they dismiss because they come from a fossil fuel company. It’s harder, but worth it in the long run IMO.
21 conferences? What do we have to show for it? How much carbon emissions did each conference generate? Why can’t some (most) tele-commute? Because…IT’S PARTY TIME! (official business…I go on vacation next month)
Re: Why Scientists Disagree about Global Warming, 11/30/2015
Scientists disagree about “Global Warmint” because scientists disagree about what constitutes science.
Two kinds of science occupy the stage today, Modern Science, founded by Francis Bacon in 1620, and Post Modern Science, its deconstruction by Karl Popper circa the 1930s. Both involve models of the real world. Bacon inserted Cause & Effect into models, giving models the power to predict deductively. Popper removed causation.
In Modern Science model quality is determined solely by predictive power. In Post Modern Science, models are graded according to three criteria: peer-review by a certified audience of peers, publication in a certified professional journal, and support from a certified group of practitioners. Popper called those three intersubjectivity. Modern science is exclusively objective within its models.
Modern Science grades each of its models progressively as conjecture, hypothesis, theory, or laws, according to the completeness of the model and of its validation.
Post Modern Science has no requirement that its models actually work. So, they don’t. PMS models are arguable, but not verifiable.
The Anthropogenic Global Warming (AGW) model, once a conjecture by Guy Callendar, has failed its only practicable verification. Its Equilibrium Climate Sensitivity (ECS) parameter now measures at or below 1ºC per doubling of CO2, which is less than the 5% confidence level, extrapolated from IPCC reports.
The failure runs much deeper. First, AGW is a thermodynamic climate, and nothing in the model is ever in thermodynamic equilibrium. Second, the definition of the ECS requires CO2 to be the Cause of the Effect of warming. Causation in Modern Science requires a Cause to precede all of its Effects. In climate, the concentration of atmospheric CO2 lags, not leads, the Global Average Surface Temperature. The causation vector between CO2 and GAST is backwards in AGW.
The reason it is backwards is that Post Modern climatologists have yet to discover Henry’s Law of solubility. That Law predicts the flux of CO2 between the atmosphere and surface waters, increasing to the atmosphere following surface warming, and decreasing during cooling. Earth’s atmosphere today is dominantly a by-product of the oceans, its two dominant greenhouse gas concentrations being determined by solar effects.
Another fatal shortcoming of the AGW model is that it cannot account for the dominant characteristics of the climate, namely the oscillations between warm and glacial eras. That failure occurs in the long term over geological eras, but also in the immediate, short term. The climate is currently warming as it recovers from the last Ice Age and as it recovers from the Medieval Warm Period. The GCMs don’t account for that natural warming and instead incorrectly attribute that natural warming to the effects of humans since the beginning of the Industrial Revolution.
The Global Circulation Models (GCMs) by which the climatologists project GAST (instead of predicting it) fail to model the most powerful feedback in climate: the dynamic effects of cloud cover. That feedback is positive (causing warming) with respect to the Sun, and it is negative (mitigating warming from any cause) with respect to surface temperature. This omission doomed the AGW model from the outset.
In Modern Science terms, AGW is less than a conjecture; it is off the scale of scientific models.
+1
But climate science isn’t based on models. The physics are there to see, the greenhouse effect is old news, CO2’s increasing concentration is being measured, isotope measurements and simple chemistry determine the increase is mostly from fossil fuels, and changes in greenhouse warming on the surface of the planet has been measured.
It’s all been measured, so Modern and Post-Modern back each other up. Predictions based on physics and chemistry have been observed.
Measurement of increasing CO2 greenhouse effect http://www.livescience.com/49950-greenhouse-effect-measured-us.html
If the Greenhouse Effect is warming the planet in response to CO2, then why has CO2 NEVER influenced temperature before the Age of Oil? Why are the satellites showing NO tropospheric warming for almost two decades, right where all that warming should be in the Greenhouse Theory? Why did the planet heat up drastically in the first third of the Holocene Interglacial when CO2 levels were low and now has been growing progressively cooler since the Holocene Optimum even as CO2 levels continue to increase?
Answer: AGW is bollocks. Not a single AGW prediction has been proven true. CO2 doesn’t heat the planet.
CAGW is bollocks. AGW is non zero. but far, far closer to zero than the consensus acknowledges. Beware of blanket rejection of consensus claims because more often than not, there’s a kernel of truth buried in the noise and they will always spin your objection as denying the tiny truth buried by their obfuscation.
+1 for identifying the wiggle to the worm, the poop to the scoop, the bait on the hook
b fagan,
Yes, the physics is there to see. However, you’re still relying on coincidence to support that most of the presumed temperature increase is from CO2, rather then the result of the natural variability that’s been going on for billions of years . CO2 is monotonically rising for sure, but the temperature has no such monotonic signature, so jumping to the conclusion that incremental CO2 is driving the climate is not only unsupportable, but falsifiable.
The physics of Stefan-Boltzmann is also there to see and an increase of 0.8C from 1 W/m^2 of forcing dictates an increase in surface emissions of about 4.3 W/m^2. How can anyone with a brain accept that only 1 W/m^2 of forcing can increase surface emissions by 4.3 W/m^2? The answer is simple, political bias acts as powerful blinders to the truth.
B,
The human contribution is the global warming since the end of the LIA cold period about 165 years ago is negligible. A doubling of CO2 would produce about 1.2 degrees C of warming, in the absence of feedback effects. Much of this slight potential man-made warming should have occurred already, as CO2 grew from 285 to 400 ppm since c. AD 1850. But the majority of the warming during this interval has been from natural causes.
The only way alarmists can make their GIGO model results scary is by assuming positive feedback effects not in evidence, such as from water vapor. The models have failed totally. Net feedbacks are probably negative, so that actual effective AGW ought to be in the range of zero to one degree C.
So far more CO2 has been a good thing for plants and the planet. More will be even better, as is slightly warmer weather, should it occur. If it’s not a bad thing, as all the observational evidence indicates, then why worry about rising CO2?
The evidence that water vapor feedback is NET negative is clear when the end to end effect is considered, which includes weather. The NET effect of evaporation, clouds and rain is cooling as evidenced by the trail of cold water left in the wake of a hurricane. If the NET feedback was positive, hurricanes would leave a trail of warm water.
Sorry. For “is” in first sentence, please read “to”.
CO2,
Yes, the failed hypothesis is easily falsified, on all time scales.
CO2 levels have allegedly been rising monotonously since the end of WWII, but for over 30 years the world reacted to this increase by cooling pronouncedly. Then, in 1977, the PDO flipped and for at most 20 years, rising CO2 and climbing temperatures accidentally coincided. For at least 18 years now GASTA appears to have stayed flat or cooled, to the extent it can be measured.
Thus the presently increasing CO2 shows no correlation with rising temperature, rather has been associated predominantly with cooling, ie for over half of its 70 year duration.
Errata:
WAS: Warmint. IS: Warming.
WAS: AGW is a thermodynamic climate. IS: AGW is a thermodynamic problem.
WAS: recovers from the Medieval Warm Period. IS: recovers from the Little Ice Age.
Reply to Gloateus Maximus, Dec 1 at 11.53 am: You should not expect a precise 1:1 correlation between rising CO2 and temperature because for example when there is an El Nino event a mass of heat is released from the ocean driving temperature up regardless of what CO2 is doing. When there is a La Nina cooling event the ocean cools and the world does too – again regardless of what the CO2 is doing. Internal oscillations within the ocean-atmosphere-ice system help to drive temperature change independently of CO2 change. As you point out, there was a cool period between about 1950 and 1970. Conceivably some of that was due to the development of a cool phase in the Pacific Decadal Oscillation. But Russian data from Mikhael Budyko also show that aerosols emitted by our massive and dirty post-war industrial processes made the atmosphere hazier then. Those aerosol emissions got cleaned up with Clean Air Acts in the 1970s. In other words one cannot take a simplistic approach to this question. There are many drivers for change and all have to be accounted for.
polaramateur says:
You should not expect a precise 1:1 correlation between rising CO2 and temperature because…
That is just tap-dancing around the fact that the real world is falsifying your belief system.
The only corellation between CO2 and global T is that ∆T causes ∆CO2.
I can provide numerous examples of that corellation that have been empirically observed. But despite constantly asking, no one has ever posted observations consistently showing that ∆CO2 is the cause of ∆T.
The real world has spoken: the main causation is by temperature.
Prove me wrong — if you can.
1oldy,
Your ignorance is getting tedious. Note the “Note” in this chart:
[click in chart to embiggen]
And on a month/year chart, we see that CO2 always follows ∆temperature.
So 1oldy is wrong again, as usual. I post verifiable, empirical observations, while 1oldy posts… his assertions.
1oldy loses: game, set and match.
Past 18 years is covered in this chart.
Anyone can see that ∆CO2 follows ∆T, Mr. Prevaricator.
Here’s another one: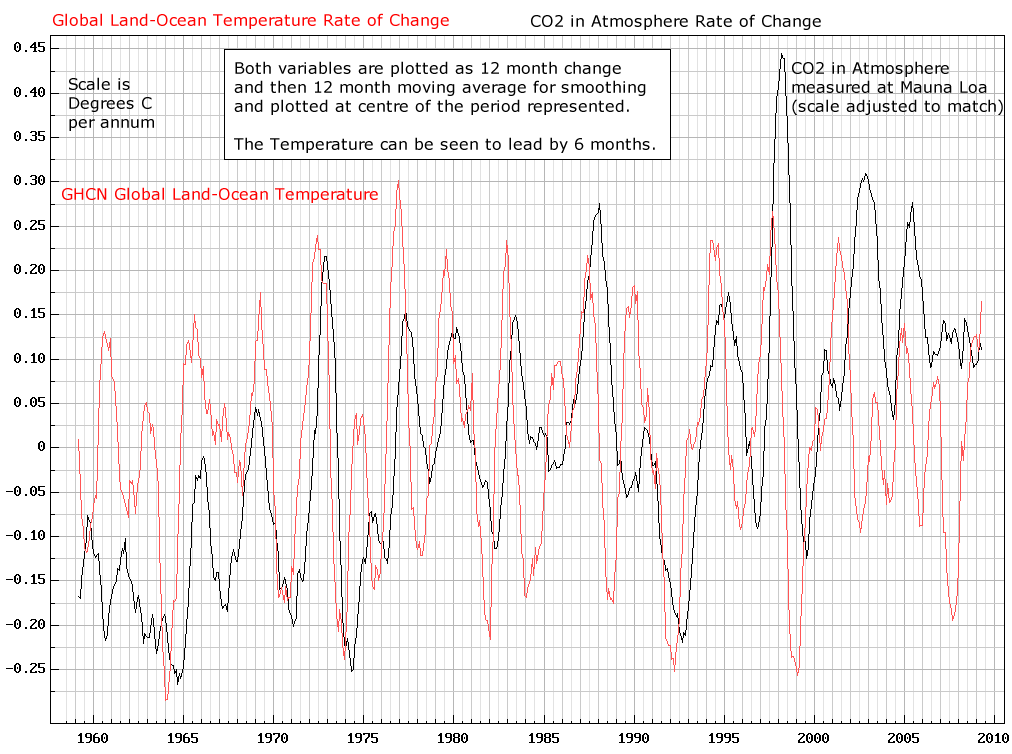
1oldy,
You could not have found a more lame chart. It shows nothing.
Anyway, I’ve buried you with charts and peer reviewed paper, and a few thorough discussions. They all show that you’re flat wrong…
as always…
1oldy sez:
Keep the charts coming there kid.
I will, Old Fart, because they show empirical observations that prove you wrong. The charts I’ve posted knock your lame arguments out of the park.
That’s because all you posts are merely your opinions. I post facts. So I win the debate, hands down. And re: your piddly complaint about ‘dt’, and other alarmist arguments:
• Temperature, among other factors, drives atmospheric CO2 much more than CO2 drives temperature. The rate of change dCO2/dt is closely correlated with temperature; thus atmospheric CO2 LAGS temperature in the modern data record. On a longer record, CO2 also lags temperature by ≈800 years in the ice core series. And atmospheric CO2 lags temperature on all measured time scales, from months/years, out to hundreds of millennia.
• CO2 is the feedstock for the biosphere; Earth’s atmosphere and oceans are clearly CO2-deficient. Therefore, CO2 reduction schemes are nonsense. In fact, they are evil.
• Earth’s climate is insensitive to increased atmospheric CO2 – there is zero evidence of any global warming crisis.
• Recent global warming is cyclical and natural – the next climate step change following the current ≈20± year pause will more likely be global cooling rather than warming. But no one knows.
• Adaptation is the best approach to deal with the moderate global warming and cooling.
• There is zero evidence for runaway global warming. It has never happened.
• Cold weather kills many more people than warm weather. There are about 100,000 excess winter deaths every year in the USA, and about 10,000 in Canada. Thus, the alarmist crowd is worried about the wrong thing.
• Global warming is a net benefit to humans and the biosphere.
• ‘Green’ energy has needlessly driven up energy costs, reduced electricity reliability and caused increased winter mortality, which especially targets the elderly and the poor. Not that alarmists care; they don’t.
• When politicians override the market with ‘alternate’ energy systems, real people suffer and die. That is the tragic legacy of false global warming alarmism.
You’re on the wrong side of the argument, bub. You’re allied with people who don’t act as if they believe a word they’re saying, and who could not care less about anyone else.
+1
The unintended consequences of the CAGW hoax are many.
response to dbstealey charts. The chart you use for Greenland is out of date. The Greenland ice core temperatures were updated and corrected by Bo Vinther in 2009 to take into account the changing altitude of the ice sheet with time. Be that as it may, your other chart of the rates of change of temperature and of CO2 is illuminating. It confirms two things: (a) as the sun warms the planet in the northern hemisphere spring it stimulates the biological system and we get, first, a lowering of CO2 as plants eat it, then a rise in CO2 six months later as they die and decompose (the northern hemisphere dominates because it has more land plants); (b) underlying all that annual wiggling about we get a rising trend in CO2 (human emissions),and a rising trend in temperature. You have to disaggregate the processes or you will fail to understand what is going on.
Response to the anonymous ‘polarscientist’:
This chart verifies that ∆CO2 is caused by ∆temperature:
[click in the chart to expand. Read the “Note”.]
On time scales from months to hundreds of millennia, the same relationship holds. But there is no correlation between changing CO2 and a subsequent change in temperature. And the chart above is from Antarctica, not Greenland. So what lame excuse will you invent now, to try and show that CO2 causes anything?
The Real World is busy debunking your alarmist nonsense. Maybe you get away with that carp on mindless political blogs. But this is the internet’s Best Science site, and you’re just an amateur trying to wing it here.
Response to dbstealey’s comment about the change in CO2 related to change in temperature during the Ice Age. Yes, it is true that past data did indeed suggest that the CO2 in the bubbles of fossil air trapped in ice cores rose 500-1000 years after the rise in temperature. That was noted back in 1999 by the French team analyzing the Vostok ice core. But that is now ‘old hat’. It was because we lacked an accurate way of dating the bubbles. The most recent data, by Frédéric Parrenin of the Laboratoire de Glaciologie et Géophysique de l’Environnement, in Grenoble (Science 339, 2013, pp 1060-1063) shows that through more careful analysis than hitherto you can get the correct bubble age. When you do, it turns out that the CO2 changed at exactly the same time as the temperature in the ice cores. Of course, that is not surprising, because when you warm ocean water CO2 comes out immediately, not after a wait of 1000 years. We are getting better at palaeoclimate science every year. But you have to keep up with the advances reported in the literature. Read Earth’s Climate Evolution and you’ll see where we’ve got to. And in these discussions there is no need to throw around tags like “amateur”. We can all debate these key issues in a civilised manner.
‘polarscientist’ says the fact that changes in T cause subsequent changes in CO2…
…is now ‘old hat’.
Wrong. CO2 LAGS temperature changes. Go argue with those (unrefuted) per reviewed publications. At least they give their names, unlike the anonymous ‘polarscientist’.
Ice bubbles are not the only proxies used, and the others agree with ice bubble evidence.
Next, ∆CO2 follows ∆Sea Surface T, too. No ice bubbles there…
And disregarding ‘bubbles’, on a monthly/yearly chart, ∆CO2 follows [is caused by] ∆temperature.
So the attempt to claim that CO2 does not lag temperature fails. It is nothing more than grant-trolling desperation.
This is not to say that CO2 has no effect on temperature. It very likely does, even though there is no measurement based evidence to confirm it, because the effect is so minuscule at current CO2 concentrations.
But the causation is clear: ∆T is the cause of ∆CO2. If the peer reviewed papers and the charts of empirical data provided here are not convincing to someone, that is because anyone unconvinced most likely depends on believing otherwise because theat’s how they are financially compensated.
I understand that motivation. But I also understand real world evidence, which shows conclusively that changes in CO2 are caused by temperature changes. And that real world evidence is corroborated by other proxies, just like global satellite temperatures are corroborated by thousands of radiosonde balloon measurements.
Reply to dbstealey. Annual CO2 follows temperature because of biology. The Earth warms in spring, CO2 is eaten by plants. As temperatures cool, in fall, plants die, their remains decompose, and CO2 is released to the air. That applies to the air as well as to the ocean.
With regard to ice cores, you cannot maintain that the old data showing a lag between CO2 and temperature is still correct, when the new data (Parrenin, Science 2013) shows that the old data were wrong. You have to follow the science as it changes, not stay with the old data merely because (although now proved wrong) it agrees with your particular (and now out-dated) world view.
This is how things worked in the Ice Age – orbital change warmed the ocean, which immediately released CO2, which fed back to temperature and warmed the planet more. So, in that instance thermal change was the driver. BUT – equally, in the geological record we find evidence for times when CO2 events caused temperature to rise, as at the Palaeocene-Eocene boundary 55 million years ago. So geology tells us we can have both (i) times when something changes Earth’s temperature (especially warming the ocean), which causes CO2 to change, and (ii) times when something changes atmospheric CO2, which causes temperature to rise. There’s ample geological evidence for both (i) and (ii) (read Earth’s Climate Evolution, published in October, and see). That means, when we come to the changes of the past 150 years, we have to seriously consider that we may be dealing with (ii) rather than (i).
The way to approach the temperature of the past 150 years is to remove from the temperature curve all those things that cause it to wiggle: sunspots, El Nino and La Nina events, the Pacific Decadal Oscillation, and large volcanic eruptions. What you are then left with is a fairly smooth increasing trend that does match the fairly smooth rise in CO2 (once annual CO2 changes are filtered out). This is all so obvious it is amazing most people have not done that for themselves. We do not need fancy numerical models to show us this stuff.
Polar,
You have failed to address the DomeC data which also shows a lag and which was processed with far more accurate methods than Vostok. (Monnin et al. 2001; Raynaud et al. 2005, Siegenthaler et al. 2005, Luethi et all) and at a much finer resolution.
Of course, this is a moot point, since the actual sensitivity of the surface temperature to forcing is somewhere between 0.2 and 0.3 C per W/m^2 and no where near the 0.4-1.2 C per W/m^2 claimed by the consensus whose outrageous value is required for the catastrophic consequences you so fear. Keep in mind that the extraordinarily high sensitivity claimed by the consensus not only lacks the extraordinary proof required, it lacks the most basic confirmation from first principles physics.
Why does the consensus deny the Stefan-Boltzmann LAW? The IPCC claims 1 W/m^2 of forcing nominally increases the surface temperature by 0.8C, but denies that the surface emissions increase by 4.3 W/m^2. I understand why this is denied since how can anyone believe that 1 W/m^2 can be amplified into 4.3 W/m^2. You need powered gain to get this much amplification which is not even a possible characteristic of the atmosphere.
Why does the consensus deny COE by claiming 1 W/m^2 results in 4.3 W/m^2 of incremental emissions? Where are the additional 3.3 W/m^2 coming from? The claim that this comes from positive feedback (without actually specifying the magnitude relative to joules, but instead to degrees) is absurd and demonstrates a complete misunderstanding of how gain and feedback work. No amount of positive feedback can create energy out of thin air as the consensus requires.
Finally, why does the consensus deny the second law of thermodynamics which tells us that a heat engine can not warm its source of heat? Certainly feedback from clouds and GHG’s accumulates with incident power to warm the surface, but the observable consequences of the second law precludes net positive feedback from water. Hurricanes are the proof which are localized, maximally efficient versions of the global heat engine driving weather and they leave a trail of cold water in their wake. If the end to end effect of evaporation was net positive feedback, storms would heat the surface. Yet another test of consensus claims that fails.
As far as I understand it, hurricanes leave cold water behind because they feed off the ocean’s surface heat. When a hurricane crosses the cold water trail of a previous hurricane, it slows down because it can’t get the heat from the ocean’s surface that it needs to sustain itself.
Yes. Weather consumes heat because it and all of the Earth’s circulation currents are the consequence of a global scale heat engine and the net effect of incremental evaporation leading to incremental weather is incremental cooling, or net negative feedback, even though water vapor itself does contribute to warming! Can you see how the incremental effect can be cooling while the accumulative effect is still warming? You can try and claim that the GHG effect of water vapor is important, and I don’t disagree, I just also understand that the end to end effect is more relevant to the net incremental effect. Please try and describe an end to end effect from incremental evaporation that leads to incremental excess warming.
NONE of the GCM’s that I know of take ANY of the newest information we have on geothermal activity on the ocean floor into consideration, and the “estimates” of surface volcanic venting are few and far between. In fact, I know of NO recent (in the past 20 years) published data that actually measures the volcanic venting…not eruptions…the daily, continual, 24/7 venting of CO2 and other gases from surface volcanoes, vents, and geothermal hot-spots from around the world. And the absolute LACK of measurements from the ocean floor should be embarrassing to climate scientists everywhere.
But since you seem to think that one “new” scientific study constitutes proof that all past science should be discarded, here’s some new science for you. Make sure all those old-study scientists are briefed on it will you?
http://onlinelibrary.wiley.com/doi/10.1002/2014GL063015/abstract
****************************
“Seafloor spreading is considered a small but steady contributor of CO2 to climate cycles on the 100 kyr time scale; HOWEVER, this ASSUMES a consistent short-term eruption rate. PULSING of seafloor volcanic activity may FEED BACK into climate cycles, possibly contributing to glacial/interglacial cycles, the abrupt end of ice ages, and dominance of the 100 kyr cycle.” (emphasis mine)
From the author of the above study during an interview found here-
http://www.sci-news.com/othersciences/geophysics/science-underwater-volcanoes-long-term-climate-02473.html
“People have ignored seafloor volcanoes on the idea that their influence is small – but that’s because they are assumed to be in a steady state, which they’re not,” said Dr Maya Tolstoy of Columbia University’s Lamont-Doherty Earth Observatory, who is the author of the study.
“They respond to both very large forces, and to very small ones, and that tells us that we need to look at them much more closely.”
“But were the undersea chains to stir even a little bit more, their carbon dioxide output would shoot up,” Dr Tolstoy said.
************************
Most unreal, stupid comment ever from the link below regarding the study above-
http://earth.columbia.edu/articles/view/3231
Speaking on the study quoted above by Maya Tolstoy-
Edward Baker, a senior ocean scientist at the National Oceanic and Atmospheric Administration, said, “The most interesting takeaway from this paper is that it provides further evidence that the solid Earth, and the air and water all operate as a single system.”
*Forehead smack* Wow NOAA….way to go! And here I thought the science that the “solid Earth, and the air and the water all operate as a single system” had been settled!
Aphan
I have a question if you don’t mind.
Why aren’t the paleoclimate charts showing LIA, MWP and the like
http://ice-age-ahead-iaa.ca/1/gisp2-ice-core-temperatures.jpg
updated to include Kobashi 2011?
http://wattsupwiththat.files.wordpress.com/2011/11/kobashi_2011_fig1.png?w=720
No trying to play gotcha.
Trying to understand who lives in the rabbit hole.
Appreciate your time.
Response to query about volcanic contributions from mid-ocean ridges. The Tolstoy article reminds us of the importance of sea level pressure in modulating the venting of CO2 from the volcanic systems on the mid ocean ridge, which have long been known to be one of the main Earth interior sources of atmospheric CO2 (the other being island arc volcanoes e.g. on the Pacific margin). Equally, we know that when large masses of ice pressed down on the underlying crust, eruptive activity was slowed, and it speeded up when the ice masses were removed (see Huybers and Denton 2009 in the reference list to Tolstoy’s paper). So there is a well documented link between CO2 and volcanism. But that link is just one facet in explaining the natural processes that led to a natural envelope for atmospheric CO2 over the past 800,000 years of between 180 and 280 ppm. We do in fact know a fair amount about subsea volcanism because we can measure its signature in deep ocean water – e.g. from the abundance of the Helium-3 isotope. And it is quite well studied around several main volcanic centres on the mid ocean ridge. It is not, as some people might like to think, a vast unknown in the climate equation.
polarscientist
December 1, 2015 at 2:28 pm
You should expect some reaction during over 30 years. The cooling began around 1940, with the war still raging, and lasted until 1977, when the PDO flipped. Pollution might have contributed a little, but if CO2 be the control knob on climate, then that and natural variation should not have so hugely overwhelmed the rapid, steady rise in CO2. The cooling was so pronounced that it convinced Callendar in 1962 that his 1938 AGW hypothesis had been falsified, and many scientists in the ’70s that the big ice age was just around the corner.
Moreover, the over 30 years of cooling followed around 30 years of warming from c. 1910-40 (the slope and duration of which match the late 20th century warming), which followed about 30 years of cooling from c. 1880-1910, which followed the first warming cycle of the Modern Warm Period, c. 1850-80.
These natural fluctuations are proximately driven by ocean oscillations and probably ultimately by solar activity. They operate during cold periods as well, like the Little Ice Age. The warming cycle in the early 18th century, coming out of the depths of the LIA during the Maunder Minimum, lasted longer and was stronger than the late 20th century warm cycle, supposedly man-made.
Reduced pollution may well have contributed to the late 20th century warming. Along with the natural cycles, there is thus little or no room left for CO2, which is hence not anything like the control knob on climate.
reply to gloateus maximus. The revised sunspot history by Clette et al in Solar and Stellar Astrophysics 2014 clearly showstle sunspot maxima of the 1780s, the Dalton sunspot minimum of the 1810s-20s, the sunspot maximum of the 1860s, the Gleissberg sunspot minimum of around 1900 and the subsequent rise to 1960, all of the maxima reaching about the same level. But temperature didn’t simply follow that path, as it should have done if the sun were its main control. Instead the underlying temperature trend was gradually upward from about 1850, modulated by those solar signals. In addition the trend experienced some downward coolings due to large volcanic eruptions, plus localised rises and falls due to El Nino and La Nina couples, and the longer duration swings due to the Pacific Decadal Oscillation. But the general trend was exponentially up, for which there is no natural explanation. Instead, we are left with the steady rise in greenhouse gases due to human activity, along with a rise in water vapour from the exponential warming. This has nothing do do with climate models – it has to do with straightforward observations. Now given that greenhouse gases cause warming, something we have known since the 1850s, it seems reasonable to suppose that there is a link between the exponential trend of temperature and the exponential trend of CO2, which parallel one another quite well when you take out the wiggles induced by sunspot variation, volcanic variation, and El Nino and PDSO variation. They key variation apart from these was the flat spot from 1945 to 1970. Climatologists suggested this might be due to industrial aerosols – basically dirty air. What they did not realised was that the Russians (Mikhael Budyko) actually had the data to prove that was the case. My point is twofold: (i) we do not need climate models to tell us what is going on; (ii) to extract the trends relating temperature and greenhouse gases, you have first to take out the thermal variability caused by other factors (sunspots, ocean cycles, volcanoes) which simply obscures the picture. Do that and the trends become clear. You might like to THINK that there is no relationship, but that’s because you have not dug deep enough. You have allowed the noise in the temperature record to obscure the underlying signal.
President Obama has used that exact terminology.
Just what are you talking about? The book in the OP addresses the “most widely repeated claim” and that assertion happens to be true. Every drooling idiot worried about AGW asserts that 97% figure as if it were handed down on Mt. Sinai, and then continues with assumption that AGW must also be “dangerous.” The true “dangerous” aspect is the promulgation of a lie (the 97% lie), which is then used to support extreme action. Cook et al. is one of the most pathetic bits of mutual ************ promulgated in the last century. It has been debunked, dismantled, deconstructed and utterly demolished as any kind of scientific analysis let a alone as an objective, quantitative study. Talk about straw men.
Fred Singer is the last thing we need… he is an “anti” that contaminates our message. He shilled for the tobacco industry and so now he has no credibility. He also worked for petrochem. He is a fly in our ointment. We should not be associating with soldout liars, rather we should disassociate from all those who have worked for Big Oil or any other ethics-free industry.
Send them only virgins ?
Why so quick to validate one of the tools of your opponent ?
knutesea-
My comment- Aphan December 3, 2015 at 5:54 pm was directed to polarscientist. I could have SWORN his comment had a reply button that would put my comment directly under his…so I didn’t even indicate that I was talking directly to him. (and HIS personal propensity for using the most recent scientific studies as if they cancel out the “old gospel” and become the “new gospel”….ooooooo I like that analogy!)
Does that address your question to me about the charts? Or do I need to answer that now? 🙂
Aphan
No rush on the answer, but I trust you to point me in the right direction.
Paste and link is fine since I’m sure you folks already ferreted out the goodies on the Kobashi data.
Whenever free to send would be just dandy.
I’m new to the rabbit hole.
Well, honestly, I don’t make paleoclimate charts, and I cannot speak for anyone that does in order to answer the question of why the existing ones haven’t been updated with certain information. There are many possible reasons why a particular scientist does or does not do it: non- agreement with the data, bias, busy, lack of awareness of it, laziness, not on a particular priority list, animosity, apathy, drunken stupors, car accidents, high holy holidays where chart updating must be shunned….:)
Have you googled kobashi et al 2011 and then clicked “images” to verify that none of those charts include the data? You can also go to the publication site of the article and check all the citation links to see if other scientists who mention kobashi et al 2011 have created charts that include it.
Thanks Aphan
I’ll dig around and stub my toe a few times.
Guilt by association fallacy. You have ZERO evidence that Fred Singer did anything even remotely wrong. Stop acting irrationally.
Mea culpa, in part. It seems Singer is indeed not guilty as I claimed re:tobacco. He however “believes in what Rachel White Scheuering calls “free market environmentalism”: that market principles and incentives should be sufficient to lead to the protection of the environment and conservation of resources.”, which would be laughable if it were not outrageous with all the blatant evidence of capitalist environmental atrocity to prove that false. “he has been a paid consultant for many years for ARCO, ExxonMobil, Shell, Sun Oil Company, and Unocal, and that SEPP has received grants from ExxonMobil. Singer has said his financial relationships do not influence his research.” There he really does sound like a corporate shill, making us all look like being shills for Big Oil.
Environmental atrocities are far worse in communist countries. Pollutiion is caused by agricultural, industrial, forestry, mining and other economic activity, not by a particular system. Free enterprise states do a much better job of keeping clean than do statist command economies.
I can’t think of anything that’s not better in an open society, but then again I don’t have kingly possessions to lose.
Daniel S,
That’s all you’ve got, isn’t it? It’s pretty pathetic, not to mention lame, when pointless ad hominem character assassination comprises your entire argument.
You come across as a shill for the eco-wacko contingent, not to mention a blatant hypocrite who badmouths the providers of essential goods while buying their products at the pump, full retail. And I doubt you’re shivering in the cold and dark at night. No, you’re a fat consumer of Big Oil’s carbon-laden molecules just like everyone else. If it wasn’t for such gross hypocrisy you wouldn’t have much if anything to say.
So you lose. This is a science site. You need to MovOn to a lefty politics blog. Here, you’re just being a site pest who’s got nothin’.
I see a lot of claims above that “dangerous” is not part of the consensus or that it’s not a commonly repeated claim that it is. The Wikipedia article about surveys of scientists’ views on climate change includes this: “In 2007, Harris Interactive surveyed 489 randomly selected members of either the American Meteorological Society or the American Geophysical Union for the Statistical Assessment Service (STATS) at George Mason University. The survey found 97% agreed that global temperatures have increased during the past 100 years; 84% say they personally believe human-induced warming is occurring, and 74% agree that “currently available scientific evidence” substantiates its occurrence. Only 5% believe that that human activity does not contribute to greenhouse warming; 41% say they thought the effects of global warming would be near catastrophic over the next 50-100 years; 44% say said effects would be moderately dangerous; 13% saw relatively little danger; 56% say global climate change is a mature science; 39% say it is an emerging science. [10] [11]”
So *in that sample*, 85% think its dangerous. That doesn’t make them right, but it *does* make “dangerous” part of the *reported* consensus.
We had a climate change march here. I was invited to it by a colleague (also with a PhD) who has swallowed the Cook article hook line and sinker. The marchers definitely believe that climate change is dangerous; who would march against climate change if they thought it was a good or neutral thing? I certainly have enough people telling me how
My country’s Environment Strategy, http://canterbury.cyberplace.org.nz/environment/env2010.html, says ” Gases released into the atmosphere are enhancing the natural greenhouse effect at a rate that could extensively damage our biophysical, economic and social systems.” “Extensively damage” sounds pretty dangerous to me, so claims that climate change is dangerous are definitely being produced by official sources. Indeed, in 2005, the following statements were made in Parliament: “the Pentagon has advised President Bush that climate change is a greater threat to humanity than terrorism” (a Green MP, but presumably a true claim) and “the science academies of all the G8 nations now say that the projections about climate change, and the damage it will do to our world, are indeed valid” (the Prime Minister of the day). So back then our PM was relying on an official “science academics” consensus that climate change was real and would do damage to the world, and I don’t see any difference between doing damage to the world and being dangerous.
Ad fontes! Let’s see what the book actually says. (BEGIN QUOTE)Politicians including President Barack Obama and government agencies including the National Aeronautics and Space Administration (EPA) claim “97 percent of scientists agree” that climate change is both man-made and dangerous.(END QUOTE)
That is, the authors say that POLITICIANS say that ‘dangerous’ is in the scientific consensus.
LNG Exports “OK’d” … well at least if you lobby correctly or maybe hire an ex Climate Czar
This one got very little press time. I mean Huffpoo picked it up, but it didnt get much further in the MSM.
Sharing in case anyone missed it.
http://www.huffingtonpost.com/steve-horn/obama-administration-appr_b_8559472.html
Makes me feel like I want to take a shower, but then again, that may not be a bad idea.
It all seems so selective. You get to LNG export here (encourages fracking). You get to ship via rail there.
You can’t have that pipeline over there.
Only some seem worthy of the evil fossils.
Perhaps access to profiting from it will be doled out like a fancy spice.
Re: CO2 lags temperature:
dbstealey, 12/2/15 @ur momisugly 11:14 am, said,
thus atmospheric CO2 LAGS temperature in the modern data record. On a longer record, CO2 also lags temperature by ≈800 years in the ice core series.
1oldnwise4me@ur momisuglyreagan.com, 12/2/15 @ur momisugly 11:29 pm, disagreed, explaining
Nope [¶] … [¶] Not for the past 18 years.
dbstealey is correct. And that is fortunate, because the record, properly understood, obeys the physics of Henry’s Law, which, as reported above, is yet to be discovered by IPCC-certified climatologists. However, dbstealey might better have said “CO2 lags temperature in the modern era“. The composition of the atmosphere changed radically during the crustaceous period when great amounts of CO2 were somehow removed from the atmosphere and sequestered in CaCO2 or chalk deposits.
In part, the problem is that the certified climatologists don’t have a good handle on the amount of CO2 in the atmosphere. For their failed AGW model, they need the MLO data to represent global concentrations. To do this, they argue that CO2 is first long-lived in the atmosphere, and therefore well-mixed. This makes the MLO data global by assumption, and so they calibrate the CO2 network into agreement with MLO. Presto! MLO is also global by calibration!
MLO is seen not to be global by the satellite images of atmospheric CO2. The gas is quite lumpy, about as well-mixed as other clouds. And CO2 is not long lived. The recent article here that CO2 residence time is 40 years instead of 1000 years is wrong on both ends. It’s residence time follows an elementary, leaky-bucket formula from high school physics, reported in both the TAR and AR4 glossaries. Residency depends on the size of the reservoirs and the leak rates, estimated throughout the Assessment Reports. Using AR4 numbers, the atmosphere contained 760 GtC lost at the rate of 482.8 GtC/yr [2.8 (Other Ocean uptake) + 120 (Gross Primary Production) + 270 (Leaf water) + 90 (Ocean uptake)], or 66.14% removed per year. The formula then yields a Mean Residence Time (MRT) of 1.51 years. The TAR estimates the same atmosphere concentration, but the uptake only included GPP and Ocean, a total of 210 GtC/yr, and so the formula yields an MRT of 3.48 years. Not 1000 years and not 40 years. Not 35K years, but about 1.5 to 3.5 years.
The certified scientists needed more atmospheric CO2 for their model. So thanks to AR4 Ch. 7 Contributing Author David Archer, PhD, computational oceanographer, he estimated the MRT at 35,000 years (The fate of fossil fuel CO2 in geologic time, 1/7/05, p. 16). His model was that the equilibrium carbonate equations applied to the surface ocean. This meant that the ocean could uptake CO2 only as fast as room could be made by acidification and sequestration, and sequestration, of course, required millennia. IPCC went along with Archer, adopting his model (AR4 Eqs. 7.1 – 7.2, p. 529), but softening 35,000 to “several tens of thousands of years”, p. 531.
The AGW team thus created a novel bottleneck to the uptake of CO2, silently applying the universal assumption of equilibrium. The surface layer (like all other parts of the climate) is never in equilibrium, neither mechanical nor thermal nor chemical, the three components of Thermodynamic Equilibrium. The equations do not apply. Instead, the surface layer is the buffer holding excess CO2, and the atmosphere to ocean flux can proceed to satisfy Henry’s Law, instantaneously on climate scales. Henry’s Law is primarily dependent on the gas concentration and the solvent temperature, secondarily, for the ocean, dependent on salinity, and possibly dependent on the isotopic weight of the carbon. It was not known to be dependent on solvent pH until Archer and the IPCC.
BTW, the team applied its bottleneck model only to anthropogenic CO2, and not to natural CO2. The team did so in spite of the facts that the two differ only in their isotopic mix, and that the two are irreversibly mixed in the atmosphere.
IPCC never applied its residence time formula from its appendices. It just assumed an atmospheric bottleneck, contrary to physics, so that enough CO2 might accumulate in the atmosphere to show that climate was controlled by the CO2 and the greenhouse effect.
So what does the MLO record actually represent? The site sits in the outgassing (Henry’s Law) from the bulk of the Great Ocean Conveyor Belt in the Eastern Equatorial Pacific. The Conveyor Belt, also called the Meridional Overturning Circulation, carries water at 15 times the total volume rate of all Earth’s rivers, on a cycle of about one millennium. Cold water, saturated with CO2, rises from the bottom of the ocean in the Ekman Transport, losing pressure and heated from concentrated radiation of the Equatorial Sun. The warm, humid, and lightweight mixture rises in the atmosphere, up into the Hadley Cells, where a cold, CO2-rich mixture is delivered into the subtropics, and onto Hawaii.
Meanwhile, the warm, and hence CO2-depleted, lightweight outflow water feeds into the oceanic surface layer. It is carried poleward across the surface, radiating heat to space, and absorbing CO2 (Henry’s Law). Near the poles, at its coldest temperature and now saturated with CO2, it descends to the bottom to return to the Equator. It’s the misnamed thermohaline circulation, missing carbon in its name.
Consequently, Hawaii sits in the plume of outgassing from about 60% of the Great Conveyor Belt, where CO2 concentrations are from old water, dependent on the global concentrations of many centuries past. CO2 is likely increasing at Hawaii because Earth was colder, say 500 to 1000 years ago, and warming to the modern era.
This GCB path, and hence the CO2 record (if it were known), requires about 1,000 years, CO2 lagging temperature.
That post employs several questionable assumptions. The bulk of the upwelling of old CO2 rich water within the thermohaline conveyor system in fact happens in the Southern Ocean around Antarctica. Besides, Mauna Loa (MLO in that post) is not the sole point for measuring background atmosphere CO2. It is also measured, among other places, at the US South Pole station. At both Mauna Loa and South Pole we see two things in the CO2 data. First there are the annual ups and downs due to biology (plants eat CO2 in spring and it gets released by death and decomposition in the fall, the global signal being dominated by the northern hemisphere). Second, the annual variation is superimposed on a steady rise. That rise correlates directly with the rate of change in the isotopic composition of the carbon in the CO2, which can be shown to relate directly (i) to the known emissions from fossil fuel burning, and (ii) to the rate of decrease of oxygen in the atmosphere, which is a result of the increase in burning fossil fuel. Hence the rise is not due to some imaginary likely increase in the emission of old CO2 from the ocean depths.
What is regularly ignored is the fact that CO2 is harmless, and beneficial to the biosphere. More is better.
Therefore, all the wild-eyed talk about “carbon” is off the mark. We need more CO2, not less.
Yes,increasing CO2 in the air is good for land plants. BUT it also warms the planet. That warming is already displacing plants, insects and animals, changing local ecologies. It is already melting land ice, causing sea level to rise, which will impact coastal populations. It is likely to disrupt hydrological patterns making some areas drier and others wetter than now. And when you put CO2 into the air it also goes into the ocean, making it less alkaline, which is not good for creatures at the base of the food chain.
colin summerhayes,
Are you able to quantify any of the things you mentioned? For example, just how much ‘warming’ has been caused by human CO2 emissions? Be specific, and be prepared to support your answer with real world measurements — if you have them.
The rest of your examples are no different. They are just repeating the alarmist narrative, without any verifiable measurements or other evidence of causation.
Either your comment is based on evidence-free emotion, or it is science-based. If it is the latter, you should have no trouble locating verifiable, empirical, testable measurements quantifying those putative changes. Do you have any such measurements?
Colin-what you say, and how you say matters, in scientific discussions in particular.
“But it (increasing CO2 in the air) also warms the planet.”
No. It does not! CO2 in the air simply slows the rate of cooling, by interfering with the rate that infared energy of certain spectrums returns to space. The Sun warms the planet.
Humans now know that the Earth has always responded to warming periods in the ways you describe. Naturally. For eons of time, ecologies have changed, ice has melted (and grown) sea levels have risen (and fallen) hydrological patterns have changed, and CO2 has gone into the oceans, and come out of it again. Scientific evidence proves that sometimes those things have changed slowly over 100s-1000s of years, and sometimes those things changed in mere decades. And some things, like the temperatures and alkalinity of the water in the oceans fluctuates every day.
Humans are a fairly recent addition to life on Earth, and so one must look at changes on Earth during humanity’s presence in relationship to how Earth has changed in the past without humans. Humans have been building cities on the shores of our oceans for tens of thousands of years, only to have them destroyed by natures forces, some forever lost, and others stubbornly rebuilt. This is human folly, especially now that we know what we know.
Of course, the Sun warms the planet – it our main source of energy. But, its effects are modulated by processes at or near the Earth’s surface, which explains why there was much more warmth in the Cretaceous, and why the planet cooled since then. That warming was caused by an increased volcanic output of CO2 and associated evaporation of H2O from the warm ocean; the subsequent cooling was caused by mountain building and associated chemical weathering that extracted CO2 from the atmosphere. Similarly the fluctuations of warmth in the Pleistocene were due to orbital change modifying the Sun’s effects. The Sun itself also changes, for example on the Suess Cycle. Large volcanoes cool the climate. The point is that none of these operant processes has operated in such a way as to cause the current warming. The only thing we can find is our own outputs of greenhouse gases. Nobody has yet found anything else that could be causing it.
polarsci says:
Nobody has yet found anything else that could be causing it.
Causing what? Global warming stopped many years ago.
So much for your failed conjecture.
You may not have noticed, but while the Pacific has been cooling, the Arctic has gone on warming significantly over the past 20 years. Hence what we see as global temperature has to be seen not simply as a function of rising CO2, but also of other influences like volcanoes and El Ninos and the Pacific Decadal Oscillation (currently in a cool phase). The fact that things have gone on warming significantly, despite what the average global temperature says, is demonstrated by the continuing rise in sea level, which shows no flat spot. Rising sea level is a product of warming (i.e. expanding) the ocean plus melting (of land ice). To understand the workings of our climate system you have to examine ALL of the variables.
polarsci,
Maybe you can get away with that nonsense on the climate alarmist blogs inhabited by a small contingent of head-nodders, but here on the internet’s ‘Best Science’ site, we see when someone is trying to pull a fast one.
The most accurate global temperature data comes from satellites. Here is RSS:
http://realclimatescience.com/wp-content/uploads/2015/06/ScreenHunter_9549-Jun.-17-21.12.gif
And rather than global T being even partly attributable to CO2, the empirical evidence shows that there is no correlation at all. Furthermore, you have the causation backward. It is:
∆T causes ∆CO2. There is a mountain of empirical evidence showing that causation. But there is no such evidence showing that rising CO2 is the cause of global warming.
Next, we already know the sea level is rising. It has been rising since the Little Ice Age, and since the last great stadial before that. But the climate alarmist narrative: that SL rise is accelerating, has been thoroughly and repeatedly debunked. So don’t even bother going there, or I’ll bury you in real world evidence to the contrary. And your “flat spot” argument is just prevarication. Sea levels have been steadily rising — naturally. There is no evidence that human activity has caused the rate of natural SL rise to change.
You attempt to justify your SL misinformation by saying:
The fact that things have gone on warming significantly, despite what the average global temperature says…
“The fact”?? The only relevant fact is that global warming stopped many years ago. Cherry-picking limited areas in the hope of making a case for ‘dangerous AGW’ is the best argument the alarmist cult has. But the scare is over global warming, so that argument fails.
Finally, you say:
To understand the workings of our climate system you have to examine ALL of the variables.
But it is clear that you have such a limited understanding of the issue that you would be far better off taking my helpful advice: read the WUWT archives on this subject. It will take you several weeks of full-time reading to get up to speed of the average reader here. Because right now, the only Authority that matters — Planet Earth — is debunking the ‘dangerous AGW’ nonsense. Everything currently being observed has been exceeded in the past, and to a much larger degree. There is nothing either unusual or unprecedented happening.
All the wild-eyed Chicken Little-style clucking and arm-waving about ‘global warming’ is over this minuscule change in global T:
That *tiny* fluctuation — over more than a century — is a smaller change than at any comparable time period in the geologic record. The alarmist cult has picked the easiest argument imaginable for skeptics to debunk. The unusually small fluctuation of only ≈0.7ºC over a century is as flat as anything you can find. Yet it is the putative example of ‘runaway global warming and climate catastrophe’ that is being peddled to the public by an ethics-challenged clique of rent-seeking scientists…
…you wouldn’t happen to be on the receiving end of any federal or .edu taxpayer loot, would you? It’s the only thing that would explain your strange view of the real world.
I suppose ‘Colin Summerhayes’ is the same guy in this 10-member “working group” that presumes to speak for thousands of professional geologists:
http://www.geolsoc.org.uk/~/media/shared/documents/policy/Climate%20Change%20Statement%20Addendum%202013%20Final.pdf
I also assume that “polarscientist” is Summerhayes, or maybe another member of that same self-selected group. But my guess is he’s one and the same.
After reading the .pdf linked above, I have to LOL! None of those guys would dare to engage in a fair, moderated, public debate with geologists who are skeptical of the “dangerous AGW” hoax. Because Mr. Summerhayes and his friends would be demolished in any such debate. They have no evidence connecting human CO2 emissions with changes in polar ice. All they have are the usual assertions that we see in their self-serving paoper.
So instead of debating they argue here, where they can hide behind their fake screen names. But I am glad they do anyway. Because they display the total scientific failure of their position.
For example, there is no CO2/T causation demonstrated in that paper. It’s no different from the usual T/CO2 overlay graph, when they say that at the same time global T was a few degrees warmer, CO2 was also higher. So what? The unanswered question is: which came first?
There is plenty of empirical evidence showing conclusively that ∆temperature is the cause of ∆CO2, while there is no comparable evidence showing that changes in CO2 are the cause of changes in temperature. In other words: ∆temperature came first, and ∆CO2 was the result.
And that is the crux of the entire debate. Because if CO2 does not cause global T to measurably rise, then the CO2=AGW conjecture is (if not falsified outright) shown to be inconsequential.
Therefore, no more public money should be wasted on that scare, or on any associated scare such as polar ice levels. Mr. Summerhayes and pals have coasted for too long on the public dole. They need to either produce verifiable, testable, empirical measurements showing that human CO2 emissions affect polar ice, or they need to get their fingers out of the public’s wallets.
Where are those measurements, Mr. Summerhayes? So far, you have lots of assertions — but zero measurements quantifying the changes you claim are due to human emissions.
You do love insulting people, don’t you. Ah well! I will not be drawn into that game.
Your NODC graph shows that ocean heat content did rise significantly from 1970 to 2004. The Wunsch graph shows total ocean heat content rising from 1994 to 2009. The altimetric ENVISAT data confirm that sea level rose along with those changes. The rate of rise of sea level was lower earlier in the last century and rose to ENVISAT levels (3.2mm/yr) late in that century. The groundwater data you cite does not change the overall picture of sea level rise, because, as the IPCC pointed out, while they could see what the rise was, and were certain that some of it came from warming the ocean and some from melting land ice, they were unsure where the rest came from. The Nature paper by Pokhrel et al 2012 shows where the missing bit came from, but doesn’t change the overall rate of rise picture.
As I keep pointing out, you cannot just focus on CO2 and temperature, because other things contribute to temperature change and can thus distort the underlying relationship between temperature and greenhouse gases. That explains why the 1997-98 El Nino gave rise to a massive temperature signal when there was no similarly large change in CO2 emissions. Equally, back in geological time, the 55 million year ago carbon event drove temperature change. There was no external thermal event capable of causing 5-6C of warming in a very short space of time. It was the emission of carbon to the atmosphere that made temperature rise. That carbon emission was large enough not only to warm the atmosphere by that amount, but also to acidify the ocean, making the CCD rise by about 2 km, and to cause sea level to rise by about 12m. A big event. The data has all been published by Jim Zachos and others. It puzzles me why you refuse to accept that, and the disconnect between temperature and carbon in, for example, the 1997-98 El Nino and the 2008 La Nina events. Perhaps you find it inconvenient to do so because those temperature rises did not drive significant CO2 rises, hence negating the guts of your hypothesis.
“Hence the rise is not due to some imaginary likely increase in the emission of old CO2 from the ocean depths.”
Imaginary likely? Like all the climate models today?
Its almost like you are saying that the (14c NEUTRAL) CO2 that results from a continual deep upwelling around Antarctica doesn’t spread around the world as part of that “well mixed atmosphere” that everyone talks about? Does the naturally 14c NEUTRAL water from those up-wellings NOT get mixed in with the other water in the oceans and thus spread around the world? Can the 14C NEUTRAL CO2 that comes from the deep ocean up-welling be distinguished from the 14c NEUTRAL CO2 that gets produced from burning fossil fuels?
Peer reviewed, recent, scientific papers-
http://www.mathis-hain.net/resources/Hain_et_al_2014_EPSL.pdf
http://instaar.colorado.edu/~marchitt/reprints/bryanepsl10.pdf
WUWT article from 2008 by Roy Spencer-
http://wattsupwiththat.com/2008/01/28/spencer-pt2-more-co2-peculiarities-the-c13c12-isotope-ratio/
The distribution of carbon isotopes in atmospheric CO2 is such that there is a gradient with less 13C towards the north, which one would expect since there is more fossil fuel burnt in the northern hemisphere. Moreover the isotopic change matches onto the change expected from knowing the isotopic composition of the fossil fuel that has been burnt, and the amount burnt over time. The distribution of 14 C in modern air follows the same pattern, as one would expect from its dilution by fossil fuel burning. Finally, the combustion of fuel removes oxygen from the atmosphere, as is shown by the inverse relation between growing CO2 and declining O2 (see Manning, A.C., and Keeling, R.F. (2006) Global oceanic and land biotic carbon sinks from the Scripps atmospheric oxygen flask sampling network, Tellus 58B, 95–116).
Re: CO2 lags temperature:
Re: polarscientist, 12/4/2015 @ur momisugly 12:53 pm writes,
That post employs several questionable assumptions. The bulk of the upwelling of old CO2 rich water within the thermohaline conveyor system in fact happens in the Southern Ocean around Antarctica.
Upwelling occurs all around the globe along coastlines. These are local, wind and ocean current driven phenomena. The upwelling from the Ekman Transport at the Equator connected to the Intertropical Convergence Zone (ITCS) is global and persistent. It is the monster of upwelling, a feature of Earth’s surface that can be seen from space.
polarscientist’s comment about the bulk of the THC (MOC) occurring in the Southern Ocean and around Antarctica can be found in the literature, but it was never more than a speculation. See Marshall, J. & K. Speer. Closure of the [MOC] through Southern Ocean upwelling, nature geoscience, 2/26/2012. They write,
The main theme of this Review is the key role of Southern Ocean upwelling driven by westerly winds, drawing water up to the surface. This largely solves the missing-mixing paradox that has remained a theme of oceanographic literature. In that paradox, all dense water was assumed to upwell through the thermocline to close the circulation. To do so, strong vertical mixing is required in the thermocline, mixing that is not observed. Instead it seems that a significant portion of the water made dense in sinking regions ultimately returns to the surface in nearly adiabatic pathways along tilted density surfaces that rise from depth towards the surface around Antarctica (as hypothesized long ago by Sverdrup). Footnotes deleted, bold added, Marshall (2012) p. 171.
The absence of a strong vertical mixing invalidates the Southern Ocean MOC terminus model. What follows in the Marshall citation is but another speculation, and the authors suggest an entirely different terminus in their cartoon of the MOC. Id., Box 1, p. 177. In that diagram, the MOC terminates at the Eastern Equatorial surface in both Indian Ocean and the Pacific. It is there at the Equator that a strong, persistent, vertical current exists, and it is shown in several papers available online. See, for example, Ocean in Motion: Ekman Transport Background, http://oceanmotion.org/html/background/ocean-in-motion.htm
polarscientist next says
Besides, Mauna Loa (MLO in that post) is not the sole point for measuring background atmosphere CO2. It is also measured, among other places, at the US South Pole station. At both Mauna Loa and South Pole we see two things in the CO2 data.
But as IPCC says, the MLO record is the master time series and that measurements on Mauna Loa in Hawaii provide a true measure of the global carbon cycle AR4, ¶1.3.1 The Human Fingerprint on Greenhouse Gases, p. 100. IPCC also says it has a global surface sampling network … that is … inter-calibrated . TAR, ¶3.5.1, p. 205. It says it must resolve less than 1 ppm “annual average” in a background of 15 ppm in “seasonal variations” as great as 15 ppm, and to do so requires high quality atmospheric measurements, measurement protocols and calibration procedures within and between monitoring networks. TAR ¶3.5.3 Inverse Modelling of Carbon Sources and Sinks p. 211.
Calibration means to adjust the data into agreement, and into agreement of course with true measure, the master time series, i.e., MLO. IPCC justifies these data adjustments as follows: Because CO2 is a LLGHG and well mixed in the atmosphere, measurements made at such sites provide an integrated picture of large parts of the Earth including continents and city point sources. AR4, ¶2.3.1 Atmospheric Carbon Dioxide, p. 138.
As pointed out above, that CO2 is a Long Lived GreenHouse Gas is a false assumption, disproved by IPCC’s own data and formula.
polarscientist continues:
First there are the annual ups and downs due to biology (plants eat CO2 in spring and it gets released by death and decomposition in the fall, the global signal being dominated by the northern hemisphere). Second, the annual variation is superimposed on a steady rise.
polarscientist is not talking about the data, he’s talking about a slightly upward curved trend line with a superimposed saw tooth seasonal variation that published reports represent in place of data. These are not measured, but are the subjective creations of investigators. Neither IPCC nor its sources show these curves superimposed on raw data, but sometimes on investigator filtered data. [Raw data are the complete set of the first samples in scientific coordinates (not voltage, for example).] For the sake of argument, let’s assume that the curves are unbiased and fit the data well, but these certified climatologists provide no data by which an independent scientist or statistician could validate the fidelity of their smoothed curves.
That rise correlates directly with the rate of change in the isotopic composition of the carbon in the CO2, which can be shown to relate directly (i) to the known emissions from fossil fuel burning, and (ii) to the rate of decrease of oxygen in the atmosphere, which is a result of the increase in burning fossil fuel. Hence the rise is not due to some imaginary likely increase in the emission of old CO2 from the ocean depths.
polarscientist here refers to IPCC’s fingerprint analysis by which it concluded that the rise in CO2 was manmade. For the diagram and analysis, see SGW, Part III, Fingerprints, http://www.rocketscientistsjournal.com/2010/03/sgw.html#more. IPCC Figure 2.3(a) shows that the rise in (calibrated) CO2 has the reciprocal slope to measured reductions in atmospheric O2, confirming that the combustion of fossil fuels stoichiometrically accounts correctly for both the rise in CO2 and the depletion of O2 in the atmosphere.
Figure 2.3(b) show that the rise in lightweight CO2 from the combustion of fossil fuels mixed into the heavier natural CO2 in the atmosphere accounts for the decrease in the isotopic ratio of C13/C12.
These charts exemplify the worst in scientific misconduct on at least four counts. (1) The pairs of records should be compared on the basis of correlation, and correlation first requires detrending. Calculating correlation without removing the trend lines will produce a non-zero correlation number for any two uncorrelated series where each happens to exhibit a trend. (2) The eye is easily fooled into misinterpreting correlation. Correlation must be determined numerically, which IPCC does not do. This is severely aggravated where the graph include trends. (3) Correlation is necessary but not sufficient in causal analysis. What needs to be calculated is not the instantaneous, zero-lag correlation coefficient, but the continuous correlation function for all lags. In Figure 2.3(b), for the production of CO2 to have cause the decrease in isotopic ratio, the CO2 curve must lead the isotopic ratio.
And fourth, and perhaps of gravest concern, the chart contains false parallels in both part (a) and part (b). Parallelism, made significant by including trends, is falsely portrayed by graphing the two components on separate ordinates adjusted in relative offset and scale factor to make the graph lines run parallel. This is called chart junk, and it is unethical.
IPCC’s attribution of the combustion of fossil fuels to the rise in CO2 by the appearance of the human fingerprint on the record is a failure.
The Keeling Curve, the true, master, global CO2 record, is in deep trouble. It doesn’t match the O2 record, so attribution to fossil fuel combustion is invalid. More importantly, it doesn’t parallel the warming over the same period. The IPCC conclusion that
Human influence on the climate system is clear. This is evident from the increasing greenhouse gas concentrations in the atmosphere, positive radiative forcing, observed warming, and understanding of the climate system. AR5 SPM ¶D, p.15.
is incorrect. The data are far from evident, and the conclusion is invalid.
And then there’s this:
http://images.huffingtonpost.com/2013-03-31-ScreenShot20130331at4.19.41PM.png
Where is the correlation between human emissions and global T?
you can’t just throw graphs at the reader without an explanation. What does airborne fraction mean, for example in relation to Keeling’s upward curve of CO2 in the atmosphere? What is the source of the graph? etc.
polar ‘scientist’ says:
you can’t just throw graphs at the reader without an explanation.
The graphs are the explanation. And you don’t post any empirical evidence yourself, do you? Just your cherry-picked pal-reviewed papers that support your alarmist narrative.
Next: if you don’t know how to determine the provenance of posted links, you’re not much of a scientist.
Finally: Complaining that you need an “explanation” indicates that you’re not up to speed. I can’t speak for the originators of any particular chart, but I think I understand what the “airborne fraction” of a particular atmospheric gas is.
I recommend that you take a few weeks at least, and read the numerous articles and comments here. Any related keyword will get your search started, such as: CO2, or Arctic, or polar, or ice, etc. Come back when you know more.
I know what the airborne fraction is, but that doesn’t mean that you should not indicate your sources. The fact is that the airborne fraction (for the uninitiated – the ratio of the annual increase in atmospheric CO2 to the CO2 emissions from anthropogenic sources – i.e. the proportion of our emitted CO2 that remains in the atmosphere) has remained more or less constant at close to 45% for decades. The ratio tells us that about half of what we emit is absorbed by the ocean and/or land plants. Your graph confirms that trend. It also shows from the isotopic composition of the airborne fraction that the stuff in the air increasingly comes from burning fossil fuel. Thanks for that.
You ask me to cite my sources but they are in fact clearly set out in “Earth’s Climate Evolution”. I recommend you read it and the papers on which it is based.
I am afraid you have mixed apples with oranges in your attempt to explain upwelling. The paper by Marshall and Speer 2012 confirms that deep water wells up along density surfaces to the surface of the Southern Ocean (something every oceanographer knows). The article is really pointing out that elsewhere in the ocean, for example the northeast Pacific, where people formerly thought deep water finally made it to the surface, there is no vertical mixing deep enough to bring deep water to the surface. The upwelling that occurs around the margins of the ocean basins (Benguela, Canary, California and Humboldt Currents) is different. It is wind driven and responds to the Ekman Spiral that brings Intermediate (not deep) Water up from depths of 100-150m. Those same depths are tapped by the equatorial upwelling across the Pacific. Those upwellings are completely different in nature, origin, and depth of water tapped from the upwelling around Antarctica, which taps water from depths of 2-3000 m. That brings really old CO2 to the surface. The other upwelling centres actually tap into Intermediate Water, much of which sank at the Polar Front in the Southern Ocean. It contains a mix of some of the original old upwelled CO2 plus younger CO2 absorbed from Antarctic air.
As to the second point regarding CO2 measurements, as far as I am aware the Keeling curve faithfully reflects actual measurements made at Mauna Loa, and has done since those measurements began in 1957.
As to the other point regarding the time that CO2 stays in the atmosphere, when you add CO2 to the atmosphere it has to equilibrate with the CO2 composition of the ocean, by exchange across the air-sea interface. While that reduces the concentration of CO2 in the air, it increases its concentration in the surface ocean. That higher ocean concentration keeps the atmospheric concentration of CO2 above what it was before you added CO2 to it. Assuming that we keep putting CO2 into the air, the exchange with the ocean will keep the concentration in the air high. If we stopped putting CO2 into the air, the long slow process of ocean mixing would eventually weaken the concentration at the surface, which would gradually cause the concentration in the air to fall. But that process is on a time scale of hundreds of years. It is a common misperception from 14C studies that added CO2 will disappear from the air within 4-5 years. The reason that appears so is because when 14C CO2 air molecules move into the ocean they are instantly massively diluted because the ocean is 14C poor. So it is a lousy tracer for CO2 exchange behaviour.
As I wrote upthread:
The most accurate global temperature data comes from satellites:
http://realclimatescience.com/wp-content/uploads/2015/06/ScreenHunter_9549-Jun.-17-21.12.gif
And rather than global T being even partly attributable to CO2, the empirical evidence shows that there is no correlation at all. Furthermore, you have the causation backward. It is:
∆T causes ∆CO2. There is a mountain of empirical evidence showing that causation. But there is no such evidence showing that rising CO2 is the cause of global warming.
The only relevant fact is that global warming stopped many years ago. Cherry-picking limited areas in the hope of making a case for ‘dangerous AGW’ is the best argument the alarmist cult has. But the scare is over global warming, so that argument fails.
The only ‘Authority’ that matters — Planet Earth — is debunking your ‘dangerous AGW’ nonsense. Everything currently being observed has been exceeded in the past, and to a much greater degree. There is nothing either unusual or unprecedented happening.
All the wild-eyed Chicken Little-style clucking and arm-waving about ‘global warming’ is over this minuscule change in global T:
That *tiny* fluctuation — over more than a century — is a smaller change than at any comparable time period in the geologic record. The alarmist cult has picked the easiest argument imaginable for skeptics to debunk. The unusually small fluctuation of only ≈0.7ºC over a century is as flat as anything you can find. Yet it is the putative example of ‘runaway global warming and climate catastrophe’ that is being peddled to the public by an ethics-challenged clique of rent-seeking scientists.
Finally, there is no empirical, measurable evidence showing that the rise in CO2 is causing any global warming. In fact, global warming stopped many years ago! That fact debunks the “carbon” narrative, and your attempts to keep it alive amount to beating a dead horse.
Geologists who study climate take a different view from you, as is evident from Figure 1 in the Geological Society of London’s climate change statement at http://www.geolsoc.org.uk/climaterecord, published in 2010 with an update in 2013. This shows that northern hemisphere insolation fell from 10,000 years ago to the present and will stay low for the next 5,000 years. That drove Earth into the ‘neoglacial’ of the past 4000 years, which culminated in the Little ice Age. All things considered, with that orbital driver we should still be in the Little Ice Age. It should not have come to a ‘natural’ end. The figure in the statement shows the accompanying pattern of CO2 over the same period, with its sudden uptick after the beginning of the industrial revolution at around 1769, when Watt’s steam engines rapidly expanded. The only thing we can relate the present temperature rise to is that sudden uptick. It is not explained by solar activity, which is in decline. And it does not relate to volcanic activity. Nor is it connected to the ocean’s behaviour.
In the case of your graph showing the divergence of CO2 and temperature, you can of course adjust the CO2 curve to show a much more gradual rise, which would parallel the temperature rise from 1996 to 2010, ignoring the positive anomaly due to the major 1997-1998 El Nino and the negative anomaly due to the major 2008 La Nina. Behind all that is of course the current negative phase of the Pacific Decadal Oscillation, which has helped to keep the global average down since the year 2000, even while the Arctic continued warming and sea ice there continued to melt. It is no accident that there are now plants emerging from beneath the Baffin Island Ice Cap that last saw daylight 1600 years ago (Miller et al 2012 Geophys. Res. Letts. doi:10.1029/2011GL050168.; and 2010 Quat. Sci. Revs. doi:10.1016/j.quascirev.2010.02.008, 1-12.). My point is that you cannot focus just on curves of CO2 and temperature, as you do, because several other things also control temperature (e.g. El Nino, La Nino, the PDO, volcanoes). The search for 1:1 is a chimera. You have to extract those effects to see the underlying change in temperature. One such underlying change is caused by our outputs of aerosols. It was high between 1950 and 1970 before Clean Air Acts cleaned them out of the atmosphere. But the growing use of coal by China and India is likely to be reloading them into the atmosphere – witness the so-called Asian Brown Haze. That is something else that can temporarily appear to derail the underlying link between temperature and greenhouse gases. See “Earth’s Climate Evolution”, where the action of different variables on temperature is made clear.
That warming is continuing is evident from the oceanic data of Trenberth and Fasullo, 2013, which shows not only that the upper 700m of the ocean has continued to warm since 2000, but also that increasingly the water deeper than that has warmed significantly. Warming is not only continuing, but penetrating deeper into the ocean, which helps to explain why sea level continues to rise. The ongoing melting of Greenland and Antarctic land ice continues to add to ocean expansion caused by warming the ocean.
Finally, I do wish you would refrain from throwing around insults in your responses. Debate should be a civilised process.
polarsci says:


Geologists who study climate take a different view from you…
Wrong from the get-go. Geologists as a group are the most skeptical of all those with degrees in the hard sciences.
I read your link, and the .pdf’s attached. All I saw was propaganda issued by a small handful of rent-seekers who call themselves a “working group and Council”. They did not poll their thousands of members, and even if they were to do so we know from experience that the language would be so slanted and self-serving that the results would be akin to neo-Nazi John Cook’s “97%” propaganda.
Next, your small, self-appointed “working group and Council” states that the climate sensitivity number should now be doubled!
But doubled from what? From the IPCC’s 3ºC – >6ºC? Real world observations show that climate sensitivity is indistinguishable from zero: despite the steady rise in CO2, global warming stopped many years ago, and it shows no indication of resuming its rise.
So please take your ‘Appeal to Authority’ logical fallacies elsewhere. Planet Earth is busy debunking your “working group and Council” clique. As Chico Marx said: “Who you gonna believe, me or your eyes?”
Next, you say:
In the case of your graph showing the divergence of CO2 and temperature, you can of course adjust the CO2 curve to show a much more gradual rise…
BZZ-Z-Z-Z-Z-ZT!! WRONG!
It’s not ‘my’ graph; it is a WoodForTrees graph constructed from a widely accepted temperature database. You folks just love to “adjust” the numbers. But then it’s no longer ‘data’; it’s whatever you’re fabricating. And it’s clear that you still don’t understand how the start year of the so-called ‘pause’ is determined.
Next, you falsely assert:
That warming is continuing is evident from the oceanic data of Trenberth and Fasullo, 2013, which shows not only that the upper 700m of the ocean has continued to warm since 2000, but also that increasingly the water deeper than that has warmed significantly. Warming is not only continuing, but penetrating deeper into the ocean, which helps to explain why sea level continues to rise.
All you ever post are your assertions and your cherry-picked pal reviewed papers. I post empirical evidence, facts, and measurements.
Warming is not continuing in the oceans:
http://oi55.tinypic.com/2i7qn9y.jpg
Even some of your alarmist pals now admit that the deep ocean has stopped warming:
http://s27.postimg.org/idj4ait4z/Deep_OHC.png
The ARGO buoy network shows that most ocean levels are cooling, not warming:
http://tumetuestumefaisdubien1.sweb.cz/ARGO-sea-temperature-max-max.PNG
Here is more ARGO data, showing no deep ocean warming:
And sea level rise has not accelerated:
In fact, when isostatic adjustments are taken into account, sea levels are decelerating:
And since you’re so enamoured of published papers, this one shows that almost half the sea level rise is due to groundwater loss:
http://www.nature.com/ngeo/journal/v5/n6/full/ngeo1476.html
Next, this bar graph is from the journal Nature. It shows the raw data, which indicates that sea level rise is decelerating:
http://www.nature.com/nclimate/journal/v4/n5/carousel/nclimate2159-f1.jpg
So all in all, the objective, empirical evidence refutes the ‘man-made global warming’ hoax. Any questions should be referred to Chico Marx.