by Dr. Richard Keen, via spaceweather.com (h/t to Leif Svalgaard)
On Sept. 27th, millions of people around the world watched the Moon pass through the shadow of our planet. Most agreed that the lunar eclipse was darker than usual. Little did they know, they were witnessing a sign of global cooling. But only a little.(continued below)

Atmospheric scientist Richard Keen of the University of Colorado explains: “Lunar eclipses tell us a lot about the transparency of Earth’s atmosphere. When the stratosphere is clogged with volcanic ash and other aerosols, lunar eclipses tend to be dark red. On the other hand, when the stratosphere is relatively clear, lunar eclipses are bright orange.”
This is important because the stratosphere affects climate; a clear stratosphere ‘lets the sunshine in’ to warm the Earth below. At a 2008 SORCE conference Keen reported that “The lunar eclipse record indicates a clear stratosphere over the past decade, and that this has contributed about 0.2 degrees to recent warming.”
The eclipse of Sept. 27, 2015, however, was not as bright as recent eclipses. Trained observers in 7 countries estimated that the eclipse was about 0.4 magnitude dimmer than expected, a brightness reduction of about 33 percent.

What happened? “There is a layer of volcanic aerosols in the lower stratosphere,” says Steve Albers of NOAA. “It comes from Chile’s Calbuco volcano, which erupted in April 2015. Six months later, we are still seeing the effects of this material on sunsets in both hemispheres–and it appears to have affected the eclipse as well.”
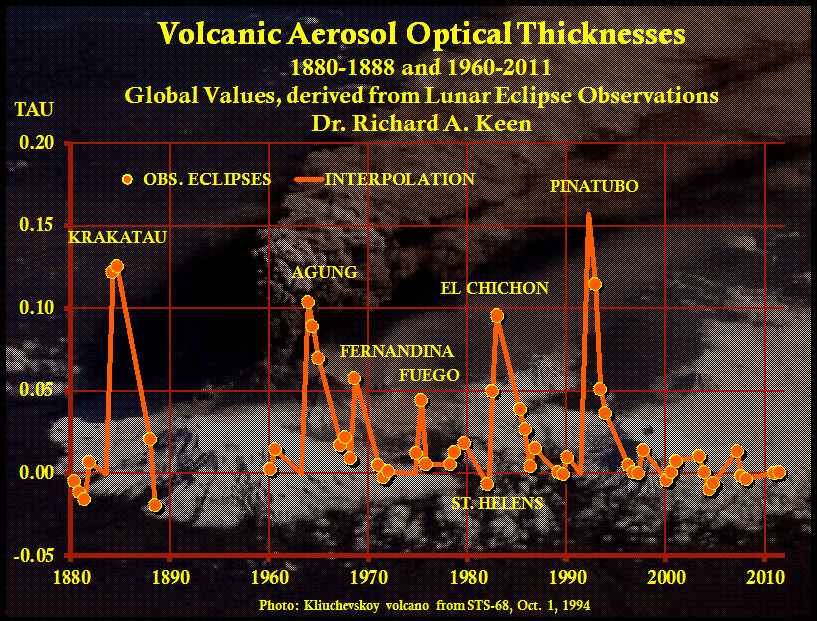
Volcanic dust in the stratosphere tends to reflect sunlight, thus cooling the Earth below. “In terms of climate, Calbuco’s optical thickness of 0.01 corresponds to a ‘climate forcing’ of 0.2 Watts/m2, or a global cooling of 0.04 degrees C,” says Keen, who emphasizes that this is a very small amount of cooling. For comparison, the eruption of Pinatubo in 1991 produced 0.6 C of cooling and rare July snows at Keen’s mountain home in Colorado.
“I do not anticipate a ‘year without a summer’ from this one!” he says. “It will probably be completely overwhelmed by the warming effects of El Nino now underway in the Pacific.”
This lunar eclipse has allowed Keen measure the smallest amount of volcanic exhaust, and the smallest amount of resultant “global cooling” of all his measurements to date. And that is saying something considering that he has been monitoring lunar eclipses for decades.
“This is indeed the smallest volcanic eruption I’ve ever detected,” says Keen. “It gives me a better idea of the detection capabilities of the system (eclipses plus human observers), so when I go back into the 1800s I can hope to find similarly smallish eruptions in the historical record.”
http://icecap.us/images/uploads/HOW_VOLCANISM_AFFECTS_CLIMATE.pdf
I believe all values are for the stratosphere from all the charts I have sent.
Dr Keen
Is “deep red” just a less luminous “bright organge” or is there less shorter wavelength light ?
Is nobody doing spectrographs of this ?
http://www.ing.iac.es/PR/press/eclipse.html
http://www.astro.up.pt/investigacao/conferencias/toe2014/files/posters/fyan.pdf
Leif, since you are here. Slightly OT, but not very much.
We were discussing Interglacials a couple of weeks ago, and why recent Interglacials only happened every four or five precessional cycles. And surface temperatures sometimes missed an entire NH Milankovitch warming event – like the warming 170,000 years ago in the following image, which was ignored completely.
Well I now have a possible explantion. If Interglacials are primarily albedo driven, rather than CO2 driven, this would explain everything. Interglacials only happen with NH Milankovitch insolation increase, so we know that the SH is irrelevant. But the extra Milankovitch insolation in the NH cannot get a purchase, and produce a temperature effect, if the ice sheets are pristine and white. Too much albedo, and all that. It does not matter how much the insolation increases, if albedo is running at 70% or 80%, nothing will happen.
What the increased Milankovitch insolation needs, to produce a result, is dirty ice. And it just so happens that EVERY Interglacial warming period is preceeded by 10,000 years of dust storms (which have a VERY interesting cause). So the Ice Age is just sitting there, patiently waiting for dirty ice. And as soon as the dust era happens, the world is primed and ready for an Interglacial. And as soon as the next NH Milankovitch insolation increase comes along, the climate hitches a ride on the reduced ice-albedo and the surface temperature warms into a full-blown Interglacial period. And then the albedo feedback can really come into its own, because it has 10,000 years of dust that will be comming to the surface of the ice sheets and reducing the albedo even further.
And this theory is interesting, because it totally negates the role of CO2. Dust storms cannot effect CO2 concentrations and feedbacks, but it sure can effect albedo feedbacks. So if dust storms are the initial condition required for Interglacial warming, and Milankovitch insolation is the trigger – then CO2 HAS NO ROLE IN REGULATING ICE AGES.
The whole Ice Age cycle is triggered by Milankovitch cycles, enhanced by albedo feedbacks, and regulated at either end of the cycle by Eschenbach’s cloud thermostat. So CO2 is a bit-player in this grand climate drama, while the main stars are Milankovitch and albedo.
Milankoitch warming in the NH, at high latitudes. Note that the increased insolation 170,000 years ago did absolutely nothing to global temperature.
A very interesting assertion. Comments on the Younger Dryas? If your assertion is correct, then the period of extended, worldwide drought and the dust storms that apparently covered e.g. North America and Africa would have played a role in the exit from the YD. Furthermore, since the dust storms would necessarily have swept over the NA ice sheet AND Greenland, there should be be an absolutely pristine signal of your hypothesis in the Greenland ice cores, both in the original exit from the Wisconsin and the YD bobble that interrupted it.
I’m not sure that the data support this, but here is a paper to get you at least started that references the dust measurements from Greenland cores:
http://onlinelibrary.wiley.com/doi/10.1029/96PA02711/pdf
Of course, it presents an alternative model in the form of deepwater circulation changes, but still, this is the general direction you’ll need to go if you are looking for direct data.
rgb
Dirty ice in the high northern latitudes does not require dust storms. Milankovic cycles exert stresses on the tectonic plates, enhancing the velocity of the movement and more frequent eruptions in both the Icelandic and the Aleutian volcanic chains depositing megatons of ash on the Arctic’s ice. Records of the enhanced magma flows are clearly shown in the Arctic’s ocean floor gravity anomalies.
http://www.vukcevic.talktalk.net/IG.jpg
If I am correct than bright red areas are interglacials, while the green-ish areas represent the much longer ice ages, but also much slower plates movement with a minimal tectonic activity.
Thanks, rgb, but you have chosen the one topic that is difficult to explain. 🙁
The world should have dived back into a new Ice Age during the YD cooling period and stayed there. The NH Milankovitch insolation was diving back down again, and all the other Interglacial periods followed the Milankovitch insolation line back down into an Ice Age. But this Interglacial stopped and reversed for some reason. So the thing you need to explain is NOT the YD, but the very peculiar recovery from the YD. What was different this time around?
.
However, one thing this theory does predict and explain, is that our present world temperature is the maximum we are likely to get.
Interglacial warming is triggered by Milankovitch insolation, enhanced by albedo feedbacks, and maintained at this higher temperature by the cloud thermostat. So the primary feedback-warming is albedo. But albedo feedback-warming runs out of steam when there is no more ice left to melt, and so we have probably reached the maximum temperature likely under present solar output conditions.
Take a look at the triple-graph in my post below, of ‘temperature, CO2 and dust’. Each and every Interglacial period reaches about the same maximum temperature, even if the Milankovitch influences were different. Why? Because just about all the polar ice has melted at this point, and the albedo feedback-warming has run out of steam. And when the NH Milankovitch warming fades, the temperature comes straight back down again – no matter how high the CO2 concentration is.
So the real anomaly in the current Interglacial is not the Younger Dryas, but the peculiar recovery and continuation of the Interglacial period.
Ralph
>>Dirty ice in northern latitudes does not require dust storms.
>>Milankovic cycles exert stresses on the tectonic plates.
Thanks, Vuk. But there ARE dust storms in the ice record, and it has been established that this is land dust rather than volcanic dust. And so you need a mechanism whereby large regions become barren during an Ice Age. And the simplest scenario is low CO2 causing widespread vegetation die-back, and thereby exposing barren lands.
R
Hi
I don’t dispute existence of the dust storms and the possible effect on the polar ‘de-icing’, it is a novel approach to the explaining interglacials.
One problem with it is that the last cycle of ice ages started about 2.6 M yr ago, and the ‘Ellis hypothesis’ needs to provide reason for the initial trigger (e.g. mayor meteorite hit plunging Earth in a millennia long winter) since in the previous x M yr the Earth was ice age free. I also noticed that the dust storms were progressively getting stronger and longer lasting; the back extrapolation might suggest a problem.
My hypothesis has even more problems, the main one is that I could not establish time line of the sea floor gravity anomalies, the essential pre-requisite for a possible link to the ice ages, but on the plus side, about 20-25 can be identified at sea floor further south in the Atlantic .
The oldest Iceland’s rocks are about 16 M yr old, Iceland reached present configuration about 3 M yr ago, while the endless eruptions were building it up in the last 13 million years of Tertier. The albedo factor (due to volcanic ash ?) I have not considered before, so credit goes to Ellis hypothesis.
For initial trigger to the onset of the ice ages sequence, I would favour the ocean currents factor, whereby the appearance of Iceland, located at the critical Atlantic-Arctic gateway, interferes with the previously unobstructed inflow of warm waters preventing the Arctic ocean’s freezing.
Vuk.
One problem with it is that the last cycle of ice ages started about 2.6 M yr ago, and the ‘Ellis hypothesis’ needs to provide reason for the initial trigger.
______________________________________
A good point, Vuk.
If the climate record IS accurate back that far, it would appear that past eras up to 5 million years ago were warmer than now. So when the 25,700 Milankovitch cycle fluctuated up and down in these past eras, and the NH insolation-forcing fluctuated with it, there was reduced chance of polar ice formation. And if there was little or no ice formation, then there were little or no ice-albedo feedbacks to exaggerate the cooling and promote further ice formation. And so there was no Ice Age at all. But as we progressed on in time the climate was progressively cooler, and so there was more and more chance of polar ice forming, and therefore more and more chance of a little Ice Age type event. Until we get to the full-blown Ice Ages of the more recent era.
This explanation again rules out the role of CO2 in world temperature, because CO2 was always in the atmosphere. In fact, there was much more of it 5 million years ago than now. So if CO2 is the primary driver of global temperature, then why did we not get wild temperature fluctuations 5 million years ago? The circumstances then would have been exactly the same as now, just with a bit more CO2, and so the temperature should have fluctuated just as strongly 5 million years ago as now.
But it did not. Why?
Because CO2 does not regulate Ice Age temperatures, ice-albedo does. But albedo feedbacks can only get a purchase on world temperature if polar ice begins to form, and in a warmer climate it did not – or not enough to have a significant feedback effect. And so we did not have wild swings in temperature. But as the world cooled, more and more polar ice formed in each cycle, and the ice-albedo feedback had more and more of a purchase on global temperature, until we reached the wild temperature swings of the recent era – temperature swings that could have resulted in a snowball Earth were it not for the plant-life die-back and resulting dust storms.
Of course you would still have to explain why the world was warmer 5 million years ago. But invoking the small effects of CO2 for historic temperatures is naive. About 5 million years ago the CO2 concentration was around 550 ppm, and on the greenhouse feedback forcing graph that represents a gnat’s-cock increase in forcing (in wm2) and a gnat’s-cock increase in temperature. So it was not CO2 that made the globe 5ºc warmer 5 million years ago. There must be another reason for the world being warmer 5 million years ago, that remains unexplained as far as I can see.
But the short answer to your question is that CO2 feedbacks cannot explain the oddities of historic Ice Age record, while ice-albedo feedbacks most certainly can.
.
A proxy-record of historic temperatures going back 5.5 million years.
RF
interesting graph, I looked at the magnified size (from wikipedia), and it shows that around 3 M yr ago, just as Iceland reached roughly its present size, temperature oscillations increased periodicity length and amplitude. However sea floor volcanic activity continued altering the ridges, and as time progressed osculations continued to further increase in the periodicity and amplitude. This would suggest to me that whatever is cause it is still evolving, and this could be only sea floor configuration. Your dust graph confirms this notion, since the deeper and longer more recent oscillations cause longer and larger dust deposits. As I originally suspected, back extrapolation of the dust deposits would show minimal accumulation, possibly insufficient to alter the ice albedo to the required degree.
I am inclined to conclude that the dust deposits are indeed consequence of the Ice ages, but are unlikely to be the cause of the interglacials’ reappearance .
I think you forgot to tell us about : “(which have a VERY interesting cause).”
>>I think you forgot to tell us about ‘the VERY interesting cause’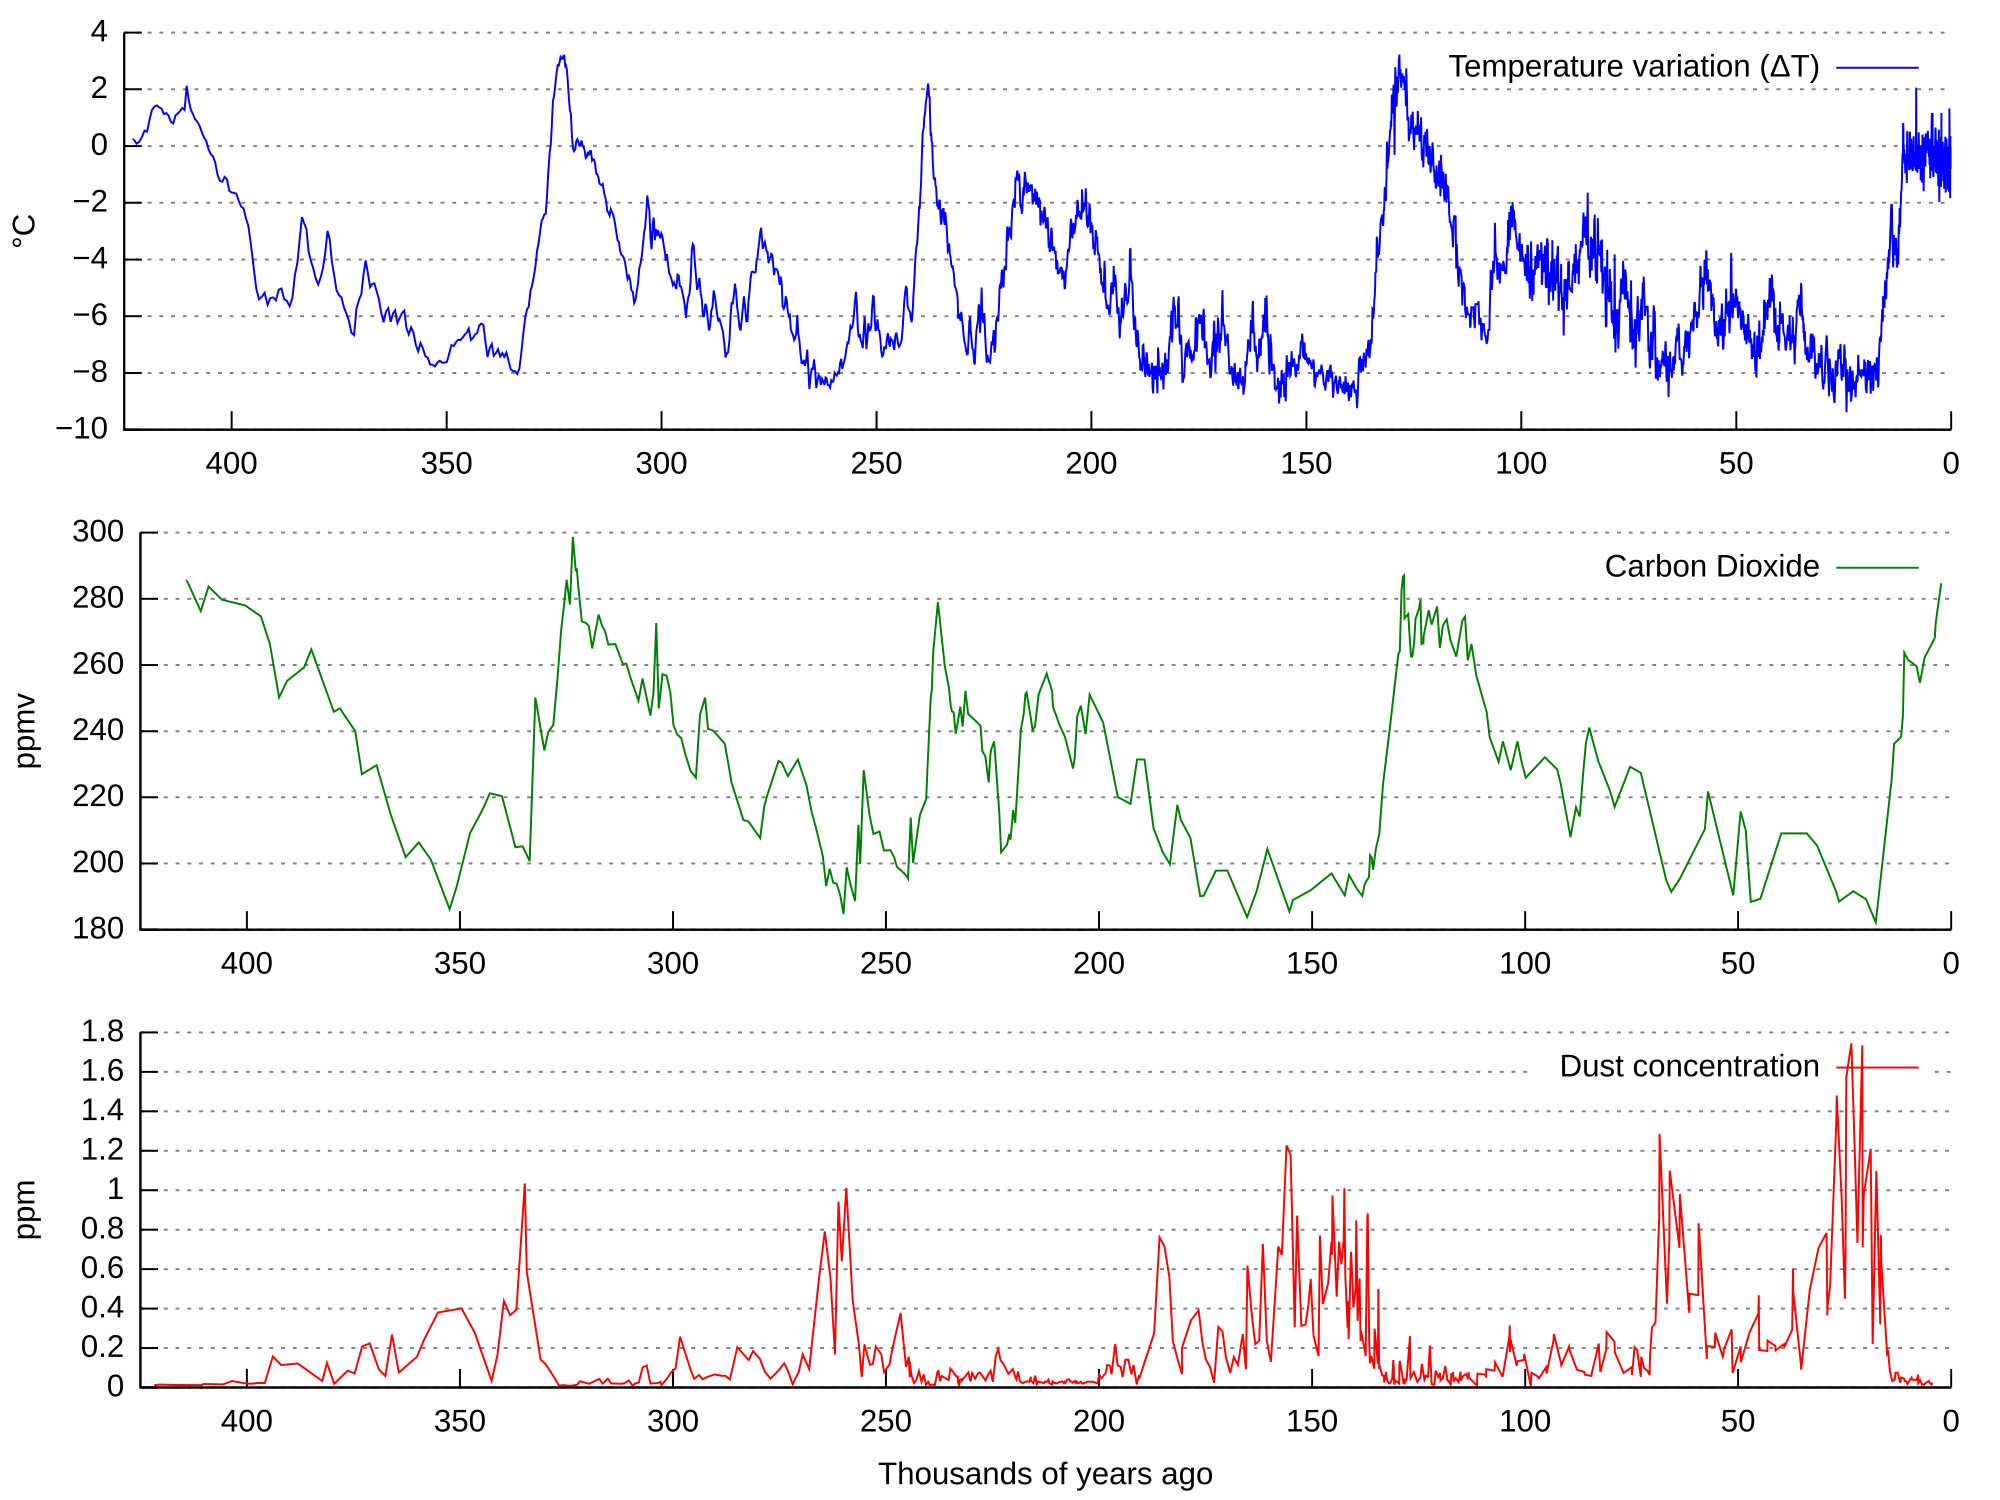
Yes, sorry, the coffee-shop was closing. (This is Silver Ralph.)
My suggestion is simple, logical, and very interesting, because the alarmist lobby will do everything in their power to oppose this idea. Take a look at the graph below. As you can see, each and every Ice Age is preceded by a sudden dust storm (red line) of at least 10,000 years duration. But what caused these sudden dust storms, that must have enveloped the Earth to deposit dust on the poles? (Note: these storms came before the Ice Ages, not after, as some ‘scientists’ try to claim.)
The answer probably lies in the CO2 graph (green line), which shows that CO2 levels came all the way down to 180 ppm. But 180 ppm is dangerously low for plant life, and this has been confirmed by none other than Patrick Moor, the co-founder of Greenpeace who said:
Quote, Patrick Moore:
‘CO2 is lower today than it has been through most of the history of life on earth … At 150 ppm CO2 all plants would die, resulting in the virtual end of life on earth’
So the most likely reason for these dust eras, is that when CO2 reached its minimum value there was a massive die-back of plant life. This die-back would have caused large areas of barren ground to be exposed, and the high winds caused by the ice sheet terminus temperature difference can then blow dust from those newly barren lands into the atmosphere, with much of it settling on the Arctic and Antarctic ice sheets (the ice core in this diagram is from Antarctica). And it is this dust that reduced the ice-sheet albedo, and allowed the increased Milankovitch insolation to melt the ice sheets.
.
Thus the critical elements necessary for the end of an Ice Age are:
a. CO2 reducing below 200 ppm.
b. Wholesale plant-life die-back.
c. Large areas of exposed barren ground.
d. High winds that form at the ice sheet terminus.
e. Thick dust deposited on the ice sheets, for successive centuries.
f. Greatly reduced albedo on the ice sheets.
g. A warming Milankovitch cycle in the northern hemisphere.
And this results in:
a. Warming temperatures.
b. A positive feedback were melting ice concentrates dust on the ice, giving even more warming.
b. A positive feedback were melting ice sheets result in less albedo and even more warming.
c. Increasing ocean temperatures, resulting in CO2 outgassing from the oceans.
d. Increasing atmospheric CO2 concentrations.
e. Plant life recovering, and reducing albedo even more.
Only with all of these many conditions in place, will there be a virtuous feedback cycle which can rapidly end an Ice Age. And the primary feedback that encourages this warming trend is albedo. Albedo can provide tens of extra wm2 to the all-important northern ice-sheets, while the puny CO2 molecule can do little or nothing to assist.
Perhaps you can see why this simple and logical explanation will be resisted, at all costs. It portrays CO2 as the most vital gas in the atmosphere, the savior of all plant and animal life during the darkest times of the Ice Age, and it also implies that CO2 as a feedback takes no part in these warming cycles whatsoever. CO2 is a bit-player in this grand climate drama, while the main stars are Milankovitch and albedo.
Ralph
Very interesting indeed. So CO2 ( lack of it ) does cause global warming after all. How ironic.
I’ve always read that one of the problems with Malankovich hypothesis is that is was way too small. A significant change in polar albedo could go a long way to fixing that. Albedo going from 97% to 70% is an order of magnitude in absorbed energy.
It also seems to potentially address the 170ka problem of missing response.
Do you have a data source for that dust data?
>>I’ve always read that one of the problems with Malankovich
>>hypothesis is that is was way too small.
Yes, but only because they have fiddled the data, and smeared the Milankovitch forcing out across the whole globe. But this is not correct.
As can be seen in the Milankovitch graph above, the Interglacials ONLY follow northern hemisphere Milankovitch forcing at high latitudes (because of NH landmasses). The southern hemisphere forcing is the opposite of this graph and therefore displaced by 12,840 years from the NH forcing (half a precessional cycle). But Interglacials NEVER follow SH forcing, only NH forcing. But if the SH is irrelevant, then why smear Milankovitch forcing out across the entire globe? Restricting this forcing to the NH doubles the presumed Milankovitch forcing, at the very least.
But that is not the only problem. The melting of dirty ice sheets is not really a function of ambient temperature, it is a function of direct insolation on dirty ice – as I found out when I went to the Baltoro glacier Himalayas. There is no ice on the surface of the Baltoro glacier – just a great layer rocks and dirt, and it is the summer insolation on this low-albedo rocky mass that melts the ice below. And Ice Age ice-sheets covered in dust will respond in much the same manner.
The direct Milankovitch forcing at 65ºN on the graph above is anything up to 90 wm2, over the whole Ice Age cycle, and so the NH ice sheets are getting anything up to another 90 wm2 of direct insolation. And if the albedo of the ice reduces by 30% because of dust, you can add another 100 wm2 to that figure. So the total additional insolation-absorption forcing-feedback at 65ºN is anything up to 190 wm2 (over the entire Interglacial warming period). So why do climate ‘scientists’ make out that Milankovitch forcing and albedo feedbacks are insignificant?
Ralph
ralfellis October 6, 2015 at 12:55 pm
I’ve a distinct memory of discussing exactly that scenario with a geology lecturer in about 1989. The guy was all keen on the correspondence of marine-sed cores, isotopes trans/regress sequences and Milankovic, and I suggested a dust and ash albedo option for amelioration and the Holocene type warming, and the lecturer seemed to think that was quite likely and a reasonable explanation for the flip to warming.
So this was not an unusual view in geoscience 25 years ago, and even prior. And then during the 1990s no one was coming out and saying, “Hang on, we can already posit that albedo and solar input is modulating this climate system, we have plenty of consistent data showing this.”
And I thought everyone else already knew this stuff, so was astonished that so many seemed totally oblivious to it.
And first off no one was discussing it with the public, and secondly when geos finally got fed up and started writing books about it all that was extremely poorly received and vilified for daring to use Earth’s data in preference to models!
Hence my bottomless well of skepticism about AGW and consensus pop-science amalgamated into volumes of rot under the UN IPCC banner.
The lecturer’s name was Bob Carter.
So it’s with some ambivalence and annoyance to read the same Occam’s-Razor-simple scenario being put forwards again, as a no-brainer insight, 25 years later.
So instead of people like Bob getting on with 25 years more work uncovering what else Earth was up to, they had to stop most of that and respond with books and public lectures to debunk the media circus produced by the UN IPCC and irresponsible smearing amateur-hour morons like Tony Jones, at ABC Lateline.
What a thorough disgrace.
>>Unmentionable
>>What a thorough disgrace
Sad, eh?
I dreamed this up from first principles, thinking it is sooo obvious. Now it looks like it probably is sooo obvious. But nobody is allowed to talk about it. So all we get is an old man in a red dress crying ‘heretic’, ‘burn him’.
Very sad.
R
where is the graph from?
>>where is the graph from?
You mean the dust graph?? It is Petit et al, 1999. Figure 2, but this is one of those ‘orrible back-to-front graphs. Why do they persist in such a stupid presentation?
http://www.daycreek.com/dc/images/1999.pdf
R
no the milankovitch forcing graph. – nevermind i finally noticed the watermark and checked the source. i’m not quite understanding why it was done that way and it seems to be misleading. the source had another averaged globally and for the full year which seemed more accurate in results. However, it reinforces my hangups with the cycles as being seriously important factors. It’s all about the albedo …
>>the source had another averaged globally and for
>>the full year which seemed more accurate in results
On the contrary. What you mean is that the source also had a graph for the whole Earth and year which was totally misleading.
Milankovitch forcing and warming is all about summer melt in the high northern latitudes. So why spread the forcing out over the whole year and the whole globe? It is a deceit. Its like saying that my car has incredibly low emissions, by spreading its emissions out over the whole year, when the car is mostly sitting in the garage.
We know that the southern hemisphere is totally irrelevant for initiating Interglacials, because the Ice Ages NEVER responds to southern hemisphere Milankovitch forcing. But the Ice Age does respond positively and very accurately to the very large Milankovitch forcing in northern high latitudes. At these latitudes we get up to 90 wm2 extra forcing, and that is a very significant increase in insolation (but only if the ice is covered in dust).
Ralph
Sorry, but the header does not portray what is said in the post itself.
Has WUWT adopted the MSM way of reporting?
“Volcanic dust in the stratosphere tends to reflect sunlight, thus cooling the Earth below. “In terms of climate, Calbuco’s optical thickness of 0.01 corresponds to a ‘climate forcing’ of 0.2 Watts/m2, or a global cooling of 0.04 degrees C,” says Keen, who emphasizes that this is a very small amount of cooling. For comparison, the eruption of Pinatubo in 1991 produced 0.6 C of cooling and rare July snows at Keen’s mountain home in Colorado.”
Thus, according to Keen, “the recent lunar eclipse revealed a sign of global cooling in the atmosphere”.
Have you adopted a reading comprehension problem, or do you just get your Cliff notes from our Village Idiot?
To convey the true story properly I would have headed it “Temporary global cooling due to volcanic ash”.
The header (especially in the context of the climate debate) hints to a reversed trend of cooling. It is not a trend, it is only a short dip due to volcanic activity.
We are 3 years into an Epic Solar Minima which heralds a mini-ice age. The sun failed to reach maximum during its last cycle. The earth is a capacitor that charges and discharges in direct response to the normal 11 year solar cycle which progresses from maximum to minimum. This planetary discharge manifests in the form of seismic and volcanic activity. Since the sun has entered into an Epic Solar Minima seismic and volcanic activity will increase in both frequency and magnitude. If one or more of the world’s super volcanoes erupts, the vast amounts of particulates that will be dispersed into the atmosphere will block the already diminished solar radiation reaching the earth’s surface. This would serve to plunge global temperatures and initiate a mini-ice age. It has happened numerous times in the past as it did during the Maunder Minimum when the River Thames froze over. Last winter the Danube River froze solid with little mainstream media coverage. Seismic and volcanic activity are increasing exponentially. All the elements are in place for another mini-ice age with all of the attendant catastrophic consequences. Crop failures, mass migrations from northern latitudes and chaos are all in the cards. Additionally, due to a collapsing heliosphere resulting from the onset of an Epic Solar Minima, we can expect an increase in comets and other Near Earth Objects menacing the planet. We have been left in the dark by the establishment purposely to insure maximum population reduction.
Truly? The heliosphere is going to “collapse”? What, exactly, does that mean, and what the devil does that have to do with cometary orbits?
Inquiring minds like to know…
ROTFL,
rgb
The Solar Winds will decrease, allowing more rocks to get closer to us !!! Was that simple enough ??? I can’t do kindergarten very well !! LOL …
rgb, I think this is a more credible analysis of volcanic forcing. See any problems?
https://climategrog.wordpress.com/2015/01/17/on-determination-of-tropical-feedbacks/
Perhaps ‘contraction’ of the heliosphere would have been more appropriate. It certainly will not completely collapse. Everything mentioned in the post can be verified through research. The last two winters, the increase in seismic and volcanic activity and the failure of the sun to reach maximum at the end of its last cycle are undebatable. “Condemnation without investigation is the height of ignorance.” Albert Einstein
Approximating the explosive injection of SO2 into the atmosphere as an instantaneous impulse and applying a convolution to represent its conversion into the aerosol, then feeding this into a second convolution to represent the removal process will produce a simple model of the time evolution of aerosol concentration.
The timeconstants fitted there are 3mo and 9mo , fairly compatible with your stated 1 year. The effect on AOD is virtually gone in 40 months.
I have not seen this double exp convolution elsewhere but it does seems to fit a chemical rate-process evolution of the aerosols, in a qualitative way.
Curiously, I have a problem I assign my kiddy physics students — compute the radius of a dust particle where radiation pressure balances the weight. True, solar wind is massive particles and probably more important than radiation pressure, but either way, one does despair. What happened to the good old back of the envelope calculation? What happened to having a tiny clue about the effect of the reduction of an outward-directed force on an orbit that is stable without it?
Sigh.
rgb
forgot the fuller explanation link:
https://climategrog.wordpress.com/?attachment_id=1278
didn’t you hear the news? the termite population has swelled enormously and some of this population has infested the heliosphere support structure, making it dangerously unstable.
Doesn’t that refer to NIMBY, or Nematode, or whatever that planet’s name is that’s supposed to worm its way toward our backyards.
Whoa, real work! With math! Sorry, Mike, I’ll actually have to work to answer your question. I’m seriously busy today (and shouldn’t have even LOOKED at WUWT, sigh, but — e-heroin …:-) and will need to look at it with more than a glance. The glance I took makes it look like we are not in serious disagreement with the rough scale of the forcing or its lifetime. I was struck by the oddness in the ERBE data — the entire character of the noise changed discretely across Pinatubo, which made little sense to me and makes me doubt the data.
Otherwise it looked a lot like Mauna Loa transmittivity (MLO), and looked at least believable so far.
Beyond that will have to wait until I have time to actually read it. I linked it — no guarantees about the time within my likely memory of the chore, though. Feel free to nudge me at rgb@phy.duke.edu if you like in a week or so if I don’t respond some other way.
rgb
Replying directly to solar pressure to dimmersion of a dust particle, what color is it? And do you want it to spin? Either her ion it is, indeed…. a total correct, or shoot auto correct…. e he iron oh nuts… addictive electronically .. no reply needed, I liked your analysis…
My favorite demonstration of light pressure:
https://youtu.be/Viwly9nt1aY
Comets and other Near Earth Objects already exist INSIDE of the heliosphere, and large objects can travel through it’s boundaries too (see Voyager Missions). It protects the entire solar system from the dangerous radiation of cosmic rays. Comets and Near Earth Objects are affected by gravity, orbit and the magnetic fields of both Earth and the Sun, not the heliosphere.
I have been learned !!!! LOL…thanx
Robert October 6, 2015 at 10:40 am
I think you are overcooking it, forthcoming solar minimum may be at its worst on par with the Dalton (I would expect SC25 to be in region of high 40s low 50s on the old scale, SC26 could fall further down, followed by a rapid recovery). It is unlikely that the next Grand Minimum would be as deep as the Maunder. There were 2-3 major volcanic eruptions at exit out of the Dalton, Iceland had only 2, but during the Maunder Iceland had only 2 eruptions in 50 years between 1662 and 1705, while the last 50 years (1965-2015) recorded 31 eruptions, Iceland is on the midAtlantic ridge, there tectonics ‘follows’ the solar activity.
correction: during the Maunder Iceland had only 2 major eruptions
Agreed, and monsanto will have frost resistant seeds waiting in the wings waiting for everyone caught with their pants down.
Whoaa – it really is worse than we thought. This could screw up our Hawaii vacation plans.
I’m thinking of going to Hawaii to watch the next lunar eclipse in 2018. It’s poorly placed in Colorado.
Not sure if that counts as screwing up my Hawaii vacation plans.
Here is the big one I am waiting for…counting down to, Saros series 145, number 22 of 77.
Only what…four more eclipse seasons to go?
http://eclipse.gsfc.nasa.gov/SEplot/SEplot2001/SE2017Aug21T.GIF
Then in 2024, on my birthday, visible from near my hometown, Saros 139, member 30:
http://eclipse.gsfc.nasa.gov/SEplot/SEplot2001/SE2024Apr08T.GIF
And this one, August 12, 2045, Max eclipse right near South Florida:
http://eclipse.gsfc.nasa.gov/SEplot/SEplot2001/SE2045Aug12T.GIF
So much to live for.
Terrific thread, entertaining too!
Special thanks to Dr Keen and Dr Brown especially for a good-natured but very much to-the-point debate.
The double dusting from the two comet ISON dust streams predicted By NASA in the video below are not involved?
http://www.space.com/20740-comet-ison-will-pepper-the-earth-with-dust-video.html
I guess I have to chuckle at “but only a little”, because it sounds like a disclaimer to the fact that it has happened in the first place
They’ve been telling us that Pluto is shedding some umbra trail or tail, perhaps this is Earth’s?
Or perhaps we’ve entered an oort together?
If the atmosphere is warming, and continuing to warm and not cool, then with the laser sighting and reflectors on the moon have to be continually adjusted for a warmer atmosphere (Meaning, more “excited” gases”)?
A last comment and then much overdue bed. It seems like a real pain to have to wait for total lunar eclipses and then have to correct for the eccentricity etc to extract a number. This seems like an excellent candidate for a permanent satellite to give us an eternal, much more fine-grained record. I wonder if there is an orbit that would work for this purpose?
rgb
Geostationary at 69.25 W, with sensors focused at the Atacama desert (known as the driest place on Earth and already hosting large scientific community). It could be additionally equipped with a large mirror to reflect a reference laser signal.
But that’s only 5R up. I was thinking far enough up that one could get the long path length through the stratosphere that makes the moon red and the free, extremely bright “source”. But there’s that pesky gravity thing, especially with the moon necessarily coming close to sharing the same orbital plane…
rgb
There are numerous practical advantages of geostationary orbit. At about 1000 km is start of the exosphere (?) where atoms from the earth are blown off into deep space by the solar wind. At the geostationary orbit, there are no particles from the earth atmosphere, but there are high energy particles originating from the solar wind. Density varies widely between 3 to 4 up to 50 or 60 particles/cm3 depending on the intensity of solar activity.
Dr. Brown, you are supposed to be catching up with a bit of extra sleep.
I had a bright idea to move Gore’s Gaia camera to the other side of the earth, to the L2 point. That’s the Lagrangian on the “far” side of the earth about a million miles away (4 lunar distances), where, since Earth is 4 times larger than the moon, the tip of the umbra sits. It has a 365-1/4 day orbit around the earth, so it stays in the same place, out on the sun-earth line at the tip of the umbra. What could be better?
But approximate numbers fail us here. The satellite would be just beyond the tip of the umbra, where it would get endless pictures of a boring annular eclipse that overwhelms the brightness of the atmospheric ring you’d be llooking for.
Numbers at “Is L2 in the Earth’s Shadow?” http://www-istp.gsfc.nasa.gov/stargaze/StarFAQ23.htm#q431
Another option may be something in a 30-day (+/-) orbit around the moon, inclined 90 degrees, such that when the full moon passes north of the umbra, the satellite is south of the moon, and so on. I’d have to tinker more to see if the numbers work out. I’d also think that perturbations from the earth could make the orbit unstable, and it would need a bit of fuel to keep that orbit.
Or how about a little webcam microsat orbiting earth in the ecliptic plane at 0.8 or 1.2 lunar distances that would see an acceptable eclipse every 20 or 40 days or so?
Maybe the Chinese would piggyback it on one of their lunar sorties.
Menicholas
October 6, 2015 at 9:31 pm
Clearly isn’t light pressure or it would turn the other way. A photon bouncing off the silver side will have twice the momentum change as one being absorbed on the black, hence twice the thrust on the vane.
What is happening is the temperature of the black side is higher than the silver side so the few air molecules which collide with the sides and bounce off have higher energy after a collision with the black than the silver hence higher thrust on the black side.
When you want to sail the starry black you put a reflecting layer on the mylar sail, not an absorbing one.
That right, rgb of Duke?
Doh!
I stand corrected sir…Well done!
https://en.wikipedia.org/wiki/Crookes_radiometer
BTW, I have one of these and stare at it often. Since I am also familiar with the concept of a light sail, I might have noticed that something was amiss in my off-the-top-of-my-head analysis.
I am heartened that others also got it wrong for a while before the correct explanation was arrived at.
Hmm, this would seem as though it might well complicate the dust particle calculation all the physics toddlers are doing.
If the ideal light sail surface is a perfect mirror, since it reflects 100% of incident photons, and if the photons are carry the same wavelength and hence have the same energy after they bounce off, then were is the energy coming from the accelerate the light sail?
In other words, is the collision elastic or inelastic?
Merely changing direction does..what..exactly…to a photons energy.
We got that conservitation of whatchamahoozit dealio to consider.
oops…where is the energy coming from to accelerate…
BTW, Mike:
” partial explanation is that gas molecules hitting the warmer side of the vane will pick up some of the heat, bouncing off the vane with increased speed. Giving the molecule this extra boost effectively means that a minute pressure is exerted on the vane. The imbalance of this effect between the warmer black side and the cooler silver side means the net pressure on the vane is equivalent to a push on the black side, and as a result the vanes spin round with the black side trailing. The problem with this idea is that while the faster moving molecules produce more force, they also do a better job of stopping other molecules from reaching the vane, so the net force on the vane should be exactly the same — the greater temperature causes a decrease in local density which results in the same force on both sides. Years after this explanation was dismissed, Albert Einstein showed that the two pressures do not cancel out exactly at the edges of the vanes because of the temperature difference there.[citation needed] The force predicted by Einstein would be enough to move the vanes, but not fast enough.”
radiometers work the way you describe. That’s why they rotate away from the black side. But they are fun, aren’t they!
The supermoon on 28th of September should indeed have an effect on the global temperature in the near future. The reason is that it makes a dent in the development of the current El Niño. There is currently a Kelvin wave trying to break through near the Galapagos enhancing the El Niño state. The coming weeks watching these two forces battling this out should be interesting.
“… “This is indeed the smallest volcanic eruption I’ve ever detected,” says Keen. …”
I realize the global economy, trade and economic activity has weakened substantially over the past 6 months.
Could it be we’re seeing an artifact of that, namely, less tropospheric industrial particulates in both hemispheres (mostly northern), rather than just volcanic in one (mostly southern) hemisphere?
Menicholas
October 7, 2015 at 2:08 pm
Just a guess but I think the photon has less energy after bouncing off the sail i.e is of longer wavelength. Ok so that makes it a wave not a particle. This is the problem with the wave/particle theory. Really they aren’t either, it is just a way of thinking about them under certain circumstances.
Yes, I understand that the wave/particle duality is a human construct because we do not fundamentally understand, indeed may be incapable of understanding, their true nature. Simple experiments give results that defy logical explanation.
I have even wondered if the wave-article duality and other quantum mechanical properties may bear on the questions of radiative physics that seems to be a stumbling block on the path to widespread agreement between what seem to be two schools of thought on these pages.
But I am not sure how that bears on the question we started with, unless you are saying you know for sure that the wavelength is decreased and hence energy is deposited that way. Although I am not sure I understand the mechanism by which the wavelength changes…is it a different photon? Is the photon absorbed and re-emitted by electrons in the target…or does it just bounce?
Not being difficult…I do not know and want to understand.
I have been amazed and curious about quantum phenomenon since I was in grade school.
BTW, thanks for responding.
Also BTW, judging by the article in Wikipedia on this device, this is a subject that has puzzled and confounded many great minds in physics for well over a hundred years…so I consider myself in good company to be not entirely satisfied so far.
Younicholas says:
I understand that the wave/particle duality is a human construct because we do not fundamentally understand, indeed may be incapable of understanding, their true nature. Simple experiments give results that defy logical explanation.
I’m not so convinced that’s the case. Maybe we just don’t have the capability of measuring to enough decimal places.
This link seems to explain the wave/particle duality question. Maybe it’s onto something, maybe not. But just because something seems inexplicable, it only means that our current understanding and/or measurements are not sufficient. For example, try explaining laser measurement instruments to Jesus. (Lame example, I admit.)
Also: Mike Borgelt is the master of anything to do with aerodynamics. He is the expert to learn from. When he explains, it’s best to listen, and try and understand. I always learn something from Mike’s comments.
Much as I love you, Mel, neither statement is correct. There is nothing mysterious about particle wave duality, because waves behave like particles in the short wavelength limit. Waves win. The quantum nature of things is the more subtle thing — that the geometry of the waves forces quantization — but is still a straightforward feature of the differential equations, little different from the observation that a plucked string fixed at both ends only oscillates at certain (mixtures of) discrete frequencies.
But the real error is in asserting that experiments defy logical explanation. This is not correct. First of all the mathematical formulation of the theory is mathematically and logically consistent. Second, the logic you are speaking of is Aristotelian/Boolean logic. Although it may be startling to learn, this is not the only system of logic that is, well, logical. Most of the appearance of “logical errors” occurs from a failure to correct formulate the statements.
If you want to read a truly awesome book that walks through at least part of this at a level readily accessible to a decently educated lay person with algebra and geometry but maybe shaky on calculus, the first 3 chapters of Julian Schwinger’s “Quantum Kinematics and Dynamics” is well worth obtaining. I have managed to get used copies fairly cheaply after an undergrad made off with my hardcover copy that I loaned to him. Its first two chapters are the Algebra of Measurement and the Geometry of States, and these two chapters reduce the the classical vs quantum dichotomy to a single practical questions — can one perform ever pair of measurements of a system in either order and get (with sufficient care) the same result or not? If yes, classical physics. If no, quantum. The third chapter is also a gem on dynamical principles, but it is necessarily calculus-y (dynamics, calculus, kinda the same thing) and leads one to the importance of commutation/anticommutation relations in Hamiltonian evolution (classical or quantum, commutation or poisson bracket).
Sadly, this is misrepresented by nearly everybody who isn’t a physicist, making it all seem much more mysterious than it really is. It is difficult math, to be sure, but not mysterious.
rgb
If by “bouncing off” you mean reflection I cannot recall hearing of a situation where a reflected photon undergoes a frequency shift. I think that would have be absorption and re-emission of a separate photon.
Richard Keen
could you arrange to have a spectrometer available?
http://www.astro.up.pt/investigacao/conferencias/toe2014/files/posters/fyan.pdf
Finding out just what wavelengths are attenuated should give a clear indication of what is causing the reduction in intensity.
There’s no mystery about what’s reducing the intensity of the light getting to the moon during an eclipse. Check out Kepler’s four-century-old diagram on my poster that is linked at http://www.esrl.noaa.gov/gmd/publications/annual_meetings/2015/posters/P-48.pdf
The light is bent into the umbra by refraction. Differential refraction between light going through varying densities of air vs. height above the ground spread the light out. On the way through the stratosphere, scattering removes blue wavelengths, leaving the redder ones to go through – causing the color. Air also absorbs light, a further reduction. Then add some volcanic haze – Kepler’s “mists and smoke” – and Voila! A dark eclipse.
The numbers I used were worked out by Frantisek Link back in the 1950s in his book “die Mondfinsternisse” and a chapter in “Eclipse Phenomena in Astronomy”.
Nothing new here; I’m just applying it to a long series of observations.
Menicholas, no worries, mate, as we say around here. Yeah, I’d like to know for sure how exactly the photons interact with a solar sail and impart momentum and energy to it. I think we need to look at Relativity as well as QM.
Come to think of it, the light coming back from a mirror moving away from an observer must be red shifted mustn’t it?
yes.