Guest Post by Willis Eschenbach
Over at Climate Audit, Steve McIntyre is doing his usual superb job deconstructing bad science. In this case he is discussing the recent publication of the long-delayed “Pages2K” two-thousand-year multi-proxy study of ocean temperatures. The paper is called, “Robust global ocean cooling trend for the pre-industrial Common Era,” Helen McGregor, Michael Evans, et al., and it was published August 17, 2015 in the journal Nature Geoscience.
Steve has provided the R code for reconstructing their bizarre method of binning the data in 200-year bins, and then converting the values from degrees C to standard deviations. After going through all of that strange process to get their results, the second author opined in their press release:
Today, the Earth is warming about 20 times faster than it cooled during the past 1,800 years,” said Michael Evans, second author of the study and an associate professor in the University of Maryland’s Department of Geology and Earth System Science Interdisciplinary Center (ESSIC). “This study truly highlights the profound effects we are having on our climate today.”
And here is their money graph, the one that is supposed to show those results.
 Figure 1. From the Pages2K study, showing their binned ocean temperature results in units of standard deviations.
It shows the data in 200-year bins, centered in the middle of each bin, so the first bin is from 0-200 AD and the last bin is from 1800-2000 AD. I saw that graph and I said “Huh?” The change from 1700 to 1900 is not anywhere near 20 times as steep as the drop from the start of the study to the present, as Michael Evans claims. That is simply not true.
However, his statement is clear evidence that they are desperately looking to find a “hockeystick” shape, and are trying any method to find a way to present their results so that they appear to support their alarmist claims.
In any case, I thought I’d take a bit of a different tack from that of the authors, and show their results by ocean, in the original units of degrees C. We won’t be needing any math at all, as I prefer to start my investigations by just using the Mark I Eyeball. Before we can begin to discuss how we might average or combine these records, we need to first see just exactly what each individual record looks like. Let me start by showing the Indian Ocean:
 Figure 2. Indian Ocean results from the Pages2K study.
Warming 20 times faster than it cooled? According to the proxies, the Indian Ocean didn’t cool much if at all, and it didn’t warm much if at all. Those findings certainly do not agree with the author’s claims.
Next, here’s the Southern Ocean, the waters that encircle Antarctica.
 Figure 3. Southern Ocean results from the Pages2K study.
This graph to me perfectly exemplifies the problem with their method of averaging proxies to discern past temperatures. You can see that two proxies start out within a half-degree of each other at 14.5°C-15°C … and one cools steadily for the entire record, while the other doesn’t cool at all. Obviously, both are unlikely to be correct … but which one (if either) is correct?
Then we have the bizarre trace down near Antarctica where the water is cold … it says that the temperatures warmed by about 7°C from the year zero to the year 900 … and then cooled down by 7°C from there to 1900 or so. Unlikely.
Does anyone really believe that if we just average these proxy records in some form that we will actually have an accurate measure of the temperature variation in the Southern Ocean? Because for me, that’s all “garbage in”, and no matter how you might standardize it or anomalize it or average it, you’ll still get “garbage out” for your purported Southern Ocean temperature.
In any case, moving on, we have the Mediterranean …
 Figure 4. Mediterranean Ocean results from the Pages2K study.
This is getting ridiculous. In their unending quest to claim recent anthropogenic warming, they’ve included a short segment that shows strong warming from 1700 to almost 2000 … but the rest of the Med disagrees. One proxy goes level, one has a slight rise since about 1700, and one falls pretty steadily from 400 to 2000. Again, garbage in …
We have two proxies from the Arctic Ocean, viz:
 Figure 5. Arctic Ocean results from the Pages2K study.
Hilarious. One shows recent warming, and one shows recent cooling, both starting about 1700. People take this seriously? Go figure.
The Pacific is next.
 Figure 6. Pacific Ocean results from the Pages2K study. I’ve assigned random colors to the different proxies so that they can be distinguished.
I cannot object in strong enough terms to professionals passing this nonsense off as science. They’ve included several short segments that show the Pacific warming very rapidly, along with another short segment showing it warming and then cooling, and a final short segment that shows it not changing at all since the year 1300… how can anyone mistake this foolishness for actual scientific findings?
I do love the purple line at the bottom, though, showing the Pacific Ocean warming by about two degrees from the year 0 to the year 1380 … righty-o ….
And to round out the madness, here’re the Atlantic proxies …
 Figure 7. Atlantic Ocean results from the Pages2K study.
These include a proxy that claims, in all seriousness, that an area of the Atlantic which had a temperature of 15°C in both the year 0 and the year 1800 had fallen by a whacking 5°C, and was down to 10°C, by 1920 … I’m sorry, but that’s simply not credible. Had it happened, we would have seen it in the observational record.
And strangely, almost all of the cooler Atlantic proxies (less than 22°C) show steady cooling from beginning to end … who knows why.
I’m sorry, but their study is just scientific onanism. There is no way that we can combine these 57 proxies, regardless of what technique we might use, and come out with a meaningful value for global ocean temperature changes.
But that’s just what they claim that they’ve done. They’re claiming that it’s simple, all they have to do take those crazy results from those six oceans, standardize them, take a weighted average based on the area of the ocean in question, and presto, they come up with the global ocean temperature history for the last 2,000 years …
I say that’s dumb as a bag of ball bearings.
Finally, I defy anyone to show me an anthropogenic effect anywhere in these results. Most of the proxies that cover the period 1900-2000 show cooling temperatures, not warming temperatures as the authors claim.
Steve McIntyre continues to parse the study, and I’m sure will have further interesting results. I can’t recommend his site highly enough.
My best wishes to everyone, we now return you to my regularly scheduled holiday … at this moment the railroad train is coming by our tent, and the whistle is loud enough to make your eyes water.
Williams, Arizona.
w.
PS—Is there valuable information in these 57 proxies? I would say yes, very likely so … but they will never find it using those methods. Instead, each proxy needs to be considered on its own merits, and whatever value it might have needs to be considered and determined without reference to the others.
AS USUAL: If you disagree with someone, please have the courtesy to quote the exact words you object to. That way, we can all understand both who and what you are replying to.
DATA AND CODE: Available at Steve McIntyre’s site, linked to above.
Willis,
Your comment about “desperately seeking a hockey stick” could be a book or movie title. I do not know the full history of this effort, but cotemporaneously with Mann’s hockey stick were several attempts by Pollack and Huang at UofMich, as well as others, to produce a hockey stick using borehole temperature data. They committed a large number of errors, and a number of borehole temperature experts told me privately that the community of heat flow researchers knew of the problems, yet no one had the courage to publically correct the issue. I tried to respond to two of their publications with technical comments to Science and Nature, but got spiked as I no longer belonged to a prestigious organization and was a nobody easily over-ruled.
Someone, or perhaps many people, realized around the mid-1990s that a credible hockey stick is the “fingerprint” of AGW needed to assign blame. The search using one proxy or another continues to the present day. The most likely proxies are by now exhausted, but there is yet one more, which is a meta-study of all proxy studies to date. Look for such sometime before December.
The entire exercise is baloney. It cannot be done. We have no REAL data about oceans across the entire planet which happen to be most of the planet’s surface…this cannot be turned into a ‘global temperature’ any more than the atmosphere. That is, ‘past data’ is tiny bits and pieces of various items used to assume temperatures, etc.
We have no ‘direct data’ since thermometers are recent inventions. We can have ‘clues’ about the past and make various assumptions but we don’t have thermometer readings. We guess from rock formations and various life forms that some events happened but our graphs showing temperatures are all assumptions, not actual readings.
We assume the world cooled down a certain number of degrees but these remain GUESSES.
Mixing up real data with past guesses isn’t honest. They are two different things entirely. We have very little direct data about temperatures…less than 300 years and for most of that time, only in a few, very few places and climates.
Based on Brandon’s comments, should this post be locked until Willis reviews and responds? His comments indicate that Willis icould be completely off base, and misleading others who tend to jump on the bandwagon.
We could just as well stop the whole internet while we wait/await, I’m sure it won’t be a problem.
Brad:
Brandon’s comments indicate no such thing. Only that he is artful at parlor games.
The basic fact is that 200 year bins of proxies that themselves smooth out excursions MUST have a bandpass that masks rapid trend changes. To compare that with daily data based trends from excessivly adjusted instrument data that will show rapid flips and flops of trend is either gross incompetance or deception. Choose one… W. is just pointing that out.
And that the deception / error is in the press release not the paper just compounds the mess.
E.M. Smith, if you’re going to make accusations like:
Would you have the decency to say what it is I’ve said that’s actually wrong? This post even insists people do so. You say:
But Willis didn’t point that out. Quite the opposite. He claimed the the authors used their proxy reconstruction to justify saying modern warming was twenty times as fast as past cooling. Or at least, he looked at their proxy reconstruction and said it didn’t support their claims.
It wasn’t until other people spoke up that he even mentioned the modern temperature record, and even then, he only spoke of it to make the false claim the authors had grafted it onto their reconstruction. It wasn’t until I pointed him to the FAQ the authors had published that he realized the authors were just comparing trends calculated from one data set to those calculated to another.
So exactly what “parlor games” are you saying I’m “artful” at? It seems like you’re praising Willis for pointing out what I highlighted while accusing me of trickery for… hiding it?
And what are the issues “comparing” the series Brandon?
What kinds of conclusions can be drawn? Numerical ones, like “20x” for example?
I notice on Steve’s site, where like here, the rapid temperature rise is correctly assigned to the press statement, neither Nick nor Brandon seem to have commented. I wonder why?
As everyone seems to agree, the paper’s data does not show recent warming. Why did the second author then make a press statement (assuming he was reported correctly) linking a thirty year trend to contrast it to 200 year smoothing? The proxies show some had very large and rapid swings – about 5° in 100 years for at least one. Why did he not put a single plot showing the last two hundred years on the graph? Could it be that it didn’t show what he claimed it showed?
chrism56:
I haven’t commented there because I agree with what Steve McInytre has said so far, and I haven’t had anything additional to contribute to it. I try not to comment on posts if all I have to say is “me too.”
He didn’t. He compared a trend over a thousand years to the trend over a hundred years, as described in the publicly available FAQ for the paper. I don’t think that comparison is an appropriate one, but that’s largely irrelevant as long as people keep insisting a different comparison was made.
Why are you guys beating yourselves up over a hockey stick when the paper doesn’t really address the last 50 years?
Evens’ comment clearly refers to the instrument record in comparison to his study. It seems no one, including the blog author, knows this.
Amazing.
Pippen says:
Why are you guys beating yourselves up over a hockey stick…
What’s ‘amazing’ is that pippen doesn’t see that it’s the hokey stick that is always being beaten up. For good reason: it’s bogus.
Sorry guy, or gal, I don’t know.
You add the instrument record to this study and you have a hockey stick. Plain and simple.
(You can even use the satellite record, although SST would be more appropriate.)
“the hokey stick…: it’s bogus.”
only in your mind. Take the the blue pill next time.
pippen,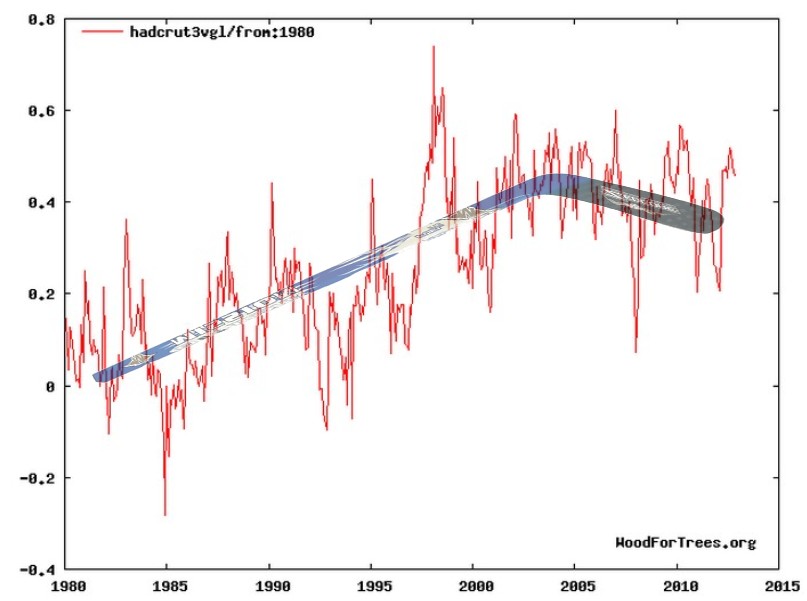
Here’s the latest hockey stick:
Of course, if you believe this fabricated nonsense, there’s no hope for you:
http://www.realclimate.org/images//Marcott.png
“Today, the error bars are increasing about 20 times faster than they did during the past 1,800 years, we just donwanna show em,” said Michael Evans.
There. Fixed fer ya, NE Orgun style.
ristvan September 12, 2015 at 8:45 am
Reply
Brandon Shollenberger September 12, 2015 at 9:11 am
Thanks, Brandon. I hope you can explain how figure S10, which is in units of standard deviations, could be used “to show exactly how well/poorly their proxies match up with the modern instrumental record”.
To start with, they have used the Kaplan SST climate model output, which both you and they claim is the instrumental record but in fact is no such thing. It is climate model output that is constantly “nudged” by real data to keep it from going too far off course. Since many, perhaps most of the sites have no SST data to speak of in the 1800’s and early 1900s, that means they are comparing their proxies to the guesses of a climate model as to the local temperatures. I fear that will show us little about the “modern instrumental record”.
Then they convert those model guesses to standard deviations.
The problem is that real data is much more rough and contains jumps and sudden changes that model output doesn’t have. Nature loves edges. You see one ocean temperature for miles and miles, and then there is a line and the temperature might drop immediatly by a couple degrees C. A computer assumes that if we have two values A and B at two locations, that the best guess for the value halfway between the locations is the average. While that may be true mathematically, in the real world the odds are good that the most likely value is either A or B, but rarely the average. Think about one point that is in a cloud, and one point out of a cloud in clear air. Is the point halfway more likely to be “half-cloudy”, or is it more likely to be either cloudy or clear? Mathematically the best guess is “half-cloudy”, but the real world doesn’t work that way. It has edges and patches and distinct regimes, not a smooth slide from one value to the next.
And since the computer output is generally smooth and usually without outliers, standardizing it can give very misleading results.
SO … having misleadingly called the guesses of a climate model output “observations” and standardized them, they have then converted their proxies to standard deviations. Here’s the process used for both sets:
In other words, they first averaged the each proxy into eight bins … and then they standardized those eight bins. I see no discussion of the error inherent in standardizing such a minute number of data points, but it is non-trivial.
However, setting all of those problems aside, AND assuming that they have done the math correctly, AND assuming that the Kaplan climate model output resembles actual observational data … then all Figure 10 shows is that THE PROXIES DO NOT MATCH THE OBSERVATIONS FOR BEANS!
And they make no bones about that, saying:
Gotta admit … I do love their term for two datasets with a correlation p-value of 0.43 being called “non-significantly correlated”. Since virtually any two datasets will have a non-zero correlation, that category is just doublespeak for saying we tried really hard but found nothing significant, so we will just call them “mumble-mumble correlated” and hope people don’t notice the rest.
And given that, Brandon, how is it not anti-scientific for Evans to come out with alarmist statements? You go on to say:
That’s not clear at all … what does “actually I do” mean? The way it is written it means you do “think the paper is a good paper” … was that your intention?
In any case, I find nothing in Figure S10 or anywhere else that justifies Evans’s claim of 20x warming. Instead of falsely accusing me of not having looked for such evidence without the slightest attempt to justify your accusation, how about you tell us just exactly where Evans’s claim is supported by the paper?
Here’s my real question, Brandon. Suppose you took your thermometer with you on a world jaunt. Every year, you stuck your thermometer in the ocean somewhere near to a coastline, maybe once, maybe two or three times, in different spots. On average, you came back to the same spot about every twenty years, but you might not come back in your lifetime. So some spots would be way over-represented, some would be way under-represented, and the overwhelming majority of the ocean would never be sampled at all.
Are you seriously contending that a total of two or three samples per year, one sample every twenty years or so for each of those coastal locations, is enough to tell us how fast the ocean is warming or cooling? Is that information solid enough to be a cause for worldwide alarm? Is that a basis for alarmist claims regarding relative rates of warming? That seems to be what you are saying.
Call me crazy, but I think that is massive under-sampling. A few samples per year from just the coastal areas of the entire ocean, which covers 70% of the earth’s surface, is far, far from enough information to make the kind of hysterical alarmist claim that Evans is making.
But heck, if he’s right, we can get rid of oceanographers and the Argo buoy system, just take two or three measurements per year at a limited number of points near the coast, Dr. Evans thinks that’s all you’ll need …
w.
I’morry Willis Eschenbach, but I’m not inclined to discuss your inability to read simple sentences until you address the fact you didn’t bother to read the paper you criticized, and consequently, you made a series of false claims about it. That you choose to cherry-pick which points to respond in order to avoid addressing this very simple and very obvious fact does not oblige me to ignore it as well.
But since you chose to claim I made a false accusation based on this, I should point out I never said the supplementary material was the source of Evans’s claims. It wasn’t. I was just pointing out that you were clearly unaware of the material, meaning you hadn’t even read the supporting documentation for the paper.
If you had pointed to it in the first place and talked about how it didn’t support Evans’s claims, that’d have been fine. But instead, you acted like it didn’t exist. So clearly, you didn’t know about it even though it was mentioned in the paper and shown in the supporting documentation. That’s pathetic.
Brandon Shollenberger September 12, 2015 at 9:34 pm
Brandon, until you quote my exact words that constitute what you say are my “series of false claims”, I fear you’re just playing with yourself. I can defend my own words. I cannot defend your fantasies about my words.
In any case, it doesn’t surprise me that you are unwilling to answer the specific scientific questions or deal with the scientific issues I raised. I’ve come to expect this kind of behavior from you. You tend to run from the science and take refuge in meaningless ad hominem attacks.
Regarding reading the paper, I have to admit that you are right. I read as little of it as I possibly could consonant with finding out about his 20X claim. It’s a painful paper to read, so I skipped large sections that obviously were not relevant. I had, however, read the Supplemental Information in some depth, although again I skipped parts of it. Generally (and in this case) the SI is the important part because it contains the methods used by the authors. This was equally painful but didn’t help either.
Neither one explained the “twenty times” claim. So you are quite correct on that score, I paid little attention to the various fanciful claims and odd explanations in either the paper or the SI … but so what?
I say again, so what? Whatever you think I missed by not giving their nonsense a full and detailed reading, whatever it was that you believe was so critical and essential that you think I neglected by not reading some part or other of the paper, you’ll have to point it out to me. Despite going over the paper again several times since, I still can’t find anything in the paper to remotely justify Evans’s claim. And much more importantly, I still can’t find anything in the paper that makes a single word I said incorrect. What mistake is it that you claim I made because I didn’t give the paper a complete, painful, in-depth reading prior to pointing out the obvious errors? And please, quote my exact words regarding my claimed mistake. I’m tired of your vague accusations.
However, foolish me, I had not read the FAQ, where they attempt to explain the “twenty times” claim. And having read it … it still makes no sense. It is the worst kind of apples and oranges comparison I could imagine..
In any case, my statement was simple:
Now, that statement is undeniably true. I know you don’t like it, but it is true. Their results do NOT bear out his claim of 20X faster warming.
As a result, I could only conclude that while Dr. Evans based his claim of long-term cooling on his study, he could only justify his 20X statement by throwing away the results of his study and tacitly saying that they were wrong …
I don’t know how I can make that simpler for you. Let me try it this way.
The only way his statement makes sense is if his study is correct about the long term trends but totally wrong about the short term trends.
And that was my main problem with the study, one that you keep trying to divert peoples’ attention away from. His own results did NOT bear out his claim. Which, I can only assume, is why he tucked his explanation away in the FAQ.
Perhaps you could tell us how that is supposed to be a “robust” scientific claim, when to make the claim at all he has to deny his own results. And then you might actually respond to the scientific issues and questions that I posted to you above … oh, wait, I forgot, you greatly prefer to wave your hands and discuss who read what and make ad hominem attacks instead of dealing with questions about the actual science.
Well, wave on …
w.
Brandon clearly not understanding that “absence of evidence is not evidence of absence”…
Is it me or is this same idealistic temperature data being binned into regular periods similar to low hanging fruit solar theories and graphs purporting to demonstrate it’s the sun watdunnit. It certainly has a familiar ring to it.
Brandon. I finally found the FAQ here.
http://www.pages-igbp.org/ini/wg/ocean2k/nature-geoscience-2015-faqs.
Their references for the temperature rise seem to be IPCC and Stott, neither of which reference the water temperature rise they describe. Have they mixed the air temperature record or SST with the ocean temperature, which is what the proxies were supposed to measure? They aren’t clear on which temperatures they are talking about in the FAQ. And has people have commented, in their original data graphs, very few of the long series seem to have a significant change in the last 200 years.
My comments on the 30 years relates to the 1970-2000 period which most see as the AGW signal for the oceans. The IPCC Chapter 10 p870 also have this view.
In the SI, they had the SST error as 1.66°C, which implies most of their variation is within the error. And nowhere in the SI do they seem to discuss the wide variability within the 200 year window which I think was Willis’s point. If you average a lot of garbage, you might get an answer, but how meaningful is it?
To Nick and Brandon
I do not understand how anyone could justifiably seek to compare ocean temps with the thermometer record which is largely land based observations.
Oceans and land warm and cool at different rates, so on what basis can one make a valid scientific argument that today’s warming (which is based upon the thermometer record) is ~ 20 times that of the ocean cooling based on proxy evidence.
To make any comparison with today, one would have to look at ocean temperature data only, and the records that we have on that,.prior to ARGO, is worthless (and this comes from someone who has spend ~30 years looking at ocean temperature measured and recorded by ships). We have no worthwhile data as to how oceans have warmed/cooled this past century.
Further, one cannot compare say a 50 year period (assuming that that is what is referred to in the ‘recent warming’) with 200 year data bins because of differences in resolution, How do we know that within the bin leading up to the peak of the MWP there is not a period of say 30 to 50 years of warming at a rate greater than that ‘observed’ in the ‘recent warming’ period? Or how do we know that there is not a 30 to 50 year period in the 200 year data bin leading up to the trough of the LIA which did not have a rate of cooling similar to the rate of warming in the ‘observed’ ‘recent warming period?
We simply do not know on the proxy data and the way it has been presented in 200 year data bins.
.
The statement: “The recent warming is larger ([|~1° C / ~-0.5° C| = 2) and more rapid by a factor of roughly 20: (| [~ +1° C/100 years]/[~ -0.5/1000 years] | = 20)” could be correct, but it simply something that is unknowable on the basis of the data provided.
AND talking about evidence, where is the evidence for this statement:
“4. The recent warming is larger ([|~1° C / ~-0.5° C| = 2) and more rapid by a factor of roughly 20: (| [~ +1° C/100 years]/[~ -0.5/1000 years] | = 20) than the volcanically induced cooling trend over the last 1-2 preceding millennia.”
There is no hard evidence that the cooling over the last 1 to 2 millennia was volcanically induced. That is mere supposition based solely upon modelled assumptions.
The fact is that in this paper, once again, one is simply seeing the over extrapolation of poor quality data without a true and proper description of the error bounds and the inherent limitation of the proxies used. Quite simply, the data (and its true worth) does not support the wild claims being made
richard verney September 12, 2015 at 5:22 pm
They’re not doing that, although they’d like you to think so. They’re comparing the proxies to a reanalysis climate model output.
w.
Their estimate of modern warming comes, they say in the FAQ:
“3. From historical observations, realistically forced simulations, and detection and attribution studies (e.g. Stott et al. 2006 (link); Bindoff et al. 2013 (link), Ch 10, Fig. 10.1, pg 879), our best estimate is that since 1860, mean surface temperature has increased about 0.5 to 1.5° C over 150 years, or about 0.3 to 1° C per 100 years.”
The references are to AR4 and AR5. The specific Fig 10.1 has various plots, including HADCRUT (and GISS and NOAA) and some modelling. I’m not sure how they assembled their ranges, but HADCRUT supports something like 1°C/100 yrs, and more if you go to, say, 50 years.
And Richard, the surface indices are about 70% SST.
Nick, given the many ways this idealized data string can be fiddled with, it would seem to me that the spread related to error bars generated from reanalysis algorithms negates any significant statements related to being the greatest, most worrisome, or “we-should-do-something” rate of rise statements. No?
Not a climate scientist (is that a good thing or a bad thing?) but I can’t believe that ANY of this proxy data, be it tree rings, cores or whatever, can do anything but give a general idea of what might have happened in the past.
To me the graph says the ocean was warming for the first 1500 years AD then it cooled and now it is warming again. I tend to discount any attempt to use proxy data to nail down exact temperatures.
Trends only.
Thank you Willis for another valuable ‘Public Review’. This time of the CAGW agenda-driven McGregor, Evans et al paper. You clearly reveal that it is ridiculous to combine the individual proxy graphs to create the ‘Compiled Sea Surface Temperature’ graph.
In my opinion, the purpose of the McGregor/Evans paper is to put into the public media the ‘Money Graph’ image labeled ‘Compiled Sea Surface Temperatures’ ahead of the Paris conference. This graphic hides the Roman and Medieval warm periods and the Little Ice Age as well as showing an ‘alarming’ recent temperature increase. In my opinion, it is being published for the same reason that Mann’s hockey stick was published; to pretend that recent temperature increases are unprecedented and man-made.
If you doubt this is the agenda of the two lead authors, then simply look at what their university websites say:
University of Maryland (Michael Evans) headlines:
https://cmns.umd.edu/news-events/features/3176
– 1,800 Years of Global Ocean Cooling Halted by Global Warming
– Comprehensive analysis of ocean surface temperature data shows a cooling trend preceding the Industrial Revolution
– Prior to the advent of human-caused global warming in the 19th century, the surface layer of Earth’s oceans had undergone 1,800 years of a steady cooling trend, according to a new study.
University of Wollongong (Helen McGregor) headlines: http://media.uow.edu.au/releases/UOW200429.html
– GLOBAL WARMING TRUMPS 1,800 YEARS OF COOLING
– Scientists find man-made global warming has triggered a reversal of natural ocean cooling.
Both websites make the clear claim that man-made global warming has caused global cooling to turn into global warming.
A couple of posters on this thread are trying to confuse things by claiming you have not read the paper. The only relevant question is are the individual proxy graphs you show the ones used in the paper? Yes or no? If yes, the paper is garbage.
Thank you to you and Steve McIntyre for demolishing this paper so quickly.
“4. The recent warming is larger ([|~1° C / ~-0.5° C| = 2) and more rapid by a factor of roughly 20: (| [~ +1° C/100 years]/[~ -0.5/1000 years] | = 20) than the volcanically induced cooling trend over the last 1-2 preceding millennia.”
Never mind the spurious logic of comparing a long-term trend with a short-term trend. Here’s what upsets me – “volcanically induced cooling trend” What are they talking about? Which volcanoes, and when? Also the statement seems to imply that volcanic activity is a thing of the past and that there will be no more volcanic eruptions in the future. Who are these people and where do they get their ideas? (hint: that’s a rhetorical question).
How many proxies are available for ocean temps? Did they use all of them? If not, what’s the criteria by which they chose the ones they included in the study? It seems to me that there is much room for conscious or unconscious bias in such a study – even if they vehemently claim not to have cherry-picked their proxies.
Brandon Shollenberger September 12, 2015 at 9:09 pm
Are you truly this stupid, or are you just pretending to be this stupid, or do you think that the following doesn’t apply to you because you are just so gosh-darn brilliant? Please read the following a hundred times until it sinks in:
Then come back and quote for us just what “false and absurd claims” you are babbling about.
w.
W.: A propaganda hit piece depends on the power of stupid. It is a design goal of the method. Quantity of the slander matters more than veracity, that can be slightly negative and still work if repeated enough… but don’t ever expect the purveyor to admit to the method.
Every scientific paper that seeks to analyse data and draw conclusions therefrom should start off with a preliminary section in which a quality audit of the data being used is conducted and set out. It should explain to the reader, the weaknesses and limitations in the data, and why it is claimed that the data is fit for the purpose to which it is being put.
This is particularly so with proxies. There should be an in depth discussion as to the limitations of the proxies, how it is claimed that they capture the signal that is sought to be analysed, how the proxy may be influenced by factors other than the signal which is sought to be analysed, and how the proxy responds to those other signals. This description should explain how the proxy is being calibrated, and the shortcomings with that calibration, and above all a detailed discussion as to the true and realistic error bounds, and why it is claimed that the error bounds set out, are reasonable.
All that Willis has done is a very preliminary and basic quality audit, but even this ‘first brush’ approach to quality assessment shows severe limitations with the data being used. It shows why it is not fit for purpose. Had the authors of this paper performed even this cursory examination of the quality of their data, this paper would not have been written in the form that it has.
This article is an extremely good example of the shortcomings with the present approach to this science (if one can call climate science, science), and in so doing, it also demonstrates the short comings in peer review. Why didn’t the reviewers critically assess the quality of the data being used? If the authors of the paper had not carried out a proper quality audit, the reviewers themselves should have done so in order to see whether the data is being over extrapolated.
” should start off with a preliminary section in which a quality audit of the data being used is conducted and set out”
Have you read the paper?
The first section following the introduction is titled “The Ocean2k SST synthesis data set”. And it does indeed examine various biases, limitations of distribution etc. Maybe you can find valid criticisms. But you have to look first.
Nick, if you didn’t see it, Willis’s answer to that question is a big, fat “No.”
Well said. +10
And when all of this is done, it seems to me that any disciplined scientific mind would realize that a large portion of paleo-climate proxy data are basically mush.
One Simple reason why the paper needs significant improvement has already been highlighted. Even if the proxies used were atmospheric related they generally don’t match the instrumental record, so comparing both side by side is like comparing oranges with apples.
Problem is even worse than that using ocean proxies, which warm and cool at different rates to the atmosphere. Proxies should always be shown how they fair compared with recent modern history and the paper does do this.
The graph below showing UAH global land against global ocean highlights the difference in warming rates over just near a 40 year period. The global land temperatures warmed more than twice the rate of the ocean.
http://i772.photobucket.com/albums/yy8/SciMattG/UAH%20Global_LandvOceanTemp_zps8byetr3v.png
If the difference can be as much as this in just a few decades, what could be shown over hundreds of years?
What I forgot to add was using ocean proxies hides the small changes in warmer and cooler periods that are observed on land. Incidentally this causes the long term trend over hundreds of years to look less varied and hide key changes in atmospheric climate history that were well documented over civilization history.
“Today, the Earth is warming about 20 times faster than it cooled during the past 1,800 years,” said Michael Evans”
This is total nonsense that should never have been Incorporated with the public announcement of the paper.
The money graph clearly shows that cooling from 1100 to 1300 was at a much greater rate than 1700 to 1900. So was cooling rate from 1300 to 1500 and 1500 to 1700. Mr. Evans may not be aware the industrial revolution did not start in 1700. And the explanation for the flat temperature from 100 to 1100 is ? Finally this graph in no way demonstrates any affect of humanity on climate. Maybe what Mr. Evans meant by the “profound effects we are having on our climate today”, was the profound effect he was having on his climate when he turned the thermostat up in his dwelling.
Or maybe Mr Evans is liar who is stupid, otherwise known as a stupid liar.
Thanks, Willis.
I can always learn something by reading your essays.
In this case, how (again) an alarmist paper bites the dust (in the oceans?).
What strikes me about this sort of paper (and no, I have not read it properly) is the absence of anything like a clearly specified model/hypothesis about the connection between proxy and temperature. This is essential to any sort of rigorous inversion from aggregated proxies to temperature. At first sight, this effort seems particularly lacking in this regard, since they just randomly sample (10k times) from the proxy (standardized) bins, calculate the resulting slope for each sampled time series and declare the median of this jumble as an estimate of temperature slope. They will be doing well if there is a transparent model for which this establishes a well formulated temperature slope from multiple proxies. It might all be explained in the SI, but it would seem technically challenging (that’s a euphemism!)
I’ve met people who believe they can just make-up their own statistical algorithms (for example linear trend) and with authority, say their made-up algorithm is both valid and reliable. This kind of study reeks of problems associated with valid and reliable statistical methods. And it reeks of the missing model standard: Does it compare to raw observations.
Epic fail of ever important diligence towards accepted validity and reliability measures. If the pharmaceutical industry were relieved of its strict and imposed validity and reliability obligations we would immediately be back to the snake oil days of buyer beware, with co-commitment human misery and death.
Oh…wait…we are already there with climate science…
damn autocorrect…concomitant…
This is rather amusing. This post includes the note:
As such, when I responded to the post to criticize it, I quoted it to point out an obvious error in it. I then provided excerpts from an exchange between Willis Eschenbach and Nick Stokes, quoting both of them, to show Eschenbach had no idea what the people he was criticizing had actually done to try to justify the claims he was criticizing. Eschenbach never responded to this comment.
He did, however, respond to some response I made to another person’s comment, without using the Reply feature to say:
So when I made a comment to respond to this post, I quoted the text I disagreed with as the post required I do. I got no response. When talking to another person, I then referred back to that. Willis Eschenbach replied, without using the Reply feature or providing a link, to call me stupid because I didn’t provide quotations.
And he did it again, making another comment to reply to me without using the Reply feature when I was responding to another user. He’s responded to almost every comment thread I’ve participated in, save the one I made to lay out my disagreement with this post while providing quotations, all while condemning me for not providing quotations.
The best part though? He’s already admitted the central point I made – he hasn’t read the paper. He flat out admitted he didn’t read the paper. The paper isn’t even eight pages long, and he couldn’t be bothered to read it. Two of those eight pages are devoted to things like references. That means he couldn’t be bothered to read a six page paper, half of which is made up of pictures. That means he couldn’t be bothered to read three pages of text before writing this post!
Brandon, that’s hilarious. I have asked you again and again just what you find wrong in my post. The best that you can come up with is that you think I didn’t read the paper adequately.
However, given that you haven’t pointed out one single error in my work, it seems my reading of the paper was both adequate enough to baffle you completely, and sufficient to correctly point out the problems with the work.
I don’t get it. Either what I said was right or it was wrong, whether or not I’ve ever laid eyes on the paper. If you could come up with some error that I’ve made, I assume you would have done so … instead, all you want to talk about is my reading habits. Now perhaps my reading habits are fascinating … but when are you going to get to the science?
The only vaguely scientific contribution you’ve made was regarding my comment that:
You said this was “false and absurd” … but unfortunately for you, it is true. Michael Evans OWN STUDY does not agree with his claim. In order for Evans’s claim to be true, the last 200 years of the study have to be false.
I’ve said that before, and invited you to comment on it. I even simplified it above in case it was too complex for you, saying:
So I’ve answered your claim, and asked you to comment on my answer … and still all you can do is whine my reading habits …
But heck, I’ll try again.
Evans is basing his claim of the “20 times faster” on his own study, because the study is the source of the long-term trend he is claiming is real.
However, Evans is also saying that the recent part of the study is meaningless. And in fact, he’s right about that part at least. As the authors point out, the fit between the proxies and the reanalysis dataset is abysmal.
But if the recent part of the study is meaningless, as Evans says, then so is the long-term trend.
I don’t get it. I don’t see how you can defend his statement, when it is contradicted by his own study! (Which, of course, is what I said, and what you have claimed is false and untrue and such.)
His claim IS contradicted by his own study, Brandon. Get used to it. What I said is simply true. I know you don’t like that it is true, and I know you’d rather talk about my reading habits, but my statement is 100% verifiably factual.
And it is true whether or not I’ve ever read a single word of the study. The study contradicts his claim, which was my point. If you can tell us what part of my statement is not true, that could be a start to a scientific discussi… … aw, never mind, as if you cared about the science. “Anything but the science” seems to be your motto …
Anyhow, have fun discussing my reading habits, Brandon. It is a fit subject for your level of comprehension.
w.
Willis Eschenbach:
Um, sorry, no. You don’t get to do that. Remember how you said:
I’m going to have to call you on that. So Willis, are you truly this stupid, are are you just pretending to be this stupid, or do you think that the note you yourself wrote doesn’t apply to you because you are just so gosh-darn brilliant?
You just wrote a lengthy comment in which you claim I am wrong without once quoting anything I supposedly got wrong, after harshly insulting for supposedly not quoting you when I said you got things wrong. Not only is that blatantly hypocritical, but I had in fact quoted you, meaning your accusation was false in the first place, which you’ve conveniently ignored.
So tell us Willis, how stupid are you? Or are you “just so gosh-darn brilliant” your own rules don’t apply to you? What about things like “the truth”? You know, like how I did in fact quote what I said you got wrong when you made your harsh insults which said I hadn’t?
So… cool. Willis Eschenbach insulted me for supposedly failing to quote his words which I disagreed with as requested by the note in this post, despite the fact I had done exactly that. Then he turned around and wrote a lengthy comment saying I was all wrong on the topic of this post, without once quoting the words of mine which were supposedly wrong. And when I called him on this, he… quit responding?
I don’t know. Maybe he just needs some time. It’s only been 18 hours. I’ve gone offline longer than that in the middle of discussions. It just seems awfully convenient timing. He keeps responding at a fairly regular pace until he’s forced to admit he hasn’t read the paper and can only make a hugely hypocritical comment which has no substance and contains nothing but a rant about how wrong I am, and suddenly he takes far longer to respond?
I don’t know. I just can’t help but think if he actually had anything he could point to that I’ve said which is wrong, he’d have pointed to it by now.
Brandon Shollenberger September 14, 2015 at 12:10 pm Edit
Take a deep breath there, son, your radiator appears to be overheating. I’m on holiday, and I intend to enjoy it, not spend all my time arguing with the intellectually challenged.
As far as quoting your words, the only thing you said was in response to my comment that:
You said that my statement was “false and absurd”, which I did quote directly and exactly.
Since I have invited you several times to tell me exactly what was either false or absurd about my statement, which I hold is undeniably true, and in response you’ve done little but babble about my reading habits … sorry, but you’re not exactly on the top of my priorities list.
Anyhow, rant on … I’m going back to my holiday. To date my interaction with you has merely served to inform the lurkers just what kind of a person you are, and how little you care about the actual science, and that’s enough for me. I’m outta here.
w.
Willis Escehbach:
Are you lying right now? I explained exactly what was wrong with your remarks in my very first comment, a comment I’ve referred back to multiple times, one which you’ve studiously avoided responding to. The comment even referred to other things you’ve said than just that remark.
You’ve managed to respond to basically every comment thread I’ve participated in, save the one where I directly addressed this post, providing quotations and explanations to show why you’re wrong, and then you’ve turned around claiming I haven’t provided quotations or explanations to show why you’re wrong. And no matter how many times I point this out, you keep pretending that comment doesn’t exist.
You’re either the most willfully blind person I’ve ever met, the stupidest person I’ve ever met, or you’re just lying. Which is it?
Actual science? I’m the person who pointed out what was actually done in the paper to you, correcting your misunderstanding on at least one point and drawing your attention to the supplementary material which was hugely relevant on another point. You’ve… done nothing but say incorrect things about the paper and ignore my substantive remarks, insulting me and pretending I didn’t write them.
But sure, go with the ad hominem attacks. I’m certain that will convince everyone the points I made which you never bothered to even attempt to address are wrong.
“Does anyone really believe that if we just average these proxy records in some form that we will actually have an accurate measure of the temperature variation in the Southern Ocean?”
Why not? Lots of people seem to believe that averaging a bunch of temp readings from different places gives you a global temperature.
I’d say both are equally useful, which is not at all.
Nicely done, Willis. I think you have fairly demolished the study.
Thanks, Bart. I am not a fan of such “multi-proxy” studies. No matter how you average them or standardize them or weight them, it’s still garbage in, garbage out. Look at the proxies for the Arctic. They track each other for 1,700 years, and then they diverge. What good will averaging that do? Does that in any sense give us an average arctic ocean temperature for 2,000 years?
The fact that they have 57 proxies doesn’t solve that problem, it just makes it worse.
I note that Brandon never responded to the following question I posed to him:
Actually, the question isn’t really for Brandon, but for the authors of the study … but I couldn’t ask them, and unfortunately he’s allergic to scientific questions … however, my point still stands.
w.
Willis Eschenbach:
Well, yeah, but that’s because your question was completely idiotic. You asked me things like:
Even though I’ve written detailed criticisms of multiple temperature reconstructions and have said on numerous occasions we don’t have sufficient data to draw the sort of conclusions the paleoclimate field has been trying to draw. Heck, I’ve tried to get people interested in creating a wiki-like resource for paleoclimate reconstructions which would document their methodologies and data for the purpose of showing the problems which exist in the field. I practically jump at the chance to discuss any of the more obscure temperature reconstructions simply because I’ve spent so much time learning about the field and never get a chance to discuss the problems of it because there’s so little interest.
So while you’re free to say things like:
Anybody who’s actually looked at my writing on temperature reconstructions knows I’m unhesitatingly critical of them, and I’m more than willing to spend a lot of time explaining why. It’s to the point where Steven Mosher, who does not get along with me, has said I probably know the topic as well as anyone save Steve McIntyre.
So yeah, you can believe what you want, but the truth is if anyone had a real question for me, I wouldn’t hesitate to answer it.