Noted hurricane expert Dr. Philip Klotzbach of Colorado State University has had some interesting discussion and stats on his Twitter feed, for example:
10 years ago today, TD 10’s remnants brewed north of Hispaniola. 8 days later, Katrina was a Category 5 in the Gulf.

It is worth noting that 2005 had 11 named storms, seven of which hit land and five of which caused major damage. In contrast to that era, we’ve recently seen the fourth named storm in the Atlantic, Hurricane Danny, fizzle out back to tropical storm status last Saturday, and now as a tropical depression is listed as remnant status by NHC. Given NOAA’s recent update for a below normal season, this isn’t surprising.

The remnants of Danny is forecast to hit Haiti and the Dominican Republic this week, the storm could still cause some wind-and-rain damage to island infrastructure. But, its days as a hurricane or organized tropical storm are likely over as El-Nino-fueled shearing winds tore apart its core, weakening it in the process. Klotzbach noted:
30-day-averaged Caribbean shear remains at record high levels (since 1979).

Clearly, wind shear dismantled Danny, and this increased wind shear is likely the biggest reason for our major hurricane drought continuing this year.

Klotzbach found that wind shear has been record-breaking this summer in the Caribbean, exceeding conditions present during the big El Nino year of 1997.
The Washington Post’s Angela Fritz wrote about this last month.
“As hurricanes develop from thunderstorms, they need to grow tall in the atmosphere as heat and moisture is concentrated in the middle of the storm,
…
If winds are too strong at the upper levels, it can tear a young storm apart, or even prevent it from developing in the first place.”
Klotzbach also noted that Danny distinguished itself as one of the weaker recent hurricanes:
Danny generated 9.2 ACE. This is the least generated by a MH forming south of 20N, east of 60W since 1950 – beating Fred in 2009 (9.9 ACE).
This follows the below normal season so far this year:
North Atlantic TC stats update thru 8/23. TC activity running ~75% of normal to date.
…
Since 2011, 6 of 9 (67%) of Atlantic major hurricanes (MH) have lasted less than 1 day at MH strength. The 1900-2000 average is 29%

But Nature abhors a vacuum, and in the Pacific, Klotzbach notes it is a different ballgame:
Northeast Pacific (East of 180W) TC stats update thru 8/23. Activity about 150% of normal to date.
…
The NW Pac has already had more Cat.3+ typhoons (9) in 2015 than they got in average 1981-2010 season (8.9 Cat.3+ typhoons).

Dr. Roger Pielke Jr. notes on his Twitter feed that the trend lately is for less hurricane related disaster losses, which flies in the face of climate change advocate claims that hurricanes and their damage are getting worse.
US hurricanes account for ~65% of global disaster losses. Hence the attached is no surprise.

Tough times for alarmism, I’d say.
Headline: “Wind Shears, Perhaps worsened by Global Warming, Deprive Coastal Lowlands of Much Needed Moisture”
Good one!
If Man didn’t cause it, there’s no need for Man to “control” it.
That’s the bottom line.
Is Man responsible for the weather? (…er…climate?)
Only on the SyFy Channel.
Man isn’t responsible. Only White Men.
White Men are responsible for everything that is wrong in the world, didn’t you know?
Of your skin ain’t white or you have a hole between your legs, you are by contrast an Oppressed Hero(ine). And can do what you like.
(spoken only half in jest).
Regarding: “It is worth noting that 2005 had 11 named storms, seven of which hit land and five of which caused major damage.” It is worth noting that the 2005 Atlantic hurricane season had 28 named storms. And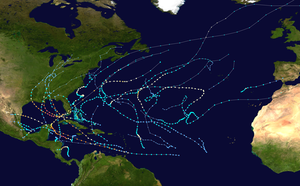 indicates about a dozen of them making landfall.
I didn’t see any names or color codes to explain – nice graphics though.
Here’s NOAA’s summary. : https://www.ncdc.noaa.gov/sotc/tropical-cyclones/200513
There was 27 named storms. I seem to recall that there was an additional storm that later analysis indicated should have been named (would therefore match your statement of 28), but I can’t seem to find any sources on that. The list on the link has 13 storms that made landfall, plus another (Ophelia) which “Struck North Carolina, but did not make official landfall”. It looks like 7 landfalling storms had hurricane strength at some point, so maybe that’s where that number came from.
Concept of the current hurricanes falling back as perceived in 2011
http://www.vukcevic.talktalk.net/AHA.gif
(last updated in 2012)
http://www.wunderground.com/hurricane/accumulated_cyclone_energy.asp?basin=ep
Ooops! That was the wrong basin, here’s the Atlantic showing this year is one of the lowest on record. http://www.wunderground.com/hurricane/accumulated_cyclone_energy.asp?basin=al
Thanks Mike , I will update the graph for 2013 &14 ACE and the AAP which will take ‘prediction’ to the end of 2020s. .
“above normal?” what is normal – 1/2 std dev above and 1/2 std dev below the mean?
Normal bandwidth is defined and set by NOAA. At the time of the graph construction in 2011, the limits were at 70 and 110 if I remember correctly. I assume it would be adjusted from time to time in order to reflect the new ‘normal’.
“Clearly, wind shear dismantled Danny, and this increased wind shear is likely the biggest reason for our major hurricane drought.”
Ok, that explains this year but, what about the last 10 years? According to the graph above, while the wind shear for this year may be at a record level, wind shear has not been at high levels for the last 10 years.
There are several other parameters that have to line up right for a strong hurricane season. AMO status (warm, like now, enhances), African dust (reduces development in eastern Atlantic “Main Development Region”) , sea surface temperature (related to AMO, dust, and other sources).
no trends hurricane activity 1945-2014
http://papers.ssrn.com/sol3/papers.cfm?abstract_id=2630932
I heard the last bit about this on NPR this morning, where they stated that they could not find a link between climate change and the lack of hurricanes. File that one into the “climate change only causes bad things” folder.
Doug Bunge
August 24, 2015 at 9:50 am
I heard the last bit about this
on NPR this morning, where
they stated that they could not
find a link between climate
change and the lack of
hurricanes. File that one into
the “climate change only
causes bad things” folder.
____
Doug Bunge +++
‘climate change only causes bad things’
is a falsifiable scientific hypothesis on the greens internal environment.
Thanks. Hans
Wasn’t Katrina supposed to be, “the new normal”?
Yes Katrina was the new normal.
Which means that we have been abnormal for the last 10 years?
@ur momisugly MarkW…makes sense to me!
It’s all our fault that the children aren’t going to know what hurricanes are.
Yeah but, July was hottest July on record!
And Pacific activity is at a record high!
Failed predictions at a record high!
Compared to what record? Certainly not a historically accurate or significant record.
See what Joe has to say about it.
Ssssh, Joe apparently doesn’t know about this – http://www.wunderground.com/hurricane/accumulated_cyclone_energy.asp?basin=ep
Thanks, M White,
Joe Bastardi is always interesting.
http://www.weatherbell.com/saturday-summary-august-22-2015
And don’t forget the weekend rant.
Comparing weather related disaster losses as a percentage of global GDP is okay but makes an assumption that GDP reflects the amount of wealth at risk. Wouldn’t it be better to look at accumulated value, (basically a normalized integration of GDP, less some depreciation factor)? E.G. – If GDP dropped to to one half of the prior year, (which it wouldn’t but…) the expensive buildings along the coastline are still there to be damaged by a hurricane. For whatever damage was done last year, the same damage this year would yield double the proportional value.
Also, one thing that perplexes me is the “Trend Line” on “Days Between Major Hurricanes” – what does it actually mean given that time is not even represented on the chart? If say that trend line was steep either way, what would such steepness portend?
Ten years and not a peep out of Al Gore or Laurie David, or the FSU climate researchers that climbed on the scare bandwagon with hurricane predictions. The truth is waiting, waiting…..
They’re too busy spending/hiding all the cash that lunatics donate to their non-profit foundations.
Note the hurricane graph that stops in 2005.
http://climatecenter.fsu.edu/topics/climate-change
Orig Mike: maybe.
Al Gore actualy donates proceeds of Inconvenient Truth.
Him being such as selfless saint, and all.
Plus the matter of being a manager of a huge investment management firm, Generation Investment Management. With over 6 billion in assets being managed/invested in “socially responsible” investments.
http://www.insidermonkey.com/hedge-fund/generation+investment+management/146
Forecast of Atlantic Seasonal Hurricane Activity and Landfall Strike Probability for 2015
(.pdf, 4 August 2015):
Information obtained through July 2015 indicates that the remainder of the 2015 Atlantic hurricane season will be much less active than the average 1981-2010 season.
We estimate that the remainder of 2015 will have about 2 hurricanes (average is 5.5), 5 named storms (average is 10.5), 19.5 named storm days (average is 58), 8 hurricane days (average is 21.3), 1 major (Category 3-4-5) hurricane (average is 2.0) and 0.5 major hurricane days (average is 3.9). The probability of U.S. major hurricane landfall and Caribbean major hurricane activity for the remainder of the 2015 season is estimated to be well below its long-period average. We expect the remainder of the Atlantic basin hurricane season to accrue Net Tropical Cyclone (NTC) activity approximately 35 percent of the seasonal average. We have maintained our below-average seasonal forecast, primarily due to a strong El Niño that is now firmly entrenched in the tropical Pacific. In addition, vertical wind shear during July was at record high levels in the Caribbean.
From http://hurricane.atmos.colostate.edu/Forecasts/2015/aug2015/aug2015.pdf
Yep, the new normal…
http://www.cnn.com/2005/TECH/science/09/23/hurricane.cycle/
It’s a ‘new era’ of hurricanes
Experts: String of intense storms is part of normal cycle
By Ann O’Neill
CNN
Friday, September 23, 2005; Posted: 3:52 p.m. EDT (19:52 GMT)
(CNN) — Hurricanes aren’t behaving like many of us are used to them behaving. They’re bigger and meaner, and more numerous than many people have seen.
Charley, Frances, Ivan and Jeanne tore up parts of Florida last year. After tweaking Florida, Katrina and Rita are wreaking havoc this year along the Gulf Coast from Alabama to Texas.
But don’t rush to blame it on global warming, experts warn.
Max Mayfield, director of the National Hurricane Center in Miami, told a Senate subcommittee on Tuesday that we’re in a period of heightened hurricane activity that could last another decade or two.
[This is another ‘David Socrates’ sockpuppet name. ~mod.]
Does this mean that “Climate Change” decreases the number and severity of hurricanes?
Also, looks like insurance companies will be making more money. – Claim more hurricanes are predicted, raise rates.
Atlantic surface temperature anomalies.
Remember the meeting of Al Gore and the insurance companies about devastation of the future? I wonder how much that has costs the American consumer?
I predict there will be no mention of this in Paris. If cyclones are mentioned, it will be Pacific ones alone.
If this continues, by 2020 our children will not know what a hurricane is.
http://www.climate-debate.com/al-gore-hurricane-katrina-and-global-warming-r4.php
Al Gore: Hurricane Katrina and Global Warming
Concerning Hurricane Katrina and global warming. Given to the National Sierra Club Convention, San Francisco on 9 September 2005.
“…There are scientific warnings now of another onrushing catastrophe. We were warned of an imminent attack by Al Qaeda; we didn’t respond. We were warned the levees would break in New Orleans; we didn’t respond. Now, the scientific community is warning us that the average hurricane will continue to get stronger because of global warming. A scientist at MIT has published a study well before this tragedy showing that since the 1970s, hurricanes in both the Atlantic and the Pacific have increased in duration, and in intensity, by about 50 %. The newscasters told us after Hurricane Katrina went over the southern tip of Florida that there was a particular danger for the Gulf Coast of the hurricanes becoming much stronger because it was passing over unusually warm waters in the gulf. The waters in the gulf have been unusually warm. The oceans generally have been getting warmer. And the pattern is exactly consistent with what scientists have predicted for twenty years…
…Last year we had a lot of stuff. Last year, Japan set an all-time record for stuff: ten, the previous record was seven. Last year the science textbooks had to be re-written. They said, “It’s impossible to have a hurricane in the south Atlantic.” We had the first one last year, in Brazil. We had an all-time record last year for tornadoes in the United States, 1,717 – largely because hurricanes spawned tornadoes. Last year we had record temperatures in many cities. This year 200 cities in the Western United States broke all-time records. Tucson tied its all-time record for consecutive days above 100 degrees. Reno, 39 days consecutively above 100 degrees.
The scientists are telling us that what the science tells them is that this – unless we act quickly and dramatically – that this, in Churchill’s phrase, is only the first sip of a bitter cup which will be proffered to us year by year until there is a supreme recover of moral health…”
Might as well add that the first south Atlantic hurricane identified was actually back in 1991…Al Gore never seems to be able to get facts straight.
“Last year we had a lot of stuff. Last year, Japan set an all-time record for stuff” – the new English?
There’s also another nonsense statement:
“Last year the science textbooks had to be re-written” – yet another useful little expression from Mr. Gore’s propaganda repertoire.
Science textbooks are of course always being updated. That’s the nature of science!
When will the 20th Century hurricane and storm counts be revised downward?
Temperature anomalies in the North Atlantic. AMO works.
Clearly the low in the north and high-pressure area to the south.
Could you restate that as a sentence?
Meanwhile, real issues with lives and property are at stake in agency operations.
http://www.sciencedaily.com/releases/2015/08/150824212258.htm