Guest Post by Willis Eschenbach
I’ve been ruminating on the continuing misunderstanding of my position that a governor is fundamentally different from simple feedback. People say things like “A governor is just a kind of feedback”. Well, yes, that’s true, and it is also true that a human being is “just a bag full of organic chemicals, minerals, and water“ … but if you want to analyze humans, that’s far from sufficient.
Similarly, a governor is a kind of feedback … but if you want to analyze it, you can’t assume it’s just simple feedback.
For starters, let me offer my definition of a governor. A “governor” is a control system that uses both positive and negative feedback to maintain some system variable near a “set point” value. A common example in our daily lives is the cruise control on your car. It increases or reduces fuel flow (positive and negative feedback) to maintain the vehicle speed near some pre-set value.
I want to illustrate why you can’t analyze a governed system the same way you analyze an ungoverned system. Suppose I have a car, and I start out from a standstill on level ground. As I gradually add more and more gas by slowly pushing down on the gas pedal, the vehicle speeds up. I record the speed and the instantaneous fuel flow, and I get a graph like Figure 1. As is the usual custom, I’ve graphed the independent variable (fuel use) on the horizontal X axis, and the dependent variable (speed) on the vertical Y axis.
 Figure 1. An illustrative graph of automobile fuel use versus speed, with no cruise control. Yeah, yeah, I know the shape of the curve won’t be exactly like that … which is why this is an “illustrative example”. [UPDATE: an alert reader has pointed out that the speed is of course in miles per hour (MPH) and not miles per gallon (MPG) … I can’t be bothered to redo all the graphs, so please just make the appropriate mental substitution.)
Figure 1 shows that the vehicle speed is some kind of function of fuel use. It’s not a straight line because as you speed up, the air drag on the car slows it down. And the drag increases by something like the cube of the speed. So as we add more and more fuel, the effect of each added unit of fuel decreases. You can see that at sixty miles per hour, the car uses 2 gallons of gas per hour.
The takeaway point from this analysis is that in terms of causation, we can see that a change in fuel flow causes a change in speed.
Now, let’s get the car going sixty miles an hour on level ground, turn on the cruise control, and once again measure the speed and the gas. Then, suppose the car goes uphill. It will start to slow down. As soon as it does, the cruise control will react to the reduction in speed by increasing the gas flow to keep the speed near to 60 mph. And when the hill steepens, speed goes down a bit more, and in response the governor further increases the fuel use to keep the speed up.
Then we crest the hill and start down the other side. The car starts to increase speed, and when it gets going faster than 60 mph, in response the cruise control will reduce the fuel flow.
This leads to a very curious situation—vehicle speed goes up as the fuel use goes down, and speed goes down as the fuel use goes up. Figure 2 shows an illustrative graph of the situation .
 Figure 2. An illustrative graph of fuel use versus speed, with a cruise control set for 60 MPH.
I’m sure you can see the problem. If we analyze this situation in the exact same way as we analyzed the situation without the governor, we come to the ludicrous conclusion that if we increase the fuel use, it will reduce the speed of the car.
So how can we understand this change? The key to analyzing this system is to understand that the governor (cruise control) reverses the causation in the system. Without the governor, as mentioned above, a change in fuel flow causes a change in speed.
On the other hand, with the cruise control engaged the exact opposite is true—a change in speed causes a change in fuel flow. And as a result of this reversal of causation, our previous analysis method is useless because it incorrectly assumes that a change in fuel flow causes a change in speed.
But wait, it gets worse. Suppose we start up the car from a standstill as in Figure 1, but then when we get up to 20 mph we set the cruise control for sixty mph. The car will continue to accelerate as in Figure 1, but only until the car gets up to sixty mph. When it gets there, it doesn’t speed up any more. Instead, it takes up the pattern shown in Figure 2. So the complete graph of the run looks like Figure 3:
 Figure 3. An illustrative graph of fuel use versus speed, with a cruise control that is set to 60 MPH just after the car starts moving.
Here we see that in the blue part of the graph, the change in fuel use causes a change in speed … but once it gets up to the set point speed of 60 mph, the causation reverses, and now the red line shows that a change in speed causes a change in fuel use. Note that this reversal does not require any change in the governor settings. When the situation is far from the set point, the causation goes fuel –> speed. But once it reaches equilibrium, causation reverses such that speed –> fuel.
How does this relate to the climate? Well, the underlying climate paradigm is that the forcing controls the temperature, such that a change in forcing causes a change in temperature.
On the other hand, I’ve proposed that there is a natural governing system regulating the temperature of the climate, a major part of which works as follows.
In the tropics, when it is warm, clouds form earlier and reflect away the sun to cut down the solar forcing. And when the tropics are cool, the clouds form later or not at all, which greatly increases the solar forcing.
What that means is that a change in temperature causes a change in forcing.
And that is why I say that the current method of analyzing the climate is totally incorrect, because it assumes the causation is going the opposite direction from what is actually occurring.
In closing, I can do no better than to post up this marvelous cartoon by Josh from five years ago showing my “Thundercloud” governor at work …

Best wishes to all,
w.
As Usual: If you disagree with someone, please quote the exact words you object to so that everyone can know both who you are addressing and just what it is that you disagree with.
Two words: “Snowball Earth”.
Three words: “Tub a guts”. (Gimme’ some mathematical definitions, Dinostratus!)
The climate of science is much more about concepts then math especially if one thinks the GHG effect is bogus.
It’s precisely because math elucidates concepts unequivocally that makes it the language of bona fide science.
Good post. I’ve tried to illustrate what may be happening: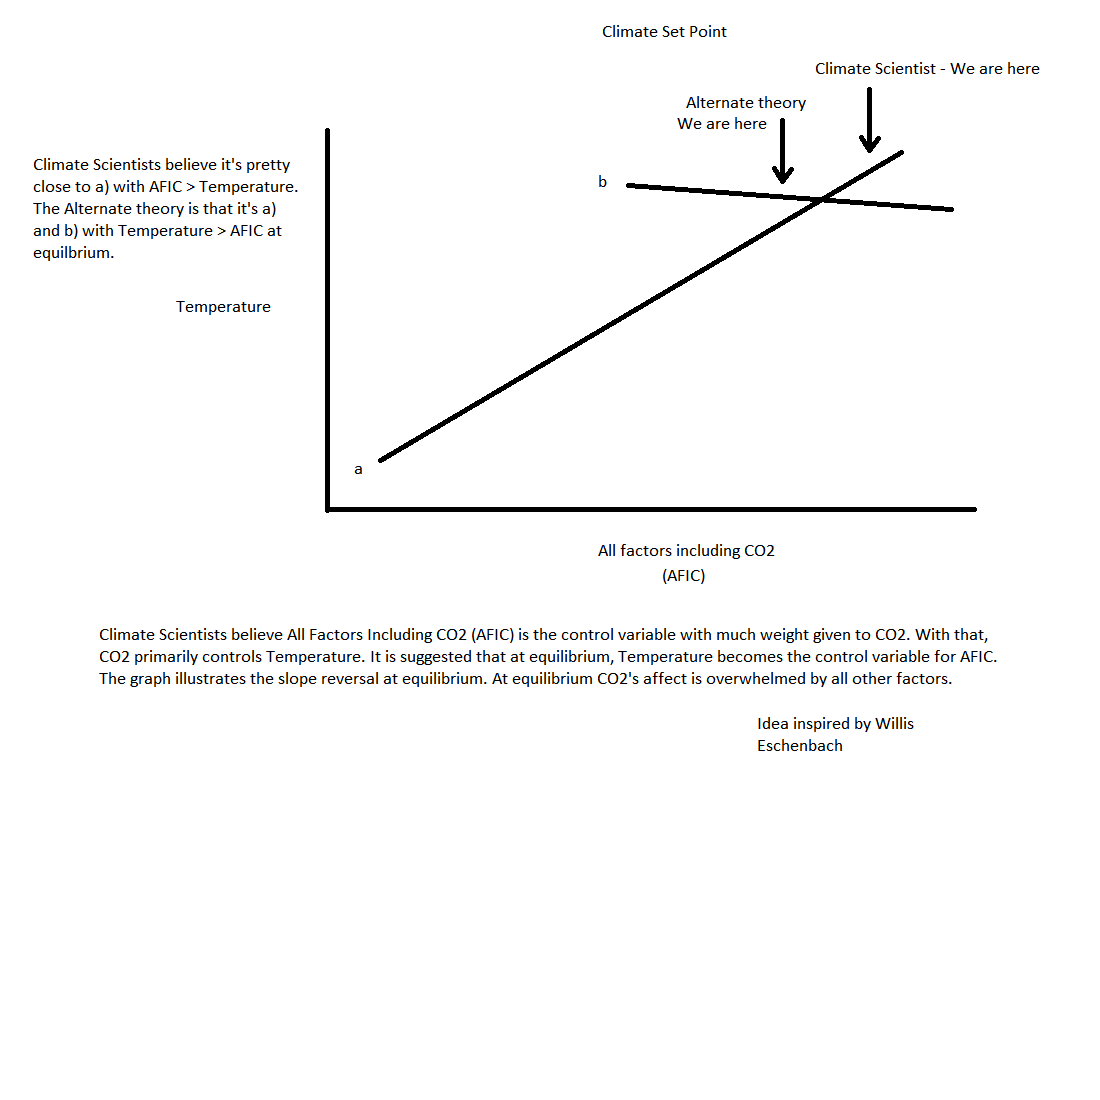
Let’s say CO2 equals Temperature until equilibrium. Then as Eschenbach suggests, there is a slope reversal. Missing a slope reversal if one exists, could be a major thing.
Full post here:
https://chaosaccounting.wordpress.com/2015/08/15/climate-set-point/