Guest Post by Bob Tisdale
This is the first of a series of posts about the impacts of NOAA’s new pause-buster sea surface temperature data on the global temperature products from GISS and NCEI (formerly NCDC). In this post, we’re going to compare the three recent versions of the GISS Land-Ocean Temperature Index from 1979 to 2014, from 1998 to 2014 and from 2001 to 2014.
INTRODUCTION
GISS revised their Global Land-Ocean Temperature Index product yesterday by including NOAA’s new pause-buster ERSST.v4 data as their sea surface temperature dataset of choice. As we discussed in the June global temperature update:
Even though the changes to the ERSST data since 1998 cannot be justified by the night marine air temperature dataset that was used as a reference for bias adjustments (See comparison graph here), GISS also switched from NOAA’s ERSST.v3b sea surface temperature data to the new “pause-buster” NCEI ERSST.v4 sea surface temperature data with their June 2015 update. (For a more detailed discussion of the pause-buster data, see the post here.) The GISS July 15 announcement on their Updates to Analysis page reads (my boldface):
July 15, 2015: Starting with today’s update, the standard GISS analysis is no longer based on ERSST v3b but on the newer ERSST v4. Dr. Makiko Sato created some graphs and maps showing the effect of that change. More information may be obtained from NOAA’s website. Furthermore, we eliminated GHCN’s Amundsen-Scott temperature series using just the SCAR reports for the South Pole.
For those new to the GISS product, GISS also switched sea surface temperature datasets about a year and a half ago, early in 2013, when they discovered the ones (plural) they were using didn’t satisfy their needs…some persons would say their alarmist needs. The sea surface temperature dataset used by GISS before the NOAA ERSST.v3b data was a merger of two sea surface temperature datasets: HADISST data from January 1880 to November 1981 and the satellite-enhanced Reynolds OI.v2 data from December 1981 to present. We discussed that switch in the February 2013 post A Look at the New (and Improved?) GISS Land-Ocean Temperature Index Data.
But, during the recent warming period (starting in 1979) and during the slowdown in global warming (starting in 1998 and in 2001), what are the differences between the three recent versions of the GISS Land-Ocean Temperature Index? I think you may be surprised.
SOURCES
The data for the current (ERSST.v4-based) GISS LOTI product are here. The version that ran from January 2013 to May 2015 can be found in the May (ERSST.v3b-based) GISS LOTI data, archived at the WaybackMachine here. The HADISST/Reynolds OI.v2 version is also available at the WaybackMachine through 2012, but GISS has also updated their land surface temperature data in that time and we also want to extend the data through 2014. So, I used the Map-Making Feature at the GISS website to acquire the HADISST/Reynolds OI.v2-based GISS product…one year at a time. The temperature anomalies are shown in the upper right-hand corner of the maps. It only takes a few minutes to acquire that data that way.
And the source of the sea surface temperature data presented in Figures 2 and 3 is the KNMI Climate Explorer.
FROM 1979-2014, THE WARMING RATES FOR ALL THREE VERSIONS ARE VERY SIMILAR BUT, CURIOUSLY, THE NEW DATA ARE “WARMER”
Figure 1 presents the three versions of the GISS Land-Ocean Temperature Index product for the period of 1979 to 2014. The warming rates are very similar for this multidecadal period. The warming rate of the GISS product with the satellite-enhanced (HADISST/Reynolds-based) sea surface temperature data is only slightly lower than the warming rate of the overcooked pause-buster (ERSST.v4-based) data.
They are all referenced to the same base years (1951-1980), but note how the anomalies are noticeably higher (warmer) in the most recent version (which includes the pause-buster ERSST.v4 sea surface temperature data).

Figure 1
How nice!!! Instead of 2014 being 0.68 deg C above “normal” with last month’s data, GISS can now claim that 2014 was 0.75 deg C above the base period with their magically warmed data. An instant global warming of 0.07 deg C with no muss, no fuss. Isn’t that convenient?!!!
Again, the trends are basically the same from 1979 to 2014, but during that period the new (ERSST.v4-based) data are on average about 0.036 deg C warmer than the former (ERSST.v3b-based) data. And don’t forget to add to that the unjustifiable pause-busting tweaking during the slowdown after 1998.
To see how that upward shift was accomplished, we need to plot the global sea surface temperature anomalies from 1951 to 2014 for the two NOAA datasets. See Figure 2. We’ll exclude the polar oceans as is commonly done to eliminate any influences from sea ice, so we’re looking at the latitudes of 60S-60N. Both datasets use 1951 to 1980 as base years. In the late 1970s, note the upward shift in the ERSST.v4-based pause-buster sea surface temperature anomalies compared to the former ERSST.v3b-based data.

Figure 2
In case you’re having difficulty seeing that, I’ve subtracted the ERSST.v3b sea surface temperature anomaly data from the ERSST.v4 data in Figure 3.

Figure 3
That shift occurs at about 1976/77, coinciding with the Pacific Climate Shift of 1976/77. I’ll try to chase down the location of that shift in a future post.
We’ll now return to the GISS global land+ocean surface temperature data for the rest of this post.
WITH THE NEW PAUSE-BUSTER DATA, 2014 IS ONCE AGAIN 0.02 DEG C WARMER THAN 2010
As you may recall, back in January 2015, alarmists were initially having a field day when GISS announced that global surface temperatures were the highest on record by a 0.02 deg C…yes, a measly two one-hundredths of a deg C. We reported that new “record” in the post here. Then came the announcement, with the uncertainties of the data, that 2014 was “more unlikely than likely” the warmest year, according to NOAA’s phrasing, and the NOAA data back then were showing that 2014 was warmest by 0.04 deg C. We discussed that in the post here.
By the February 2015 GISS data update (see the archived data here), the annual January to December GISS LOTI value had dropped a tick and 2014 was now only 0.01 deg C warmer than 2005 and 2010, making it even less likely that 2014 was warmest with the GISS data.
There’s good news for alarmists with their meaningless statistics: With the switch to the new pause-buster ERSST.v4 data, 2014 is now back on top again by 0.02 deg C. See Figure 4.

Figure 4
Notice also how 2014 was also warmest by 0.02 deg C when the satellite-enhanced (HADISST/Reynolds-based) sea surface temperature data is included in the GISS Land-Ocean Temperature Index. But instead of 2010 being the second-warmest year, it was 2005.
Maybe that’s why GISS switched from the HADISST/Reynolds-based sea surface temperature data to the ERSST.v3b data back in January 2013. They didn’t like 2010 being 0.01 deg C cooler than 2005. That was certainly the case back in 2008, when NOAA removed the satellite-based sea surface temperature from its ERSST.v3 sea surface temperature dataset and created the ERSST.v3b data. With the satellite-based improvements included in the ERSST.v3 data, 2005 was a tick warmer than 2010 in the combined NOAA land-ocean surface temperature data, and NOAA didn’t want that because global warming was supposed to be continuing. See the November 14, 2008 announcement from the three creators of the ERSST.v3 data here.
It’s amazing how politics influences science.
TRENDS DURING THE GLOBAL-WARMING SLOWDOWN
In this section, we’ll compare the warming rates of the three versions of the GISS Land-Ocean Temperature Index for the periods of 2001 to 2014 and 1998 to 2014.
We already know the new pause-buster (ERSST.v4) sea surface temperature data increased the warming rate of the GISS Land-Ocean Temperature Index during the global warming slowdown. But for those needing a visual confirmation, see Figure 5. Including the pause-buster sea surface temperature data doubled the warming rate of the ERSST.v3b-based and HADISST/Reynolds-based GISS LOTI data for the period of 2001 to 2014. Surprisingly, the ERSST.v3b-based and HADISST/Reynolds-based GISS LOTI data had the same warming rates during this period.

Figure 5
But did you know that, for the period of 1998 to 2014, the warming rate of the GISS LOTI product with the satellite-enhanced HADISST/Reynolds-based data had a slightly higher warming rate than the ERSST.v3b-based version, which NOAA used to replace the satellite-enhanced data? See Figure 6.

Figure 6
And of course, the pause-buster (ERSST.v4-based) data have the highest warming rate during this period.
CLOSING
So in addition to the higher warming rate during the global warming slowdown, yesterday’s update to the GISS Land-Ocean Temperature Index also:
- Shifted the surface temperature data upward to make it appear that global warming has had a greater impact, even though the warming rates of the new and older versions of the GISS data are similar from 1979 to 2014, and
- Once again, made 2014 warmer than 2010 by a statistically insignificant 0.02 deg C.
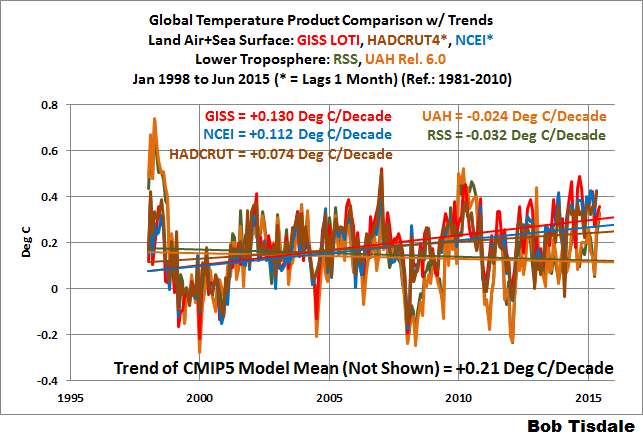
And as a reminder, during the slowdown periods of 1998-2014 and 2001-2014, the warming rate of the GISS land-ocean product with the new pause-buster sea surface temperature data still falls short of the rates predicted by the IPCC’s climate models. See the graphs here and here from the June update.
With a couple more data tweaks from NOAA and GISS, the model-data difference will be gone. It’s all a matter of time.
I’m going to again repeat a statement I made in yesterday’s monthly global temperature update, but instead of linking the graph, I’ll present it as Figure 7:
Even though the changes to the ERSST data since 1998 cannot be justified by the night marine air temperature dataset that was used as a reference for bias adjustments (See comparison graph in Figure 7), GISS also switched to the new “pause-buster” NCEI ERSST.v4 sea surface temperature data with their June 2015 update to their Land-Ocean Temperature Index product. (Also see the post here.)

Figure 7
Its a trap!
The Karl-Madoff method as it will come to be known.
I know you’re a busy guy Bob (obviously) but how does the satellite data look on your plots ?
philincalifornia, assuming you’re asking about lower troposphere temperature data, see yesterday’s monthly update:
https://bobtisdale.wordpress.com/2015/07/15/both-noaa-and-giss-have-switched-to-noaas-unjustifiably-overcooked-pause-busting-sea-surface-temperature-data-for-their-global-temperature-products/
Thanks Bob. Yeah, my schedule made me miss that yesterday.
Bob:
The caption for your final figure says: “HadNMAT2 served as the reference for NOAA’s new ERSST.v4 Dataset, But HadNMAT2 Has a Much Lower Warming Rate Than ERSST.v4 During Hiatus!”
The figure also shows estimates of the linear trend for the period 1998 through 2010.
What are the 5-95% uncertainties on those linear trend estimates? I ask because the caption says HadNMAT2 has a much lower warming rate than ERSST.v4, but is this difference in the trend estimates even statistically significant?
This is similar to the discussion about whether, when also considering uncertainties, 2014 was the hottest year on record when compared to other years i.e. is it statistically distinguishable from other warm years (probably not according to your very interesting posting of John Kennedys work http://wattsupwiththat.com/2015/07/13/a-return-to-the-question-was-2014-the-warmest-year/)
Bevan asks, “What are the 5-95% uncertainties on those linear trend estimates?”
The data are linked in the post. If that interests you, feel free to determine them.
it just confuses me…I’m unsure how you come to your conclusion that “HadNMAT2 Has a Much Lower Warming Rate Than ERSST.v4” when you don’t know what the uncertainties are on the data you are using?
Not a single error bar on the data yet again. Remarkable.
paullinsey, treat my posts as “first looks”. When you find something that interests you, feel free to add the error bars, if you elect to carry the examination further.
seconded. where are the error bars / uncertainties Bob?
@Bevan, @paullinsay:
If you were really interested in that you could have looked into the (free accessible) supplement of Karl et al.:
http://www.sciencemag.org/content/suppl/2015/06/03/science.aaa5632.DC1/Karl-SM.pdf
The uncertainty (90% confidence interval) has the same order of magnitude as the trend itself:
new: 1998-2012 (ocean): 0.075 +/- 0.075 °C/decade
old: 1998-2012 (ocean): 0.014 +/- 0.090 °C/decade
I see no pause-buster.
that’s really useful Werner, thank you…
so it looks like the uncertainties on trends in ERSST.v4 (+/- 0.075) encompass the trends in HadNMAT2, meaning that bobs statement that “Has a Much Lower Warming Rate Than ERSST.v4 ” is debunked!
* that “HadNMAT2 Has a Much Lower Warming Rate Than ERSST.v4 ” is debunked!
Bevan, you should ask these questions more often and to anyone who will listen. Ask how accurate data collection and global survey are? This discussions underlay, do we “really” have representational observation at our disposal? If you answer yes to that question, allow a moment for the commenters to help you adjust your perspective. Speaking with confidence as to the puny data we have collected over the years seems a bit silly; if you want to try out a stronger position, try poking holes in the CAGW normative. It’s fun, easy and as a game seems to play on.
@Bevan:
Well, you might be right that there is no statistical significantly difference between both trends.
But you were asking for the significance using the 95% level. I’m pretty sure that the lower bounds of the trends are negative here.
Because of this I see no pause-buster.
> statistical significantly
Upps – should have been “statistically significant”.
Isn’t the S.D. on fabricated numbers nearly infinite?
If you tell a big lie often enough and for long enough, eventually it becomes the truth.
“…eventually it becomes the truth”
Nope. eventually you believe the lie. the truth never changes.
Can someone please direct me to a detailed refutation of Dr Fred Singer as tobacco company shill. I’ve gleaned that it has to do with his analysis of bad science in an article on second hand smoke, but I need details to beat back the Kleinsian zombie herd. Thanks.
Well, just refer to Wikipedia and the links:
https://en.wikipedia.org/wiki/Fred_Singer#Second-hand_smoke
He thinks the case for second hand smoke was over-stated (hard to argue with, actually).
But he hasn’t been paid by anyone to think that. If people had evidence that he had you would have seen it.
It’s actually quite a personal smear as “his father, a heavy smoker, died of emphysema when relatively young”. It may be worth asking them whether they feel good about using such personal attacks on a man and his dead father. They deserve to feel the guilty for their lies.
I don’t have a direct link but you might look here ( http://www.junkscience.com/ ) and here (http://www.sepp.org/ ).
But I doubt if smoking has much to do with the subject of this particular post. (Unless, of course, what they’re smoking accounts for all the changes! 😎
I like the philisophical part of the article above – they remove the poles because that will influence the climate so it’ll be colder than reality is. Its like the NASA Jet Propultion investigation into AGW where they essentially conclude that the models don’t pass heat between the air and oceans, so the air is always 2x hotter than reality.
Which leads to this paradox by Einstein:
No amount of experimentation can ever prove me right; a single experiment can prove me wrong.
” With a couple more data tweaks from NOAA and GISS, the model-data difference will be gone. It’s all a matter of time.”
=====================================
It is painful to watch this disaster happen in slow motion Bob. It really is!
Anthony, it is time to go on the offensive with data on blogs and any other outlets.
This type of, very important, info needs shared more extensively. It is time to get organized and get actionable, or get overwhelmed.
Paris is not far off.
Just sayin folks,,,,,,,,
It is your reasonable access to energy that is at risk. Globally ~~~~~
Think about it……..
Main-stream-media is pretty much locked up by the climate change advocates
Can’t be sold as science so bring on the faith-based groups. Public much more likely to believe church leaders anyway.
Huge rallies may be planned for New York City and Washington in September. Get the young people all worked up about climate, justice, jobs, poverty, etc. to push the UN agenda and COP 21.
But still worth trying to get the truth out to the public.
Well; you’re never going to convert those receiving warmist pay checks or the true believers (Believers have too much invested; Politicians have too many voting believers) I think the pool of people sitting on the fence that would be convinced by contrary data has decided one way or the other. I think there are quite a number of people who are getting alarmist weary, which is why I’m starting to enjoy alarmist claims. The more outlandish the claim the better as far as I’m concerned. Really, we’re that concerned even if butterflies actually moved a few kilometers.
To conclude: I think that humor and sarcasm are very subversive tools. Leaders hate most being laughed at. Josh does a huge job. It’s getting out works like his, my opinion, will slay this beast quickest.
I envision a cartoon of NOAA giving a special parking spot to data adjuster of the month.
If you can’t sell something one way then use other ways.
Sell Climate change as a religious belief! Try contradicting climate change religious beliefs once they are bought by the public.
As I’ve said before, these “scientists” are sawing off the branch they’re sitting on.
They want us to believe that one year was hundredths of a degree warmer than another year, but the difference is the result of adjustments and re-adjustments and re-re-adjustments that amount to changes many times bigger than the difference between one year and another.
In other words, for the past 15-20 years, they haven’t been able to figure out what the temperature has been for the past 15-20 years, but they want us to believe they know what the temperature was 75-125 years ago.
Baloney.
But their stenographers in the mainstream media simply say what they’re told to say, no questions asked. Well, no critical, thoughtful questions.
Regarding: “With the satellite-based improvements included in the ERSST.v3 data, 2005 was a tick warmer than 2010 in the combined NOAA land-ocean surface temperature data, and NOAA didn’t want that because global warming was supposed to be continuing. See the November 14, 2008 announcement from the three creators of the ERSST.v3 data here.” (here at the end is in a link to https://bobtisdale.files.wordpress.com/2015/06/merged-product-v3.pdf, which mentions a 2008 date)
Did NOAA know in 2008 that 2010 would have a temperature spike, and that including the satellite data would cause 2010 to fail to be warmer than 2005?
Has the pause disappeared? See how GISS and Hadcrut4 compare for trends for certain selected dates:
http://www.woodfortrees.org/plot/gistemp/from:1975/plot/gistemp/from:1975/to:2001/trend/plot/gistemp/from:2001/trend/plot/hadcrut4gl/from:1975/plot/hadcrut4gl/from:1975/to:2001/trend/plot/hadcrut4gl/from:2001/trend
When the land stops warming and the sea stops warming and the atmosphere stops warming, the warmists will claim that seeohtoo is causing Mars to heat.
What a bunch of frauds, what they are doing is criminal all on the backs of the taxpayers, with the full support of the government mafia!
Bob writes: “I’ll try to chase down the location of that shift in a future post.”
I have 2 links stored:
http://bobtisdale.wordpress.com/2008/10/26/the-1976-pacific-climate-shift/
http://appinsys.com/GlobalWarming/The1976-78ClimateShift.htm
John F. Hultquist, I just checked and will report it in an upcoming post. The shift in the ERSST.v4 data with respect to the ERSST.v3b data…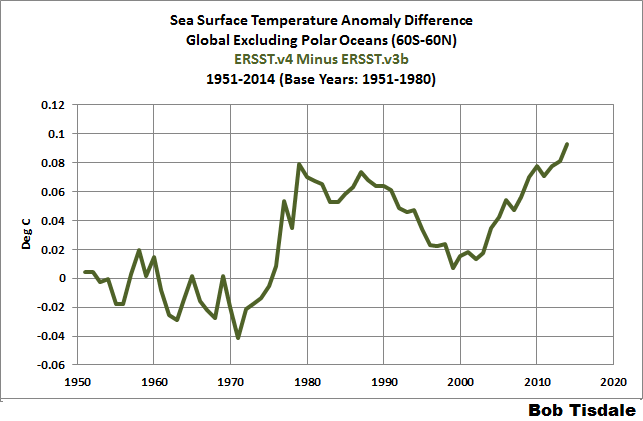
…occurs in all basins. So it’s not necessarily a response to the Pacific Climate Shift.
Bob,
It would be cool to really compare all the basins seperately as well and see if these adjustments are similar to all basins. If yes then you would see a true man made global warming, but not caused by CO2 but by data tampering.
Moreso because of the fact that now more and more European scientists that are following the solar activity are more and more warning about a possible “mini ice age drop” due to plummeting solar activity. their prognose will time it in sync with the AMO+ going to AMO-….
if they are correct, the times of record warm years are counted….
This disaster train of pseudo-science fakery from the Government-run witchdoctor voodoo climate centers will continue until February 2017. At that time, the Republican president will be replacing the Obama droids running those centers.
Expect massive email hard drive failures, unexplained server backups erasures, and mass resignations of the key perps at those centers.
The key is firing “for cause”. Right now they’ve probably got some severance payment locked in. Inhofe’s people should be collecting everything on this scientific fraud for the day of reckoning.
George Orwell might say: “The temperature records are carefully selected and revised by the Ministry of Truth”.
I hope the pendulum of time will swing back soon and kick them into Tartaros.
“We’ve always been at war with Eastasia”;
Hi Bob,
> Even though the changes to the ERSST data since 1998 cannot be justified by the
> night marine air temperature dataset that was used as a reference for bias adjustments
How can you be sure that the night marine air temperatures will NOT be “adjusted”? I would expect this due to “new findings”.
/SARC
So despite all the data fiddling, 2014 isn’t really the warmest year ever. It is even more likely than not to not be the warmest year, but so is every other year. 2014 is merely the year least likely not to be the warmest year ever. Glad we got that sorted out.
The period between 2008-2014 marks 7 consecutive years with above average snow cover in the northern hemisphere, representing the longest span with above average snow on the satellite record: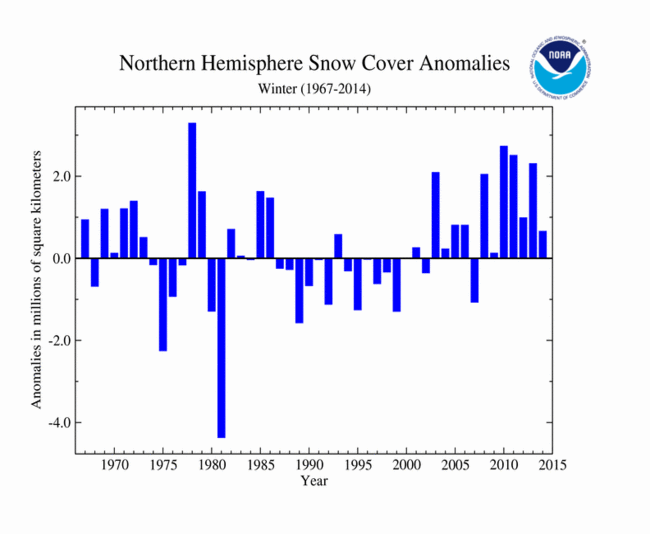
Why is the “Keep Winter Cool” now just a thing of the past?
http://lh4.googleusercontent.com/-sIaHkRvwGYY/VI2HpoiU4mI/AAAAAAAAAkk/WDba-hHREcg/s800/keep-winter-cool.jpg
Did we win the fight? Can we proclaim victory and turn our heat-shields into snowploughs?
They can adjust ad infinitum. The reality de-couple must become ever evident, particularly if temps head south as it has recently been suggested. It gets hard to ‘deny’ recurrent dreadful, miserable, bone penetratingly cold winters and death. But I guess in Ministry of Truth, where no is yes and yes is no, this may be less of a challenge.
There’s always some records being set somewhere, and they will focus on them. Nobody has a clue what a 0.02’C difference feels like so the warm-mongers can keep talking up the catastrophe without fear of contradiction, just pointing at whatever record supports their case today. At present it’s a heatwave in Italy (cows being given cold showers!) and Switzerland which prove global warming. Next week it’ll be something else. Unseasonal cold doesn’t get reported but it’s out there if you search for it.
Is it possible to ‘deadjust’ GISTEMP? I suppose we could subtract .06C from all GISS numbers 2013 onwards and .04C before that. Can ERSST4 be deadjusted?
The ongoing adjustments say:
1. there will be more adjustments in future. this will not be the last.
2. the current records cannot be trusted to make decisions
3. the previous records cannot be trusted to make decisions
thus, conclusions about global warming cannot be trusted, because the temperature record is not accurate. if it was, there would be no need to make adjustments.
+10
since the climate models were trained using the old, incorrect temperature data, they cannot be expected to be accurate going forward. in a non linear system like climate, small error accumulate they do not even out.
as a result, all the climate models will need to be re-calibrated and retrained and their results republished.
n+10
Thanks for the clear view, Bob.
It’s amazing how politics influences science!
I am reminded of other disciplines that have undergone adjustments to this or that collection of observations, solar parameters being one. In the past, one scientist or another would change the formula with added weighting of this or that measure to compensate or adjust in a direction they thought necessary for accuracy, or to better splice one era of observations with another. It was only recently that these various methods were scrutinized, and found to introduce worse discrepancies and artifacts than those that had existed prior to those adjustments. Even then, the necessary corrections to remove these past adjustments has been met with resistance. Even medical science has echoes of this maturation. And that list is incredibly long. Today there are continued echoes related to the search for the cause of Autism. As a special educator I still run into the occasional comment that we are over, or under diagnosing the condition, or that parenting, environmental toxins, educational practices, though not the actual cause, triggers its occurrence or makes autism worse.
I see no reason to think that temperature observations are not on this same path. More worrisome is that in times past, money and/or prestige was not as great an incentive as it is today. Regardless I believe that all scientists in all times, without due diligence in protecting their scientific integrity, the belief that they can save us, and resistance to bias, are as easily convinced of what are actually false positives, as every day folks are. However, patience and individual buyer beware caution will keep this current adjustment at arms length to the voting public. And there will come a time when these new adjustments, using poorly constructed ship methods from the past, will likely be removed.