Guest Post by Willis Eschenbach
I had one of my investigations take a curious turn recently. I was going to use as my springboard the most interesting 2015 paper entitled The Albedo Of Earth, by Graeme L. Stephens et al. However, a strange thing happened along the way. I got to thinking about their Figure 5, in particular Panel (a).:
 Figure 1. This shows Figure 5(a) of Stephens2015. ORIGINAL CAPTION: Annual cycles of (a) the globally averaged albedo … The solid curves are for all-sky fluxes, and the dashed curves are the clear-sky fluxes. The error bars represent the interannual variability. … Annual means of all quantities have been subtracted.
To start with, a few definitions. The “albedo” of a planet, moon, or other celestial object is a number from 0.0 to 1.0 that measures the fraction of solar radiation that is reflected from the surface of the object. It’s often given as a decimal fraction (e.g. 0.30), although I prefer it as a percentage (e.g. 30%). The albedo of the earth is about 0.29, meaning 29% of the sunlight is reflected back to space.
But somehow, their graph didn’t look right to me. I’ve looked at a lot of graphs of the planetary albedo. It’s a curious curve. The maximum albedo occurs on the summer and winter solstices in December and June, when one of the poles are maximally pointed at the sun. At that point, the most ice-covered area is exposed, which makes for a high albedo. In addition, because the snow- and ice-covered area is much larger in the northern hemisphere than in the southern, the December albedo is higher than the June albedo.
And on the other hand, on the equinoxes the sun sees mostly ice-free zones, and so the albedo is lowest around March and September.
The problem is that this means that the two peaks in albedo will be somewhere around the winter and summer solstices (December 21 and June 21) with the two minimum albedo measurements between the two … and their graph shows nothing of the sort. So to see if their graph was correct, I made my own graph using the CERES data. Here’s that result.
 Figure 2. Plot of the albedo from the CERES dataset, March 2000 to February 2014 (14 years).
Note that as expected, the peaks are around the solstices (June and December) with the high peak in December.
To determine which version is correct, the Stephens2015 version or my version, let me offer the following graph from the Encyclopedia of Climate, by Gerald North et al. It shows, not the average, but a single year of the albedo variations of the CERES dataset. However, the albedo varies little from year to year.
 Figure 3. The month-by-month albedo cycle as shown in the Encyclopedia of Climate.
Note that the form of the albedo record in the North book is identical to that of my average shown in Figure 2—it peaks around the summer and winter solstices, is highest in December, and is lowest around the two equinoxes. This is in complete contradiction to the Stephens2015 results shown in Figure 1.
This becomes a significant issue because Stephens et al. use the same graph in a later section of their paper to show how different their results are from the output of many climate models. This is shown in Figure 4 below.
 Figure 4. This shows Figure 11(a) of the Stephens 2015 paper. ORIGINAL CAPTION: The global mean annual cycle of (a) TOA albedo … The solid lines are CERES observations taken from Figure 5, and the colored lines are 10 year average seasonal cycle of individual CMIP5 models, and the dashed lines are the multimodel mean seasonal cycle.
Based on this graph, the authors of Stephens2015 reasonably say:
From the comparisons presented in these figures, it is evident that models and measurements differ in potentially important ways.
Unfortunately, when we put in the correct values for the albedo variations, a very different picture emerges:
 Figure 5. Actual average albedo variations from the CERES data (thick red line) overlaid on Figure 4 (Stephens2015 Fig. 11).
As you can see, while the model average (dotted line) still has problems compared to the red line that shows the CERES albedo variations, at least they generally get the peaks around the solstices (21st of June & December), the low points at the equinoxes, and the larger peak in December.
Now, I noticed this important error back at the end of May, and I was in a bit of a quandary regarding what I should do. In the event, I noted that Peter Webster, an associate of Judith Curry, was one of the authors. Given my respect for Dr. Curry, I didn’t want to blow the whistle on Peter, and I thought I might actually be able to take another path. I didn’t have his email address, so I wrote to Dr. Curry and sent her the above analysis, and I asked her to pass it on to Peter Webster, which she kindly and promptly did.
Dr. Webster was very good about the matter. He responded to me immediately, and said that he had passed my email on to Dr. Stephens because he is the lead author of the paper. So I waited.
After a short while I asked what was happening. Peter said that Dr. Stephens was in England, it would be a week or so. When nothing transpired, I got back in touch with Peter three weeks later. He said that like me, he had heard nothing from Dr. Stephens. Finally, after almost a month and a half had expired with no answer from Dr. Stephens, Peter said that I might as well go ahead and publish, and that I should also send a formal note to Review of Geophysics.
So I am going to take him up on the first half of his suggestion, and any fault in my taking that step is mine alone, not his. I gotta say, this is very frustrating. I tried to do the right thing, even had the backing of one of the co-authors, and I got exactly zip in return. Note that I do not fault Peter Webster in this matter in any way. He has been most responsive and supportive throughout, but his lead author is not replying to the question, which leaves Peter with no options. Ah, well. I’d hoped that a nudge would be as good as a wink to a blind horse, but I guess sometimes that’s not enough, you need a nudge plus a baseball bat.
However, I don’t want to write a dang letter to Rev Geo. I always feel like I have to give myself a lobotomy to write in the black-letter long-paragraph obscurantist style favored by the journals …
So I’ve chosen to make my first (and perhaps only) move by reporting the matter here. At least now, all of the modelers that Stephens claimed were wrong in important ways will know that a) Dr. Stephens was wrong on this particular point, and b) he declined my offer to reveal his mistake himself and correct it in his preferred manner.
We’ll see what comes after that.
Let me add that I think I have acted in this matter with what passes for my best manners. For example, here is what I said to Peter in my earliest emails:
So please take as much time as it needs (within reason) for you to both verify the error, and then decide how you wish to proceed. I am well aware of how difficult it is to be publicly found in error. I’m one of the few bloggers out there with a post entitled Wrong Again.
Let me assume for a moment that your graph is in error, based on my looking at lots and lots of albedo graphs, and based on physics (higher albedo at the solstices when the poles are most exposed to the sun), and based on the Encyclopedia of Climate as I showed, and based on my own calculations shown in Figure 2, and based on the vague but visible similarity to the models.
If that is indeed the case, I’m more than willing to have you and Graeme make the initial announcement, assuming of course that I’m given appropriate credit. I’ll reserve the right to write it up for WUWT if that comes to pass, but you are free to pick the time, place, manner, and content of the announcement.
Like I say, I’ve been there under the spotlight. So I’ll do whatever I can to make it work as best it can for you.
I don’t think I could have been more supportive than that … and I got nothing. People often say something like “Hey, why don’t you write to the authors instead of simply posting your results up at WUWT”. This is one of the many examples of why I’ve generally given up on that approach … it often doesn’t work, and when it doesn’t, it is the source of much delay and frustration.
Despite this error, Stephens2015 is still an interesting paper, don’t let me put you off reading it. I’m sorry that it’s marred by this single problem.
In any case, TGIF, work week’s over. I’ve been up on a scaffolding working on second story windows the last three days, and although I don’t mind the heights, it is still tiring to have to spend the day with the pucker factor up somewhere in the low seventies, safety line or not … I’ll be glad when this part of the job is done.
Regards to all, and my wish is that you get to spend the weekend doing something other than working high up on a scaffolding with your life depending on some overgrown piece of string tying you to safety …
w.
Don’cha Know: If you disagree with someone please have the courtesy to quote the exact words they used. That way we can all be clear exactly what it is that you are objecting to.
Great catch!
The paper itself does not really give a specific provenance for the Fig 5 curves.
They look more like an idealized albedo from a simplified earth, rather than something based on observed data. Too bad, really ,because the paper does give a pretty good summary of the history of albedo determination.
Insignificant. Doesn’t change anything. But still a good example of how blog review trumps selective peer review. Please excuse use of the word “trump”, now a synonym for “egomaniacal, self-promoting clown”.
“Trump”, now a synonym for “truth teller, self-promoting winner”
The fact is he;s shaken up the media, the political left and sturgishooper!
Odd accusation, seems contrary to the facts.
Trump is currently a Democrat posing in “Republican” clothing, acting as a fifth column within the right wing; and may eventually run on a third party ticket as a spoiler for the GOP’s candidate for president.
A couple of years ago, I discovered a decimal mistake in the RMS uncertainty in the TOA budget in Figure 1 of Graeme Stephens’ 2012 paper, “An update on Earth’s energy balance in light of the latest global observations” Nature Geosci. 5, 691.
It’s written as ±0.4 Wm^-2, but should be 4 Wm^-2 (making the TOA imbalance a very definitive 0.6±4 Wm^-2).
I wrote two polite emails to Dr. Stephens asking him about this, but he never replied. So, don’t take his silence personally, Willis. It may be his policy to not reply to polite critical emails.
Calling that a “decimal mistake” is nice way of putting it but makes it sound insignificant. I’d call it an order of magnitude error. It looks like Dr Stephens is as incompetent as Micky Mann with his Mickey Mouse graphs, and just about a amenable to admitting gross errors when he makes them.
In my experience this par for the course for peer reviewed science. The polite ones that do reply make a half hearted attempt at justifying their mistakes then go into a similar embarrassed silence.
Unless you put a gun to their heads by going through official channels that they can not then ignore, they just clam up and hope it will all go away. They’ve bumped their paper count and got a few citation clicks and that’s all that matters. At least the dean of their faculty sees them as “productive”.
If they goofed it just goes into the ocean of digital dung that is modern peer reviewed literature and no one really cares.
However, Willis’ figure 5 , with the CERES data overlaid is interesting. We’re only looking at a range of a few percent in albedo but that kind of figure is a game changer in terms of climate and attribution. If the models are that far off in reproducing the annual cycle they have no chance at all in telling use impact of CO2 or any other forcing.
Thanks for the thoughts, Mike. The difference in albedo between model average and observations makes a difference of about 2 W/m2, with a monthly error ranging from 0 W/m2 in December to 5.3 W/m2 in August … as you say, they are way off in reproducing the annual cycle.
w.
Willis, may I suggest a different explanation for your data and graphs.
In essence you suggest that Dec albedo is higher (it is) because larger area of northern ice faces the sun. (it does) compared to the june albedo with smaller southern ice facing the sun (it is).
My explanation.
December is closer to perihelion so earth closer to sun at dec solstice, than june solstice.
Ergo the whole earth is warmer around dec solstice than june solstice.
Ergo earth is cloudier (more tropical evaporation) around dec solstice than june solstice.
Earth albedo from cloud cover is far more significant than from ice cover. because :
Ice is there because incoming solar energy is not there (to same extent), so not much solar to reflect from ice, as compared to much larger solar flux to reflect from tropical clouds.
Earth has roughly 60% cloud cover, mostly in tropical high sun areas. Earth’s ice cover is much smaller than its cloud cover and it is in areas which get much less that the tropical solar insolation.
Remember the polar regions are only as warm as they are, because oceanic currents and atmospheric currents convey astronomical amount of energy in the form of heat energy to the poles. Without that heat transport the poles would be very much colder than they are.
Adequate demonstration proof that there is not much solar flux at the poles to be much of a contributor to earth’s total albedo.
It’s the clouds; not the ice.
Well that’s just my opinion of course. Probably 97% will disagree with me.
g
Look at this naive view on the value of peer review:
“Scientific hypotheses are contingent and always open to revision in light of new evidence and theory. In this sense the distinguishing features of scientific enquiry are the search for truth and the willingness to subject itself to critical re-examination. Modern research science conducts this critical revision through processes such as the peer review. At conferences and in the procedures that surround publication in peer-reviewed journals, scientific claims about environmental processes are analysed and held up to scrutiny. Even after publication, findings are further analysed and evaluated.”
“To assess areas of scientific controversy, the peer-reviewed literature is considered and evaluated. Not all papers on a controversial point can be discussed individually in an assessment, but every effort has been made here to ensure that all views represented in the peer-reviewed literature are considered in the assessment process.”
Ref: Contribution from Working Group I on the scientific basis to the fifth assessment report by IPCC;
1.2 Rationale and Key Concepts of the WGI Contribution
This is very significant as a TOA imbalance of 0.6 ± 4 Wm^-2 implies that we can have no real confidence that there is any “missing heat” at all ! Dr Frank, could you perhaps give us more details of your finding. For example, is the correct figure apparent from the text of the Stephens et al 2012 paper with the error simply being a typo ? Or did you have to go back to the data and re-work the calculations yourself to discover the error ? Have you published or attempted to publish this finding in a journal or at a blogsite ?
No need to reply – I’ve just taken a look at the Stephens et al 2012 paper. The error of 0.4 Wm^-2 is inferred from OHC information (which is itself open to debate) whereas the 4.0 Wm^-2 is based on observations of the TOA fluxes.
That’s quite an interesting “policy” for a scientist receiving critical emails providing corrections of factual error.
Indeed.
Don’t bother bending over backwards to avoid imagined etiquette violations. Objecting to the mode of the criticism in order to evade addressing its substance is the last refuge of a charlatan.
Willis,
I think you’re a fat headed punk, but you got brains and a good eye. Good work.
Your friend
R
A “fat headed punk”, I kinda like that just because it is so incongruous with the reality.
Thanks,
w.
Pronounced ‘phat heeded’.
==============
The albedo peaks should be ahead of the solstices, because the coverage of snow and ice in the hemisphere having spring/summer is shrinking.
A followup on myself: I noticed the CERES graph has May having a slightly higher albedo than June. That would make the peak associated with northern summer solstice sometime in the last few days of May. This sounds right to me.
I noticed that albedo is slightly higher in November than in January, which would make the peak on one of the few days before 12/15. This is less leading ahead of the solstice than I expected. I do expect less because the SH has less snow coverage than the NH, but I am surprised at how much less, because SH sea ice varies more annually than NH sea ice coverage. Hemispheric sea ice coverage normally peaks close to or shortly before the spring equinox, and has minimum shortly before the fall equinox.
I think you handled it in an exemplary manner.
What is a ” Pucker factor In the seventies”? Thank willis. I always enjoy your articals. As a fellow nail banger , maybe a post on the epa and their regulations on new construction should be done?
Thanks, John. The infamous “Pucker Factor” is a unit-less index of the amount of tension in your … well … um … let me call it the tension in your fundamental orifice, on a scale from zero (dead) to 100 (bungie-jumping when your ex provided the rubber band).
w.
Willis, should “To determine which version is correct, the Spencer2015 version or my version…” refer to Stephens2015?
Indeed, good catch. Fixed, thanks.
w.
The scariest feeling I ever got working at heights was the realization that I was too comfortable.
Indeed, I quit a job working with explosives the day I realized it no longer frightened me to carry the stuff around.
Nonetheless, in the zone can be productive.
==========
You handled it reasonably well. Perhaps the author has a work style where he put priority on a more formal correction, but he should have let you know that he was examining the issue.
I once found an obviously erroneous illustration, and the obvious correction was immediately made when I pointed it out. There is no general rule for what might happen when an issue is noticed.
He ran out of time and blackboard space to explain it. Give him time, and, heh, blackboard space.
=============
Hi, much talk of albedo from ice, but what about cloud albedo….. immeasurable?
Where’s the word “cloud”? Oh, there it is over on the right side-bar… “WUWT Tag Cloud”. I always thought cloud cover had an affect on albedo deviations. Just surprised to not seeing it mentioned even once in this post and comments.
In fact, surface albedo makes a negligible contribution to total top-of-atmosphere albedo. It is the clouds that are the most important.
Hooray Christopher.
Thanks for jumping in here.
All that ice at the poles is there for a reason. It’s darn cold there because there is not much total solar insolation there; so how much of next to nothing gets reflected is irrelevant, just as you suggest.
And it would be colder still if it wasn’t for the heat transport from the tropics via ocean and air currents.
It’s the clouds; not the ice, and the dec solstice is near perihelion so earth is warmer, thus more clouds.
G
Here’s a suggestion, Willis.
You obviously take advantage of “thinking time” as you go about your varied and entertaining escapades (on land and sea).
So why don’t you invite some of those ‘fabled’ climate oracles who get papers published in obscure journals to come and help you out with your real-world projects, and at the same time time coach them in “Inquisitive Thinking 101”?
I too find I do my best contemplation when I’ve got a shovel or paintbrush in my hands.
“source of much delay and frustration”
What’s the rush?
Good question, John. The answer is that I am interesting in influencing the course of the ongoing climate discussion. The only way to do that is to discuss the issues of the day, not the issues of six months ago. As a result, a delay can mean that the discussion has moved on, and by that time there may be little interest in the topic.
And if it is particularly strong alarmism, there is also the need to block it before it takes root.
So yes, there is indeed a rush.
w.
Of course.
What particularly amuses me, in this rush up to Paree, is that so many papers are being released aimed at countering a critical skeptical argument and so many are being blown up within days if not hours. Now, this may be just my hopes bending my perceptions, but this seems to be an accelerating phenomenon.
Now, if we can only get the blowing up to be before the publication, as the temporal trend suggests may happen, there will be cleansing and progress.
Shall I calculate the curve?
Bxxzzqtrorfus(clang)yyywhenyyyxpalidocious!
Ummm, big error bars, much uncertainty, but not before next year.
==============
Code on request.
=============
I see your point, if this were a non-policy influencing issue it would be much less imperative. Thanks and good job.
Probably less of a rush with this paper, as it indicates that climate models are wrong, thus this paper won’t get any further attention from the believers in climate models. I do agree that it looks like there’s something wrong with this paper, but I also find it hard to believe that such a drastic difference didn’t get closely examined. I look forward to the explanation.
Willis:
A few points you need to consider please.
1. Arctic sea ice albedo changes significantly over the year, as measured during Curry’s and Perovich’s SHEBA year-long on-ice daily measurements.
Jan 1 through Apr 10 = 0.83
Apr 10 through Sep 15: Decreasing from 083 down to a minmum of 0.43 on July 5-July 15, then increasing again back to its fall-winter maximum of 0.83 by the end of Sept. (I use a best-fit equation I vcan you if you want a continuous approximation.
2. Antarctic sea ice also goes “down” slightly during its melt season of Nov-Feb, but not as much. Down from a fall-winter-spring maximum of 0.83 only to 0.75 Dec-Jan, then back up to 0.83 the rest of the year.
3. Arctic sea ice area (or extents) cycles annually significantly from 14.0 Mkm^2 at the end of March, down to a minimum of 3.5-4.0 Mkm^2 in mid-September.
Antarctic sea ice cycles between 3.0 Mkm^2 at minimum in February up to recent record highs of 16-17 Mkm^2 area in September. (Extents are higher if you wish to use those.)
So, do you not need to multiply each month’s total snow + ice area by the monthly albedo to generate the “snow” reflection curve?
Regardless of what the land (snow cover, trees, brush, bushes, and grass) albedo changes, that is.
4. Arctic Land ice + Arctic sea ice >> antarctic combined land and sea ice? Please justify that calculation. The total Antarctic ice (at minimum in mid-February) is 14.0 Mkm^2 land ice + 1.5 Mkm^2 shelf ice + 3.0 Mkm^2 sea ice. At the Antarctic maximum, total ice area, becomes approximately 14.0 + 1.5 + 17 Mkm^2 = 32.5 Mkm^2 total. An area larger than all of the land area south of the equator combined.
5. Antarctic land area = Antarctic land ice area (to 98% accuracy at least) = 14.0 Mkm^2.
Antarctic shelf ice = fixed (plus or minus a trivial Manhattan-sized iceberg or two of course) = 1.5 Mkm^2
total land area = 30% of 510 Mkm^2 total earth’s area = 153 Mkm^2.
So antarctic permanent ice area = 14.0 + 1.5 shelf ice = 10% of the earth’s surface, right?
6. How are they measuring albedo? like from a perfect satellite in a polar orbit, measured perpendicular to the entire spherical surface?
or as if measured from the sun’s perspective, always looking directly away from the sun towards the earth’s centerpoint? If the latter, then the edge of the Arctic and Antarctic total ice area needs to be corrected by latitude of the total ice, doesn’t it?
It seems to me that during summer the polar region receives only small amount of global sunlight.
First reason is polar region is about 14 million square km and rest of sunlit planet is 480 million square km. Or about 1/2 is in sunlight at one time- so 14 million vs 240 million. So polar region a bit more than 5%.
Second reason is if planet was blackbody and airless, but had same tilt as earth, most sunlight would occur in the tropics and tropics is only 40% of surface area. And if increase the latitude from 23 degrees of tropic up to about 35 degree latitude, and so increase the 40% of tropics to about 50% of entire earth surface, then about 80% or more of sunlight goes into this half
of the world. Now, the reason, 50% of world receives much more than 50% of the sunlight, is because most of sunlight is hit surface from sunlight closer to zenith. And rest of world has more of it’s sunlight hitting the surface at lower angle.
So for instance when sun is at 30 degrees above horizon, the sunlight is spread out over more area- or each square meter receives less sunlight.
Or then sun is at low angle, it casts long shadows. So degrees with shadow
twice the length at the height. And when sun even lower one has very long shadows- or sunlight is smeared over more area.
And since the 14 million square km, only has the sunlight at low angle, it’s receiving a lot less than it’s 5% area.
So small area, plus not much sunlight falling on each square km, roughly puts it at 2%, rather than more than 5%.
And then there another aspect. And related to the fact we have atmosphere,
rather blackbody in vacuum.
This is more complicated. First the atmosphere itself reflects a significant amount sunlight.
Or at noon with sun at zenith with clear skies, one gets about 1050 Watt per square. And above the atmosphere the sunlight is about 1360 watts.
Or Wiki:
“If the extraterrestrial solar radiation is 1367 watts per square meter (the value when the Earth–Sun distance is 1 astronomical unit), then the direct sunlight at Earth’s surface when the Sun is at the zenith is about 1050 W/m2, but the total amount (direct and indirect from the atmosphere) hitting the ground is around 1120 W/m”
https://en.wikipedia.org/wiki/Sunlight
So get about 1000 watts of direct sunlight and 1120 watts if add in sunlight diffused by atmosphere. So 1367 – 1120 is 247 watt of which, a large amount
is reflected. So reflected without clouds or snow.
Plus when sun is not at zenith, a clear sky atmosphere reflects more sunlight,
then as compare to zenith.
If look at earth energy budget, Earth doesn’t reflect 240 Watt per square meter average- that’s how much is absorb somehow with about 100 watt
reflected somehow, Starts with about 340 watts and about 100 watts is reflected. But the 340 is from dividing by 4. or 1360 divided by 4. So at noon, zenith clear skies it’s not reflecting 400 watts.
But some significant portion of 247 Watts
that is not direct or indirect sunlight would be reflected in clear skies
Or another way to say this is that when sunlight is not shining on area, that area is not reflecting sunlight. At night the sunlight is not being reflected.
If look at those charts. Say here:
https://en.wikipedia.org/wiki/Earth%27s_energy_budget
It has 77 of the 340.4 being reflected by atmosphere and clouds.
And this one specifies atmosphere reflection:
https://ag.tennessee.edu/solar/Pages/What%20Is%20Solar%20Energy/Earth-Energy-Budget.aspx
As 6% atmosphere, 20% cloud and 4% surface.
So 6% of 1360 watt is 81 watts reflected by atmosphere. So at zenith, clear skies, roughly about 1/3 energy not reaching earth surface is reflected by clear sky. But point is when sun is low angle it’s going thru more atmosphere
and clear sky atmosphere when sun lower angle reflect more sunlight.
So polar region without considering the clouds or snow would have a higher portion of sunlight reflected by sunlight.
Now you don’t need to go to the poles to get sunlight at low angle- it happens
everywhere daily, starting at about 5 pm, or a hour or two before sun set, and an hour or two after sunrise. And this area of low angle sunlight again is much larger area than the polar region.
So take 1/2 of earth, it’s sunlit side. And go back to 35 latitude N and S is half
the world and getting 80% of more of the energy of sunlight. Over 24 hour period this is a large area [510 million km divided by 2] but within a instant of time it’s a small area.
Or 1 latitude is equal to 111 km, 70 time 111 is 7770 km diameter. Or area of
4.74×10^7 km or 47.4 million square km- of a hemisphere of 255 million square. So in the 47.4 million one has less clear atmosphere reflecting sunlight as the area which has 4 times the area. Or per square meter or square km, the +200 million area is reflecting more sunlight per square meter with clear skies Plus it is 4 times larger. So lot of remaining 20% of sunlight is being reflected.
So the smaller area of 7770 km diameter reflects more sunlight because it gets more sunlight. And when add in clouds into this small region, then a lot more sunlight will be reflected per square km of clouds. And conversely per square km of clouds, atmosphere, snow or whatever in the area outside the 7770 km diameter disk with reflect less per square km. Though a higher percent of the 20% remaining sunlight is reflected- by clear sky, clouds, or snow.
Now earth circumference is about 40,000 km. And across a hemisphere is 1/2, 20,000 km.
At equinox the 7770 diameter has 3885 km radius north and south.
And 23 degree latitude is 2553 km from equator, and in summer, the disk shifts 2553 km north or south. Or it’s outer perimeter is 3885 + 2553 km
from the equator. Or in latitude 23 + 35. 58 degrees north or south.
So polar region always stays this “common zone” which reflects most
of the energy which would reach it, if a blackbody in vacuum.
So the 14 million square km is part of the 200 million club, which receives little sunlight and would reflect a lot of it, even if clear skies.
And if add in that it’s cloudy during summer in polar region, and the snow, ice, and water, don’t reflect much of total sunlight reaching Earth.
Or in summary the only Albedo that matters in terms of global temperature
is the Albedo in and near the tropics. Or more precisely the area the sun is centered on at the time it’s lighting the area- ie, centered at equator in fall/spring and tropic of Cancer and Capricorn summer/winter and at noon.
Outside this region is insignificant noise- though the cloud cover in this much larger region is significant warming factor.
We could carefully go through a complicated calculation like this one. Or we could park a satellite at L1 looking back at the Earth and continuously measure it throughout the year to a very high degree of accuracy. I know which I’d rather do. NASA are you listening?
In fact it looks like such a satellite has just arrived at L1.
https://en.wikipedia.org/wiki/Deep_Space_Climate_Observatory
It should give us very accurate data about albedo.
Albedo? Anomaly?
From the paper in question:
Examining the most recent ref cited , Kato, 2009 I found this in Kato 2009, Fig 1.
http://i58.tinypic.com/2r5q9du.jpg
Not sure how he could diverge even from one of his refs.
True dat … my take is that the error is a result of the multi-author nature of many papers. In my experience, when one person looks after something, I can figure that at least there’s someone looking after it.
But when a committee looks after something, far too often there’s no one actually looking after it. Everyone assumes that the other guy is checking, so no one checks.
I say that in part because of how obvious the error was to me, and I have to assume that I’m not unusual in that regard, so it would be equally obvious to anyone who has spent a reasonable amount of time looking at the albedo of Earth. So if they didn’t see the error, my only explanation is that they were depending on the other authors.
I suspect also that that is the reason that despite the paper coming out six months ago, I appear to be one of the first people to have noticed the error. Same thing, most folks assume that the scientist has done the checking. Me, I’m a suspicious SOB, I give everything the hairy eyeball …
That’s my theory, in any case. Thanks for your comment and the graphic.
w.
Willis: I worked in an ‘innovative’ factory once. The innovation was that traditional hierarchy of skills/responsibilities was bad; everybody knowing each job and owning all space was good. It was an unmitigated disaster. When a ‘space’ isn’t owned by someone it is owned by no one. People were paid extra $$$ to learn more skills, which they did with relish. But, they continued to do what they were comfortable with (for more pay) while leaving the entire place a mess every night.
Duh!
I once submitted a report that was over 3 inches thick that required signed approval by each member of the committee before forwarding to the chair. A very important (shall I say key and fundamental to the entire process) chart was not available on the morning of the shipping date, so I included a page with large (24 pt) note that the chart and graph will be fedexed to them before the end of the week. I then had the secretary print up the report for fedex shipping. Later that afternoon, before it was shipped, the charts arrived from printing (this was in the days that the only color Xerox was in the printing department). As it was several hours till the scheduled fedex pickup. I requested that the secretary replace the notes explaining the chart was not available with the actual charts, and went on with my other work. Two weeks later at the approval committee meeting for final approval was my report with all 8 signatures of the review committee. As I was presenting it to the chair, for the final signature after my presentation, I noticed that it still had the note in place of the required charts that were the foundation for the report and needed approval along with the written words in the report. So I can, without question, state that most “reviewers” do not even look through the final report, let alone read or proof reed it.
Isn’t the Kato clear sky curve very similar to his curve above? The difference between this and the all-sky curve in Kato is also very interesting, as it suggests that the major factor in the albedo variation is not ice as you (Willis) suggest, it is clouds if in fact the difference between these two graphs is clouds.
So it could be that they just confused the clear sky curve with the all-sky curve, or else that the cloudiness of the southern ocean suddenly changed during whatever period they are measuring. That might make sense if they were sampling El Nino years heavily. Perhaps this all ties together with Bob Tisdale’s assertion of El Nino regulation of heat going into the southern ocean?
rgb
Thanks, Robert. The curve shapes are kinda similar, but the timing is way different. The Kato curves (panel b) peak in June and December, just as we would expect. The Spencer2015 curves peak in March and October.
w.
Again not Spencer. Cloudy neurons there.
=========
Well, that’s just too dang abrupt. Stephens and Spencer are both innovative cloud experts, as is our pal, here. Honest, I was trying to work something out with clouds passing over a neuro array and interfering with the grid, but couldn’t get there.
This is very difficult stuff to figure out. I’m sadly biased by my near certainty that clouds are the answer. We haven’t even figure out the question, yet.
=============
These are far and away the most sensitive tuner.
=================
Willis
“The maximum albedo occurs on the summer and winter solstices in December and June, when one of the poles are maximally pointed at the sun. At that point, the most ice-covered area is exposed, which makes for a high albedo. In addition, because the snow- and ice-covered area is much larger in the northern hemisphere than in the southern, the December albedo is higher than the June albedo.”
//////////////////
When is the maximum snow extent in the NH?
I doubt tjhat it is around the winter solstice (21st December), and i would guess that it is towards late January/early February. If so (and ignoring patterns in cloudiness which will reflect incoming solar), I would expect to see an albedo peak not in late December but rather late Januray, or even February.
richard verney July 11, 2015 at 2:45 am
Thanks for an interesting question, richard. The albedo peaks represent some kind of mix of winter snow, winter ice, winter clouds, and solar angle. We know when it peaks, so I fear that theories about when it should peak are only as good as their ability to match observations. I fear that your theory doesn’t do that well given that it predicts a peak in late January. I’ve never seen any estimate of the albedo that peaked in late January, regardless of the source. I couldn’t say why that is … I can only report the observations.
Regards,
w.
Good point Willis. I also wonder why people propose something that conflicts with multiple observations. On the other hand, having followed the “climate change wars” now for a decade it seems to be par for the course. Don’t let facts get in the way of our theories or beliefs. Post normal science in any event puts models and theories above evidence, forcing ongoing change of [historic] facts to fit the model predictions.
The high albedo in December is dependent on the ice and snow cover in the southern hemisphere, is it not? The southern ice and snow is melting as ice and snow expands in the north.
In the current study, to predict the solar activity, we explore
the PCs derived from the SBMF measured with the WSO in
cycles 21–23 by using the most advanced Eureqa approach
developed on Hamiltonian principles (Schmidt & Lipson 2009).
We show that the classic proxy for solar activity, averaged
sunspot numbers, is strongly modulated by variations in the
SBMF PCs, allowing us to use the SBMF PCs as new proxies
for the overall solar activity.
Furthermore, by using the Eureqa technique based on a
symbolic regression, we managed to uncover the underlying
mathematical laws governing the fundamental processes of
magnetic wave generation in the Sun’s background magnetic
field. These invariants are used to extract the key parameters of
the PCs of SBMF waves, which, in turn, are used to predict the
overall level of solar activity for solar cycles 24–26.
We can conclude with a sufficient degree of confidence
that the solar activity in cycles 24–26 will be systematically
decreasing because of the increasing phase shift between the
two magnetic waves of the poloidal field leading to their full
separation into opposite hemispheres in cycles 25 and 26. This
separation is expected to result in the lack of their subsequent
interaction in any of the hemispheres, possibly leading ta
decade or two, similar to those recorded in the medieval period.
Using the modulus summary curves derived from the principal
components of SBMF, we predict a noticeable decrease
of the average sunspot numbers in cycle 25 to ≈80% of that in
cycle 24 and a decrease in cycle 26 to ≈40% which are linked
to a reduction of the amplitudes and an increase of the phase
between the PCs of SBMF separating these waves into the opposite
hemispheres. We propose using the PCs derived from
SBMF as a new proxy for the solar activity which can be linked
more closely to dynamo model simulations.
Further investigation is required to establish more precise
links between the dynamo waves generated by both poloidal and
toroidal magnetic fields as simulated in the dynamo models and
the waves in the solar background (SBMF) and sunspot (SMF)
magnetic fields derived with the PC and symbolic regression
analysis presented in the current study which will be the scope
of a forthcoming paper.
The authors thank the WSO staff and directorate for providing
the synoptic maps of the solar background magnetic field for
usage by a general public. We also express our deep gratitude to
the respected referee for very constructive and useful comments
from which the paper has strongly benefited.
http://www.researchgate.net/profile/Valentina_Zharkova/publication/266799418_PREDICTION_OF_SOLAR_ACTIVITY_FROM_SOLAR_BACKGROUND_MAGNETIC_FIELD_VARIATIONS_IN_CYCLES_21-23/links/559fbc8c08ae3dbcbe86d891.pdf?disableCoverPage=true
Possible mechanism, and early falsifiability. What’s not to like?
=========
Willis
Further to my recent post, I set out a plot of NH snow extent.
http://nsidc.org/sites/nsidc.org/files/images/cryosphere/sotc/snow_extent_1967-2013_as.png
From a quick eyeballing of the plot, it appears to peak in late January.
That being the case, why isn’t albedo peaking in late January since (subject to patterns in cloudiness) this is when the areal extent of reflectivity in the NH is surely at its greatest?
Willis
Thanks your comment (July 11, 2015 at 3:19 am) which crossed with my latest comment (July 11, 2015 at 3:19 am).
I am not questioning your summary of the plots that you have reviewed. I do not doubt for one moment that these plots do show that maximum albedo coicides with the winter solstice. I am merely suggesting that I find the proposition that maximum albedo occurs on the winter solstice to be surprising.
I would agree entirely that “The albedo peaks represent some kind of mix of winter snow, winter ice, winter clouds, and solar angle.” Thus snow extent is just one factor (albeit an important one).
Peak Arctic ice is also after the winter solstice, and as one can see from the NSIDC plot for snow extent, maximum snow extent also peaks after the winter solstice and the areal difference between 21st December and late January is quite marked. If snow cover is extending south, one would envisage that cloudiness (the clouds that bring the snow) is also tending to increase in extent (but that is just a guess).
Perhaps the changing solar angle and the face presented to the sun changes more rapidly than increases in ice extent and snow extent occur, but my gut feeling is that that would be surprising.
For example in Europe, the prime skiing areas (French, Austrian, Swiss Alps, the Italian Dolomites, the Spanish Pyreneese) extend quite far south and in recent years rarely is there good skiing conditions until well into January. It would surprise me if the changes in solar angle is faster than the manner in which snow cover extends south.
I have no firm evidence (apart from being able to reference that maximum Arctic ice extent and maximum NH snow cover extent fall in January about a month after the winter solstice), but merely find the proposition that maximum albedo is at the winter solstice a curiosity and that makes me cautionary as to whether the plots are reliable.
Richard, the maximum albedo in December is caused by the Southern Hemisphere ice facing the sun. The NH ice extent in December/January is irrelevant to this peak.
I was thinking the same thing and posed it as a question above. Willis says: “because the snow- and ice-covered area is much larger in the northern hemisphere than in the southern, the December albedo is higher than the June albedo.”
If the snow and ice cover in the NH is greater than in the SH, what’s causing the higher albedo in December? Could there be any relationship to perihelion being in December?
Er, I mean “perihelion being in January” (but it’s getting close to December).
Earth, mid-December, 1972. Looks pretty bright down south.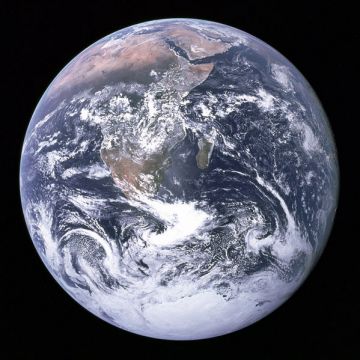
I see my mistake – NH ice/snow extent is such that even though the Arctic is in darkness, sub-arctic regions contribute to albedo in December. The equivalent latitudes in the south are ice-free sea in June, so make no contribution to albedo. So the NH ice extent in Jan/Dec is not irrelevant, though it is a much smaller element of the albedo effect than the SH ice.
Stephens:
Gaia.
http://1.bp.blogspot.com/-LemiCA8B_H4/UfLN63QLXdI/AAAAAAAACyM/Xc3HtckubEg/s400/Animated.gif
Here’s a larger version of this and NH only.
verdeviewer
July 11, 2015 at 10:00 am
Er, I mean “perihelion being in January” (but it’s getting close to December).
Yes the 100 watt difference of the sun should be major a difference.
Or one would detect more reflected.
Though it should have great variation as it’s mostly related to amount of clouds in or near the tropics which is occurring in those months. Or if you average it, them it’s almost all about the increased peak sunlight at Jan 3.
gbaikie, are you saying the additional solar radiation at perihelion increases cloud formation?
— verdeviewer
July 11, 2015 at 10:01 pm
gbaikie, are you saying the additional solar radiation at perihelion increases cloud formation?–
It seems like it could, but I wasn’t saying this.
I was simply saying more watts of sunlight will cause the same km square area of cloud to reflect more light.
For instance Willis Eschenbach has hypotheses that warmer that a day begins in the tropical ocean areas the quicker clouds form- so seems possible if during time of year the sunlight has more watts per square meter, this would tend to cause clouds to begin form earlier in the day.
And also at time of day when sunlight is most intense because it’s closer to zenith.
So in that way perhaps, the additional solar radiation at perihelion increases cloud formation.
Ah, so…
As Judge notes, ice/snow below the Arctic Circle contributes to December albedo.
There is little ice/snow above the Antarctic Circle in June, and solar radiation is near orbital minimum.
Increased solar radiation in December might enhance cloud formation over southern oceans.
Increased solar radiation reflected from both Antarctic and NH ice/snow, and from enhanced southern cloud cover, results in a higher albedo in December than in June.
I wonder how many thousands of photographs they had to pore over to find that one with so little northern hemisphere cloud on the satellite side of the earth in daylight.
And if you look closely at the southern hemisphere, you will see that Antarctica is almost totally cloud covered anyhow. So it is the clouds that are the albedo, not the ice.
The Earth’s albedo is measured. Lots of data. But it seems that climate models calculate albedo. Should it not be an input? Or am I missing something?
Bien sur, mon ami.
Modelers Vs. Observers. It begins.
================
i would say the “measurements” of albedo are probably as accurate as the modeled albedo .
Funny. The wording.
i would say the “modeled” albedo could possibly be as representative as the actual measured albedo.
But as far as I have seen, that would be a long shot possibility. Is that not what this thread is all about?
indeed 🙂 (i hit the post button without checking username last post)
How do you “measure” earth’s albedo over 4 pi steradians all at the same instant.
Can’t be done. And clouds form and dissipate in minutes. Minimum satellite orbital period is 84 minutes; but more like 90 minutes for lowest orbits (sputnik).
More importantly there is NO monitoring network UNDER the clouds, to measure the more important surface insolation over 4 pi steradians all at the same instant.
g