Note: I present this for discussion, I have no opinion on its validity -Anthony Watts
Guest essay by Allan MacRae
Temperature, among other factors, drives atmospheric CO2 much more than CO2 drives temperature. The rate of change dCO2/dt varies ~contemporaneously with temperature, which reflects the fact that the water cycle and the CO2 cycle are both driven primarily by changes in global temperatures (actually energy flux – Veizer et al).
To my knowledge, I initiated in January 2008 the hypothesis that dCO2/dt varies with temperature (T) and therefore CO2 lags temperature by about 9 months in the modern data record, and so CO2 could not primarily drive temperature. Furthermore, atmospheric CO2 lags temperature at all measured time scales.
In my Figure 1 and 2, global dCO2/dt is closely correlated with global Lower Tropospheric Temperature (LT) and Surface Temperature (ST). The temperature and CO2 datasets are collected completely independently, and yet this close correlation exists.
I also demonstrated the same close correlation with different datasets, using Mauna Loa CO2 data and Hadcrut3 ST back to 1958. I subsequently examined the close correlation of LT measurements taken by satellite and those taken by radiosonde.
Earlier papers by Kuo (1990) and Keeling (1995) discussed the delay of CO2 after temperature, although neither appeared to notice the even closer correlation of dCO2/dt with temperature. This correlation is noted in my Figures 3 and 4.
My hypothesis received a hostile reaction from both sides of the fractious global warming debate. All the “global warming alarmists” and most “climate skeptics” rejected it.
First I was just deemed wrong – the dCO2/dt vs T relationship was allegedly a “spurious correlation”.
Later it was agreed that I was correct, but the resulting ~9 month CO2-after-T lag was dismissed as a “feedback effect”. This remains the counter-argument of the global warming alarmists – apparently a faith-based rationalization to be consistent with their axiom “WE KNOW that CO2 drives temperature”.
This subject has generated spirited discussion among scientists. Few now doubt the close correlation dCO2/dt vs T. Some say that humankind is not the primary cause of the current increase in atmospheric CO2 – that it is largely natural. Others rely on the “mass balance argument” to refute this claim.
The natural seasonal amplitude in atmospheric CO2 ranges up to ~16ppm in the far North (at Barrow Alaska) to ~1ppm at the South Pole, whereas the annual increase in atmospheric CO2 is only ~2ppm. This seasonal “CO2 sawtooth” is primarily driven by the Northern Hemisphere landmass, which has a much greater land area than the Southern Hemisphere. CO2 falls during the Northern Hemisphere summer, due primarily to land-based photosynthesis, and rises in the late fall, winter and early spring as biomass decomposes.
Significant temperature-driven CO2 solution and exsolution from the oceans also occurs.
See the beautiful animation below:
In this enormous CO2 equation, the only signal that is apparent is that dCO2/dt varies approximately contemporaneously with temperature, and CO2 clearly lags temperature.
CO2 also lags temperature by about 800 years in the ice core record, on a longer time scale.
I suggest with confidence that the future cannot cause the past.
I suggest that temperature drives CO2 much more than CO2 drives temperature. This does not preclude other drivers of CO2 such as fossil fuel combustion, deforestation, etc.
My January 2008 hypothesis is gaining traction with the recent work of several researchers.
Here is Murry Salby’s address to the Sydney Institute in 2011:
http://www.youtube.com/watch?v=YrI03ts–9I&feature=youtu.be
See also this January 2013 paper from Norwegian researchers:
The Phase Relation between Atmospheric Carbon Dioxide and Global Temperature
Global and Planetary Change, Volume 100, January 2013
by Humlum, Stordahl, and Solheim
http://www.sciencedirect.com/science/article/pii/S0921818112001658
– Changes in global atmospheric CO2 are lagging 11–12 months behind changes in global sea surface temperature.
– Changes in global atmospheric CO2 are lagging 9.5–10 months behind changes in global air surface temperature.
– Changes in global atmospheric CO2 are lagging about 9 months behind changes in global lower troposphere temperature.
– Changes in ocean temperatures explain a substantial part of the observed changes in atmospheric CO2 since January 1980.
– Changes in atmospheric CO2 are not tracking changes in human emissions.
Observations and Conclusions:
1. Temperature, among other factors, drives atmospheric CO2 much more than CO2 drives temperature. The rate of change dCO2/dt is closely correlated with temperature and thus atmospheric CO2 LAGS temperature by ~9 months in the modern data record
2. CO2 also lags temperature by ~~800 years in the ice core record, on a longer time scale.
3. Atmospheric CO2 lags temperature at all measured time scales.
4. CO2 is the feedstock for carbon-based life on Earth, and Earth’s atmosphere and oceans are clearly CO2-deficient. CO2 abatement and sequestration schemes are nonsense.
5. Based on the evidence, Earth’s climate is insensitive to increased atmospheric CO2 – there is no global warming crisis.
6. Recent global warming was natural and irregularly cyclical – the next climate phase following the ~20 year pause will probably be global cooling, starting by ~2020 or sooner.
7. Adaptation is clearly the best approach to deal with the moderate global warming and cooling experienced in recent centuries.
8. Cool and cold weather kills many more people than warm or hot weather, even in warm climates. There are about 100,000 Excess Winter Deaths every year in the USA and about 10,000 in Canada.
9. Green energy schemes have needlessly driven up energy costs, reduced electrical grid reliability and contributed to increased winter mortality, which especially targets the elderly and the poor.
10. Cheap, abundant, reliable energy is the lifeblood of modern society. When politicians fool with energy systems, real people suffer and die. That is the tragic legacy of false global warming alarmism.
Allan MacRae, Calgary, June 12, 2015
CARBON DIOXIDE IS NOT THE PRIMARY CAUSE OF GLOBAL WARMING:
THE FUTURE CAN NOT CAUSE THE PAST
by Allan M.R. MacRae
The Intergovernmental Panel on Climate Change (“IPCC”) stated in its 2007 AR4 report:
Warming of the climate system is unequivocal, as is now evident from observations of increases in global average air and ocean temperatures, widespread melting of snow and ice, and rising global average sea level.
… Carbon dioxide (CO2) is the most important anthropogenic GHG. Its annual emissions grew by about 80% between 1970 and 2004.
… Most of the observed increase in globally-averaged temperatures since the mid-20th century is very likely due to the observed increase in anthropogenic GHG concentrations. It is likely there has been significant anthropogenic warming over the past 50 years averaged over each continent (except Antarctica).
However, despite continuing increases in atmospheric CO2, no significant global warming occurred in the last decade, as confirmed by both Surface Temperature and satellite measurements in the Lower Troposphere (Figures CO2, ST and Figure 1).


Contrary to IPCC fears of catastrophic anthropogenic global warming, Earth may now be entering another natural cooling trend.
Earth Surface Temperature warmed approximately (“~”) 0.7 degrees Celsius (“C”) from ~1910 to ~1945, cooled ~0.4 C from ~1945 to ~1975, warmed ~0.6 C from ~1975 to 1997, and has not warmed significantly from 1997 to 2007.
CO2 emissions due to human activity rose gradually from the onset of the Industrial Revolution, reaching ~1 billion tonnes per year (expressed as carbon) by 1945, and then accelerated to ~9 billion tonnes per year by 2007. Since ~1945 when CO2 emissions accelerated, Earth experienced ~22 years of warming, and ~40 years of either cooling or absence of warming.
The IPCC’s position that increased CO2 is the primary cause of global warming is not supported by the temperature data.
In fact, strong evidence exists that disproves the IPCC’s scientific position. The attached Excel spreadsheet (“CO2 vs T”) shows that variations in atmospheric CO2 concentration lag (occur after) variations in Earth’s Surface Temperature by ~9 months (Figures 2, 3 and 4). The IPCC states that increasing atmospheric CO2 is the primary cause of global warming – in effect, the IPCC states that the future is causing the past. The IPCC’s core scientific conclusion is illogical and false.


There is strong correlation among three parameters: Surface Temperature (“ST”), Lower Troposphere Temperature (“LT”) and the rate of change with time of atmospheric CO2 (“dCO2/dt”) (Figures 1 and 2). For the time period of this analysis, variations in ST lead (occur before) variations in both LT and dCO2/dt, by ~1 month. The integral of dCO2/dt is the atmospheric concentration of CO2 (“CO2“) (Figures 3 and 4).
Natural seasonal variations in temperatures ST and LT and atmospheric CO2 concentrations all considerably exceed average annual variations in these parameters. For this reason, 12 month running means have been utilized in Figures 1 to 4. All four parameters ST, LT, dCO2/dt and CO2 are global averages. ST and LT have been multiplied times 4 in Figures 1 to 4 for visual clarity.
Figure 1 displays the data before detrending, and shows the strong correlation among ST, LT and dCO2/dt. Detrending removes the average slope of the data to enable more consistent correlations, as in Figures 2 to 4. In Figure 3, the atmospheric CO2 curve is plotted with the three existing parameters, and lags these three by ~9 months. This lag is clearly visible in Figure 4, with the CO2 curve shifted to the left, 9 months backward in time.
Figures 5 to 8 (included in the spreadsheet) do not use 12 month running means, and exhibit similar results.
The period from ~1980 to 2007 was chosen for this analysis because global data for LT and CO2 are not available prior to ~1980. This period from ~1980 to 2007 is also particularly relevant, since this is the time when most of the alleged dangerous human-made global warming has occurred.
In a separate analysis of the cooler period from 1958 to 1980, global ST and Mauna Loa CO2 data were used, and the aforementioned ~9 month lag of CO2 behind ST appeared to decline by a few months.
The four parameters ST, LT, dCO2/dt and CO2 all have a common primary driver, and that driver is not humankind.
Veizer (2005) describes an alternative mechanism (see Figure 1 from Ferguson and Veizer, 2007, included herein). Veizer states that Earth’s climate is primarily caused by natural forces. The Sun (with cosmic rays – ref. Svensmark et al) primarily drives Earth’s water cycle, climate, biosphere and atmospheric CO2.
Veizer’s approach is credible and consistent with the data. The IPCC’s core scientific position is disproved – CO2 lags temperature by ~9 months – the future can not cause the past.
While further research is warranted, it is appropriate to cease all CO2 abatement programs that are not cost-effective, and focus efforts on sensible energy efficiency, clean water and the abatement of real atmospheric pollution, including airborne NOx, SOx and particulate emissions.
The tens of trillions of dollars contemplated for CO2 abatement should, given the balance of evidence, be saved or re-allocated to truly important global priorities.
________________________________________________________________________________________
Excerpts from Veizer (GAC 2005):
Pages 14-15: The postulated causation sequence is therefore: brighter sun => enhanced thermal flux + solar wind => muted CRF => less low-level clouds => lower albedo => warmer climate.
Pages 21-22: The hydrologic cycle, in turn, provides us with our climate, including its temperature component. On land, sunlight, temperature, and concomitant availability of water are the dominant controls of biological activity and thus of the rate of photosynthesis and respiration. In the oceans, the rise in temperature results in release of CO2 into air. These two processes together increase the flux of CO2 into the atmosphere. If only short time scales are considered, such a sequence of events would be essentially opposite to that of the IPCC scenario, which drives the models from the bottom up, by assuming that CO2 is the principal climate driver and that variations in celestial input are of subordinate or negligible impact….
… The atmosphere today contains ~ 730 PgC (1 PgC = 1015 g of carbon) as CO2 (Fig. 19). Gross primary productivity (GPP) on land, and the complementary respiration flux of opposite sign, each account annually for ~ 120 Pg. The air/sea exchange flux, in part biologically mediated, accounts for an additional ~90 Pg per year. Biological processes are therefore clearly the most important controls of atmospheric CO2 levels, with an equivalent of the entire atmospheric CO2 budget absorbed and released by the biosphere every few years. The terrestrial biosphere thus appears to have been the dominant interactive reservoir, at least on the annual to decadal time scales, with oceans likely taking over on centennial to millennial time scales.
Excerpt from Ferguson & Veizer (JGR 2007):

Ferguson & Veizer Figure 1
A schematic diagram of the principal drivers of the Earth’s climate system. The connections between the various components are proposed as a hypothesis for coupling the terrestrial water and carbon cycles via the biosphere. Galactic cosmic rays and aerosols are included, although their roles are more contentious than other aspects of the Earth’s climate system.
References and Acknowledgements:
IPCC Fourth Assessment Report, Climate Change 2007, Synthesis Report
http://www.ipcc.ch/pdf/assessment-report/ar4/syr/ar4_syr_spm.pdf
Svensmark et al, Center for Sun-Climate Research, Danish National Space Center, Copenhagen
www.spacecenter.dk/research/sun-climate
Veizer, “Celestial Climate Driver: A Perspective from Four Billion Years of the Carbon Cycle”, GeoScience Canada, Volume 32, Number 1, March 2005
http://www.gac.ca/publications/geoscience/TOC/GACgcV32No1Web.pdf
Ferguson & Veizer, “Coupling of water and carbon fluxes via the terrestrial biosphere and its significance to the Earth’s climate system”, Journal of Geophysical Research – Atmospheres, Volume 112, 2007
http://www.agu.org/pubs/crossref/2007/2007JD008431.shtml
Spencer, Braswell, Christy & Hnilo, “Cloud and radiation budget changes associated with tropical intraseasonal oscillations”, Geophysical Research Letters, Volume 34, August 2007
http://www.agu.org/pubs/crossref/2007/2007GL029698.shtml
McKitrick & Michaels, “Quantifying the influence of anthropogenic surface processes and inhomogeneities on gridded global climate data”, Journal of Geophysical Research – Atmospheres, Volume 112, December 2007 http://www.agu.org/pubs/crossref/2007/2007JD008465.shtml
Considerable insight and/or assistance have been provided by Roy Spencer of University of Alabama, Ken Gregory of Calgary and others.
Conclusions, errors and omissions are the sole responsibility of the writer.
Data sources are gratefully acknowledged:
Surface Temperatures: Climatic Research Unit, University of East Anglia, Norwich, UK
Lower Troposphere Temperatures: The National Space Science and Technology Center, University of Alabama, Huntsville, USA
Atmospheric CO2 concentrations: NOAA Earth System Research Laboratory, Global Monitoring Division, Boulder CO, USA
http://www.esrl.noaa.gov/gmd/ccgg/trends/
CO2 emissions (expressed as carbon): Marland, Boden & Andres, 2007, “Global, Regional, and National CO2 Emissions”, in “Trends: A Compendium of Data on Global Change”, Carbon Dioxide Information Analysis Center, Oak Ridge National Laboratory, U.S. Department of Energy, Oak Ridge, Tenn., U.S.A
http://cdiac.ornl.gov/ftp/ndp030/global.1751_2004.ems
Allan M.R. MacRae, B.A.Sc., M.Eng., is a Professional Engineer.
Copyright January 2008 by Allan M.R. MacRae, Calgary Alberta Canada
mods – sorry – click too soon …
What is astounding here us that nobody – sorry, shouts NOBODY mentions OCO-2 – a direct measuring and purpose built asset for recording atmospheric CO2.which is giving the modelers at NASA the vapours to the point where they’re very obviously obstructing access to data.
Make of that what you will………………………..
I make of that fact what I saw coming when I first heard of OCO-2. I knew that the very basis of modern climate “science” was erroneous and so they would not see what they thought they would see. I am surprised they let us see any data at all. But we all knew the climate models are heifer dust anyway.
@ferdinand meeus: “All known evidence shows that man is causing the increase”.
If by evidence you mean the same ‘evidence’ that has been manufactured to suit a predetermined political agenda, then I would agree.
But surely it can’t be “all known” evidence? Salby alone has provided an abundance of counter-evidence against the proposition that we humans are driving the increase.
To that you could add Tom Quirk, Humlum, Francey, Segalstad, Jaworowski, and many others who disagree for reasons explained thoroughly in the peer-reviewed literature.
Richard,
Some observations are quite solid and global: CO2 levels, δ13C levels, 14C bomb spike decline, oxygen balance,… All of them point to humans as origin of the increase…
Salby and many others, including Allan here again, try to extrapolate the trend in CO2 from the noise around the trend, but in this case it is proven (from the opposite δ13C changes) that the variability around the trend is caused by the influence of temperature on vegetation, but the trend is NOT caused by vegetation, as that is a net, increasing sink for CO2 (proven by the O2 balance), the earth is greening…
So variability and trend have nothing to do with each other: different causes at work. The obvious cause for the variability is temperature variability. The obvious cause for the trend is human burning of fossil fuels…
As they say: even one fact can destroy the nicest theory. In this case all theoretical non-human sources for the CO2 increase fail one to many observations…
“Salby alone has provided an abundance of counter-evidennce…”
Salby, sadly, has produced nothing in terms of evidence. He has produced some hand–waving videos. It seems quite clear at this stage that he is not going to publish anything , even on the internet, that can be scrutinised.
He has generated some discussion , which is useful.
OK Ferdinand – that’s three times you have mischaracterized what I have said here.
Bad boy! No alcohol for you for the remainder of the day!
Mike, I think it’s a little unfair to say that all Salby has contributed nothing more than hand-waving. He has at the very least shown that atmospheric CO2 and human emissions appear to be following different growth-rates (i.e. his 300% argument).
Ferdinand, vegetation might be a net-sink, but I was talking about changes in ocean biology which would also be depelted in C13. Non-biogenic ocean out-gassing would increase dC13 since it has per mil values ranging from -7 to 1.5 but if there were changes in ocean biology, say an increase in the productivity of phytoplankton for example, that would decrease dC13, since the per mil value of phytoplankton is much lower at around -26. I am suggesting that human emissions are not decreasing dC13, indeed they must be to some degree, but a certain percentage of that decrease might be coming from changes in ocean biology.
And my position is not new – this note to Ferdinand posted in 2008.
http://wattsupwiththat.com/2008/12/17/the-co2-temperature-link/#comment-67050
[excerpt]
Hi Ferdinand and Richard,
I think it is safe to say that Ferdinand is convinced that the recent increase in atmospheric CO2 is definitely caused by fossil fuel combustion, while Richard and I regard this point as debatable.
The oco2 Data is freely available here-
ftp://oco2.gesdisc.eosdis.nasa.gov/data/s4pa/OCO2_DATA/
Thanks D.I. – I’d missed that – the directory structures I looked at were linked from the mission pages and near empty…
Time to engage with the gridding API then
“I suggest with confidence that the future cannot cause the past.”
LOL, I should certainly hope so! Mind you, the way climate science is behaving with respect to this debate (i.e. Consensus) anything goes I suppose.
Allan MacRae’s argument is one of the counter arguments to “CO2 does it all”, and a very good one at that. There is also the counter argument that CO2, on net, does not warm the surface at all and cools the atmosphere rather than heats it. However, all skeptics who are paying attention, even the luke-warmers, can see that the alarmists have developed a religious cult that claims they know that CO2 drives the temperatures on earth. (and they will adjust measurements to prove it!)
It is high time all skeptics take a real look at the basic physics of the argument over CO2’s role. The Scottish Skeptic once observed that it may be bad public relations and tactics to look at the issue of CO2 causing warming but in the long run the truth of the matter demands close inspection of the issue.
Some of us believe as we were taught decades ago that the climate of the planet is due to gravity, mass of the atmosphere, conduction, convection, advection, the oceans, H2O in the atmosphere, and of course insolation of energy from our local star. It is all the gasses of the atmosphere plus the ocean that is the “driver” of our climate.
I hope to see more posts on this issue in the future here.
“Some of us believe as we were taught decades ago that the climate of the planet is due to gravity, mass of the atmosphere, conduction, convection, advection, the oceans, H2O in the atmosphere, and of course insolation of energy from our local star. It is all the gasses of the atmosphere plus the ocean that is the “driver” of our climate.”
Good to see that others have the same recollections as me. It was all about the density of trhe atmosphere in those days and any radiative imbalances were corrected by adjustments to convective overturning.
http://www.public.asu.edu/~hhuang38/mae578_lecture_06.pdf
It is true that surface radiative imbalances are compensated for by adjustments to convective and evapotransporation/condensation processes. However, that does not disprove that the atmospheric greenhouse effect is caused by radiation absorbing gases (H2O and CO2 mainly). The extra surface temperature effect is due to the increase in the average altitude where radiation to space occurs, combined with the effective lapse rate, and the fact that the effective temperature of the average location of radiation to space has to radiate the absorbed solar radiation. The increase is due to the fact that convective and evapotransporation/condensation processes do not radiate to space, they simply carry the energy to a greater altitude than the surface, where the energy is transferred to gasses (H2O and CO2 mainly) that then radiate to space. The O2 and N2 do not significantly radiate at temperatures in the atmosphere, so any mechanism that moves energy other than radiation have to be eventually radiated by the H2O and CO2. This argument does not show how much an increase in CO2 will increase surface temperature, since change in water vapor may result in a negative feedback due to cloud changes, and thus average albedo.
replace gravity with gravity collapse. Add: solar variation, solar system orbital variations, ocean circulation, tilt variations, geophysics.
In reply to:
William,
The cult of CAGW sponsored research is so predictable.
The cult of CAGW reduces either the amount of water available at the root of the plant which reduces the amount of available nitrogen or have reduced the natural nitrogen producing bacteria at the root of the plant by the isolating the plants in a greenhouse for the enhanced CO2 experiment. i.e. The cult of CAGW fudges the analysis to get the result(s) they want. (i.e. That CO2, a gas that is essential for life of this planet, is a poison and causes dangerous warming.)
The increase in atmospheric CO2 is unequivocally beneficial for the biosphere due to effect of CO2 on plants and due to the high latitude warming. There has been almost no warming in the tropical region which supports the assertion that cloud cover in the tropics increases or decreases to resist forcing changes. The majority of the warming has been in high latitude regions which has caused the biosphere to expand.
C3 plants (all plants except for grasses) lose roughly 40% of their absorbed water due to trans-respiration. When atmospheric CO2 rises, C3 plants produce less stomata on their leaves (note the optimum CO2 level for plants is 1200 ppm) which reduces the amount of water they lose due to trans-respiration.
The principal source of nitrogen for plants is nitrogen fixing bacteria which live at the root of the plant.
Less stomata on plant leaves results in less water loss which results in more water at the plant roots for the nitrogen fixing bacteria.
http://www.azocleantech.com/details.asp?newsID=4587
http://www.sciencedaily.com/releases/2003/05/030509084556.htm
http://news.nationalgeographic.com/news/2009/07/090731-green-sahara.html
http://www.omafra.gov.on.ca/english/crops/facts/00-077.htm
https://secure.ntsg.umt.edu/publications/2013/BRGT13/BastosJGR2013.pdf
From the paper
>>
[2] Anthropogenic CO2 emissions from fossil fuel burn-
ing and land-use change have been increasing since the
1960s. Each year, about half of anthropogenic emissions
remain in the atmosphere, being the remaining half absorbed
by land and oceans sinks [Le Quéré et al., 2009]. In the
last decades, these sinks presented an increasing strength but
also considerable interannual variability.
>>
So the sinks presented increasing strength. One reason maybe that the strength of the ocean sinks was weakened by ever increasing out gassing. Since the stabilisation of temperatures the ocean sink is comparatively stronger.
It’s always a net absorber, but now absorbing a stronger proportion of emissions that the latter part of 20th c. This is driven on one side by the higher atm CO2 and on the other by the plateau in temperatures:
This is consistent with temp vs dCO2 relationship on inter-annual and decadal scales Some proportion of the steady 2ppm/year is also probably attributable to centennial scale out-gassing.
Mike,
If one assumes that the ocean-atmosphere system is a simple first order equilibrium process, one can calculate the sink rate of the system based on the on the emissions and the overall net sink rate and steady state level for each year based on the SST temperature of that year. Here I have done that for the period 1960-2012 (the last year of the emissions inventory):
http://www.ferdinand-engelbeen.be/klimaat/klim_img/dco2_em6.jpg
Temperature has a high correlation with the CO2 rate of change variability, but has a bad correlation with the trend: the correlation 1975-1995 is even negative and 2000-current is zero to slightly negative, depending of which temperature trend one uses. That is for 35 of the 55 years. The correlation between accumulated human emissions and the increase in the atmosphere on the other side is almost perfect:
http://www.ferdinand-engelbeen.be/klimaat/klim_img/acc_co2_1960_cur.jpg
Which points to a simple linear process which is too slow to coop with the pace of human emissions…
“The correlation between accumulated human emissions and the increase in the atmosphere on the other side is almost perfect:”
Hey Ferdinand. You’ve plotted two cumulative integrals: CO2 and temp ( which is accumulation heat energy ). They are roughly straight lines , so obviously if you scale and shift them of course the correlation is “almost perfect”. It meaningless.
You need to look at the higher derivatives to reveal the variations in the data. And when you do, you see what the relationship is.
No idea what your first graph is about because you don’t explain how you do you calculations and what assumptions you are making. Pretty meaningless just banging up a graph like it proves something.
Again, if you present the calculations that you use to get your 8 ppmv/K it will be clear that it is not valid across all temperatures. You avoid addressing that.
Sorry Mike,
I have plotted one integral: accumulated emissions against direct measurements of CO2 in the atmosphere.
As both are increasing slightly quadratic in the atmosphere, the net sink rate is slightly quadratic increasing too and the net result in the derivative are near straight lines.
Here the plot of the accumulated emissions, temperature and increase in the atmosphere.
http://www.ferdinand-engelbeen.be/klimaat/klim_img/temp_emiss_increase.jpg
That shows that in the 19745-1975 period the temperature was slightly decreasing while emissions increase and CO2 in the atmosphere increases in ratio to the emissions. What also is visible is that the variability of temperature has very little influence on the variability of the CO2 increase in the atmosphere.
Looking at the derivatives of the sum of two influences where one has little influence on the CO2 trend and huge variability and the other shows a huge trend but no measurable variability in the atmosphere doesn’t give you any answer about the cause of the increase in the atmosphere, it only shows the cause of the variability, not of the trend. In this case is looking at the derivatives highly misleading, as the trend is not caused by the same process that causes the variability, the latter has a negative trend (growing vegetation with increasing temperatures).
My plot of the theoretical CO2 rate of change is quite simple: for every year the net sink rate is calculated as the ΔpCO2 between CO2 level measured for that year and the equilibrium level for the temperature of that year (base 290 ppmv in 1900 + 8 ppmv/K), multiplied by the sink factor (2.15 ppmv / 110 ppmv). That is subtracted from the emissions of that year. That is all.
The 8 ppmv/K is what the ice cores show over the past 800,000 years and is in the middle of the range given for Henry’s law for the solubility of CO2 in seawater. The calculation used for the correction of the pCO2 measurements for the change in temperature between seawater inlet and automated equilibration measuring device is here:
(pCO2)sw @ur momisugly Tin situ = (pCO2)sw @ur momisugly Teq x EXP[0.0423 x (Tin-situ – Teq)]
the explanation is at:
http://www.ldeo.columbia.edu/res/pi/CO2/carbondioxide/text/LMG06_8_data_report.doc
Ferdinand…….How come Bart is not commenting here?
Bart doesn’t know what more to say that he hasn’t explained over and over and over again. Ferdinand is still making his same old static arguments. I mean, there are still discussions going on over the pitifully stupid, ignorant, and ridiculous “mass balance” argument. I might as well waste my time trying to teach my dog Latin.
Atmospheric CO2 is set by the ocean interface, and the rate of change of CO2 in the surface oceans is determined by the temperature dependent net imbalance between upwelling and downwelling waters. Human inputs are pitifully small compare to these flows.
That is what is happening. That is what people will eventually realize when emissions and atmospheric concentration have diverged starkly enough from affine similarity. Until then, Ferdinand is a rock star to the lemming contingent, and I have better things to do.
Bart and Ferdinand can agree on one thing: there is no evidence showing any global harm resulting from the rise in CO2. As far as anyone knows, CO2 is completely harmless.
CO2 is also a net benefit to the biosphere, which is measurably greening due to the increase. It is still just a tiny trace gas; within a tenth of a percent, there is no CO2 in the air at all.
The 31,000+ OISM co-signers were correct: CO2 is harmless, and beneficial to the biosphere.
That’s what really matters, no? The climate alarmist contingent is flat wrong when they try to demonize “carbon”. They just can’t admit that what they’ve taught everyone for the past few decades was simply wrong.
Joel,
Bart still hasn’t figured out that the steady state level for the CO2 system between oceans and atmosphere is exactly the same for the dynamic system it is as it is for the equilibrium between a static sample of seawater in a lab and the air above it after some time…
Neither has he figured out that it is impossible to have an observed 4-fold increase rate in the atmosphere (caused by the 4-fold increase of human emissions) with a 3- or 5-fold increase in natural carbon cycle, neither that such an increase would violate about all observations…
Ferdinand, this is as dumb as your unthinking acceptance of the ridiculous “mass balance” argument. In a system in which equilibrium is established by a dynamic imbalance, all that is needed for a change is a net imbalance between input and output. As a result, sensitivities generally have a temporal dependence. And, that is why the sensitivity of atmospheric CO2 to temperature is in ppmv/K/unit-of-time.
There is no doubt about it. It isn’t even a close call. You are wrong.
Bart,
It seems quite difficult for you to accept that a dynamic imbalance not only is influenced by temperature at the ocean side but also by the partial pressure at the atmosphere side. Thus while temperature has a short living ppmv/K/unit of time influence, the resulting in/decrease in the atmosphere reduces the ppmv/K/unit of time until the original in/out fluxes are restored and the end result is in ppmv/K.
Nope. I’ve shown this in exhaustive detail in a post on Dr. Curry’s blog. You are absolutely wrong.
Bart,
Your posts here and at Curry’s only shows that while you may have a lot of knowledge on high frequency processes, you have not the slightest idea how a simple first order dynamic physical process works. It is beyond ridicule that a temperature increase at the upwelling(/downwelling) side would produce a continuous in(/de)creased in(/out)flux of CO2 without response from the increased CO2 pressure in the atmosphere. It is complete nonsense and only shows that you don’t know where you are talking about…
I am extremely well versed, and experienced, in all types of feedback designs, Ferdinand, from those acting on microsecond levels to centuries long.
You are totally out to lunch. If the CO2 content of the surface oceans increases, then the corresponding increase in the atmosphere is ineluctable. The equalizing of partial pressure is precisely the mechanism by which such an increase is enforced. Far from limiting it, it is the cause of it.
Bart,
The fact that you don’t even consider the feedback from the increase of pCO2 in the atmosphere in your formula to an increase in temperature only shows that either you are “forgetting” even the basic rules of feedback control if that is counter your theory, or you have not the slightest experience with that kind of physical/chemical processes.
The influx of CO2 from the upwelling sites is directly proportional to the pCO2 difference between oceans and atmosphere.
The pCO2 of the oceans for a given concentration is governed by temperature at not more than 8 (4-17) μatm/K change. That means that for a change of ~8 ppmv/K in the atmosphere the original influx is restored, all other influences (concentration, upwelling amount, wind speed,…) being constant.
The same happens for an increase in CO2 concentration in upwelling or total upwelling or a combination with temperature: in all cases a change in CO2 level in the atmosphere will counter the change until a new steady state is reached, together with similar – opposite – changes at the downwelling sites.
Think, Ferdinand. If the oceans are becoming more and more enriched with CO2 from upwelling and failure to downwell in equal measure, then the atmosphere will become more enriched, too.
Think a little further Bart:
If the upwelling waters are enriched with CO2, the pCO2 of the oceans will increase and the ΔpCO2 with the atmosphere increases. That results in more influx. The increased influx will result in an increased pCO2 of the atmosphere, which reduces the ΔpCO2 between atmosphere and increased pCO2 of the ocean surface at one side and increases the ΔpCO2 at the sink side. That goes on until a new steady state is reached:
http://www.ferdinand-engelbeen.be/klimaat/klim_img/upwelling_incr.jpg
Even an extreme 10% increase in upwelling, either by total upwelling or concentration (for which is no evidence at all) does level off at some 30 ppmv extra in the atmosphere.
You have a strange idea about CO2 “piling up” at the ocean surface: the pCO2 of the upwelling waters is what is measured as maximum 750 μatm for the temperature (~30°C) at the equatorial surface and the (~40 GtC/year) flux into the atmosphere is proportional to the 750-400 μatm difference between ocean surface and atmosphere.
If there was no more upwelling, the pCO2 of the ocean surface would go down to 400 μatm, even at the equatorial seawater temperature, in equilibrium with the atmosphere and the influx would stop. You need the upwelling to maintain the 750 – 400 μatm pCO2 difference and the resulting influx.
CO2 doesn’t “pile up” at the upwelling zones, it simply gives more influx when the concentration or the temperature or both increase. That is fully compensated for by the increase of pCO2 in the atmosphere after some time.
It would, IF the oceans only had a step in concentration. But, with continuous upwelling of CO2 enriched waters, and reduced downwelling of CO2 due to temperature rise, the ocean concentration is continuously increasing. The atmospheric CO2 will continuously increase as well.
Bart,
Of course there must be a continuous upwelling and a continuous sink of CO2, or there is simply no “steady state” and the ocean-atmosphere system would be in rapid equilibrium (within a year). It is because there is upwelling at high temperatures near the equator and downwelling near the poles that makes that there is a dynamic equilibrium or disequilibrium, depending of the variability of the upwelling and sinks and external factors like human emissions…
But, with continuous upwelling of CO2 enriched waters,… the ocean concentration is continuously increasing.
Sorry, but that is a step too far: a continuous upwelling of CO2 enriched waters has a fixed concentration and thus a fixed pCO2 at a fixed temperature and only gives an initial increased influx of CO2 in the atmosphere if the concentration or temperature or both increased. In all cases that is countered by the increase of CO2 in the atmosphere. CO2 doesn’t pile up at the ocean surface, it is released in ratio to the ΔpCO2 with the atmosphere. If the ΔpCO2 with the atmosphere decreases by the increased pressure in the atmosphere, the CO2 influx get reduced, no matter how much CO2 is in the ocean: that part of CO2 remains in the ocean surface.
Or are you talking about a continuous increasing concentration of CO2 in the upwelling, for which is not the slightest indication (neither for a step in concentration)?
For a fixed ocean upwelling (at a fixed CO2 concentration) and downwelling water flow, a temperature increase will give an increase of 8 ppmv/K CO2 in the atmosphere in a transient response of the dynamic process. That is all.
Game, Set, and hopefully.. Match.
Now, we ought to be able to encourage technological rather than religiose solutions to mankind’s unhealthy overdependency on hydrocarbon fuels ….
TonyN
Please explain what is “unhealthy” in our use of hydrocarbon fuels without which modern medicine would be impossible.
And in what way do we have an “overdependency on hydrocarbon fuels” when the use of hydrocarbon fuels has done more to benefit human kind than anything else since the invention of agriculture and there are no known and sufficient alternatives?
Richard
“I suggest with confidence that the future cannot cause the past.”
That remains to be seen.
Future computer models may indeed show that future lags past, as the models were built on a simple “cart before the horse” strategy. By offsetting the feedback mechanism until it is precisely centered on this moment in time, future catastrophe is avoided… though at great cost… as all flows of energy, appropriation and precious human time, even the apparently unquenchable curiosity of Willis Eschenbach, are stretched around and asymptotically into the singularity of this moment until every statistic becomes a simple gainsay of the central argument… is CO2 lagging behind T?
“Yes it is. No it isn’t. ‘Tis. ‘Tisn’t … … … Ding! Thank you!”
Cheer up everyone! Things may be getting worse at a slower rate.
Similar point made here:
http://www.newclimatemodel.com/evidence-that-oceans-not-man-control-co2-emissions/
It is not necessary to raise the temperatutre of the entire oceans to achieve more CO2 outgassing. Just more sunlight into the water beneath the subtropical high pressure cells will do the trick.
Those cells seem to expand or contract in line with variations in global cloudiness as a result of changes in solar activity via a mechanism that I have set out previously.
The ToA solar constant is 340 (+10.7/- 11.2 footnote 1) W/m^2 as shown on the plethora of popular heat balances/budgets. Collect an assortment of these global energy budgets/balances graphics. The variations between some of these is unsettling. Some consensus. BTW additional RF due to CO2 1750-2011, about 2 W/m^2 spherical, 0.6% of ToA.
In 24 hours the entire globe rotates through the ToA W/m^2 flux collecting heat of 1.43E19 Btu/day
Suppose this heat load were absorbed entirely by:
the air:
Daily temperature rise: 5.25 °F / day
Due to RF of CO2: 0.03 °F, 0.6%.
Obviously the atmospheric temperature is not increasing 5.25 °F per day (1,916 °F per year). There are absorbtions, reflections, upwellers, downwellers, LWIR, SWIR, losses during the night, clouds, clear, yadda, yadda.
the oceans:
Daily temperature rise: 0.00462 °F / day (1.69 °F per year)
How would anybody notice?
by evaporation:
Portion of ocean evaporated: 4.76 ppm/day (1,737 ppm, 0.174%, per year)
More clouds, rain, snow, etc.
Oceans, clouds and water vapor soak up heat several orders of magnitude greater than GHGs put it out. CO2’s RF of 2 W/m^2 is inconsequential in comparison, completely lost in the natural ebb and flow of atmospheric heat flux. More clouds, rain, snow, no temperature rise.
Footnote 1: Journal of Geophysical Research, Vol 83, No C4, 4/20/78, Ellis, Harr, Levitus, Oort
also BSME & PE
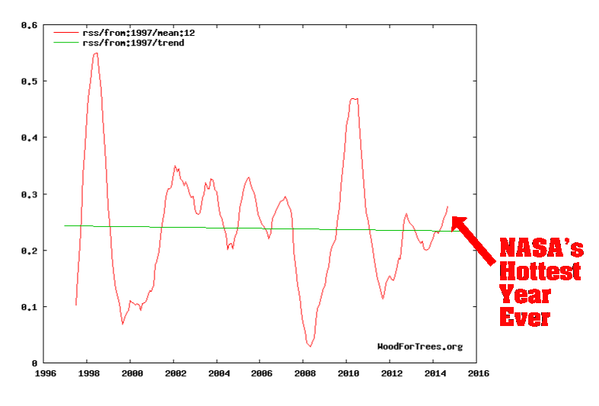
Since Ray is a professional engineer, I would expect him to have ready access to something better than a running mean as a filter. It’s a shame he did not update this work for this post. The data continues to fit well since 2005 and the ‘pause’ in both datasets is interesting.
I think if you are skeptical of the “tipping point” you would have to be skeptical if humans produce co2 could warm the earth at all in the long term.
I’ve linked to my analysis several times on WUWT. Anyone can plot the 12 month change in atmospheric CO2 and the 12 month change in temperature on the same chart. The result is indecipherable, because the series are very noisy. Smooth both with the same filter, say a 12 month moving average, and the data since the start of the Mauna Loa series absolutely screams at you that temperature leads CO2, by a small number of months.
This is exactly what any sane person would expect, as short term temperature rises decrease the solubility of CO2 in the oceans.
This has nothing to do with whether CO2 causes 3.7 Wm-2 extra heat per doubling. That result isn’t seriously challenged.
If anything, this data supports a positive feedback (not captured in ECS) which will raise atmospheric CO2 in the long term as temperatures rise.
http://Www.robles-thome.talktalk.net/carbontemp.pdf
[Link fixed. ~mod.]
RERT
One would also expect to see longer term CO2 responses to naturally induced climate variations such as that from MWP to LIA to date.
It is seriously challenged that our CO2 would necessarily cause 3.7 Wm2 extra ‘heat’ per doubling.
The evidence is that any extra ‘heat’ from GHGs simply distorts the lapse rate slope to the warm side in ascending air and to the cool side in descending air for a zero net effect at the surface.
One needs to know some non radiative meteorology to appreciate that.
RERT – your link does not work.
BTW, it is NOT just “the solubility of CO2 in the oceans.”
Look at the AIRS video.
[Link fixed. ~mod.]
Thanks to mod and RERT.
RERT,
Your link doesn’t work, but besides the “normal” ~8 ppmv/K influence of temperature (4-5 ppmv/K in short term), the oceans can’t give you 110 ppmv (70 ppmv since Mauna Loa started) increase from a 0.6 K temperature increase. That violates Henry’s law for the solubility of CO2 in seawater.
In this case, the short term variability is caused by temperature, but the trend is NOT caused by temperature, it is caused by human emissions, which are twice the observed increase in the atmosphere…
You are correct. There is indubitably a positive gain from temperatures to CO2. If, in turn, there is a net positive gain from CO2 to temperature, then there is a positive feedback of a type which cannot be stabilized merely by T^4 radiation.
Thus, the Earth would have reached a saturation point of high CO2 and temperature eons ago. As it did not, and shows no signs of doing so, there cannot be a net positive gain from CO2 to temperature, i.e., increasing CO2, in the present state of the climate system, does not increase surface temperatures.
“eons ago?”
…
Hasn’t TSI changed over millions of years as our yellow G2V star has evolved?
http://www.robles-thome.talktalk.net/carbontemp.pdf
I’ve tried again with the link.
Stephen –
CO2 lagging temperature long term is consistent with the ice core data which shows 800 year lag quoted between temperature rises and CO2. You can also look at the law dome CO2 record and see CO2 fall during the LIA. Temperature does drive CO2. This says *nothing* in my view about whether CO2 causes greenhouse heating, which I believe it does.
Allan – no, it’s not just the solubility of CO2, but I believe this is a major factor, and a very obvious one.
Ferdinand – I didn’t for a minute suggest that all atmospheric CO2 addition was from temperature changes. But temperature does affect CO2 positively.
Bart – no, there are just other factors which are not identified.
Temperature leading CO2 is just meme which gets attacked because it is in the ‘too complicated’ bucket for the CAGW crowd for their propaganda purposes.
RERT says:
This says *nothing* in my view about whether CO2 causes greenhouse heating, which I believe it does.
I believe it does, too. I say ‘believe’ because I’ve never found any data or charts showing that ∆CO2 is the cause of ∆T. So the global warming effect of CO2 must be too small to measure.
But I have lots of charts like this showing that ∆T causes ∆CO2:
[click in charts to embiggen]
http://www.brighton73.freeserve.co.uk/gw/paleo/400000yearslarge.gif
Here’s a longer time frame:
http://upload.wikimedia.org/wikipedia/commons/8/82/Past_740_kyrs_Dome-Concordia_ice_core_temperature_reconstructions.png
And a much shorter time frame:
The alarmists got causation backward. No wonder their conclusions are wrong.
Stealey, could you please show us the spike in T that caused the CO2 to go from 280 ppm to 400 ppm?
http://lafenergy.org/essays/figs/Co2-temperature-plot.png
Jackson,
Your chart shows a large rise in CO2. But global T has been flat for almost twenty years.
I rest my case. ☺
1) “But I have lots of charts like this showing that ∆T causes ∆CO2:” …
…
Good, please show us the chart that shows the ∆T that has caused the CO2 to go from 280 to 400 ppm.
..
2) “All the available measurements show that T is the cause, and CO2 is the effect.. ”
…
Good, please show us the T that caused the CO2 to go from 280 to 400 ppm.
…
3) “I rest my case.” Why do you rest your case when evidence disproves your “case?” In the past 18 years, you claim “global warming has stopped” That means ∆T is zero for the past 18 years. But in the past 18 years CO2 has risen more than 35 ppm. Why has CO2 not followed T for the past 18 years ?
RERT @ur momisugly June 14, 2015 at 2:03 pm
“…no, there are just other factors which are not identified.”
There may, indeed, be other factors. But the net effect of those other factors would have to be of a sort which made the aggregate feedback negative. The end result is the same – in the present state of the climate system, net influence of CO2 concentration on surface temperatures must be small.
Have we not seen essentially no temperature rise during the past roughly two decades, while CO2 levels rose an additional 33% above what is assumed to be the pre-industrial equilibrium? Mathematically and observationally, AGW is a dud.
Joel D. Jackson @ur momisugly June 14, 2015 at 2:50 pm
“Why has CO2 not followed T for the past 18 years ?”
Because CO2 does not track T. The rate of change of CO2 tracks T. And, it has kept pace quite well for the past 18 years.
http://www.woodfortrees.org/plot/esrl-co2/from:1979/mean:12/derivative/plot/uah/from:1959/scale:0.22/offset:0.14
The arrow of causality is clearly in the direction of temperature driving the rate of change of CO2. When you integrate the rate of change, you get the quantity itself:
http://www.woodfortrees.org/plot/esrl-co2/from:1979/mean:12/plot/uah/from:1959/scale:0.22/offset:0.14/integral/offset:338
Bart, then do you agree with me when I say that Mr Stealey’s statement that ” ∆T causes ∆CO2 ” is incorrect?
…
I am under the impression that ∆CO2 and dCO2/dt are two different things.
Bart, I also have a question for you. In the past 18 years the change in T has been zero.
In the past 18 years the dCO2/dt has been about 2 ppm per year.
…
if dCO2/dt = 2 ppm/yr
and T-Teq = 0
…
What is your constant of proportionality for the past 18 years?
Jackson,
I said I rest my case. Since you have now changed the subject to a differnt kind of chart, my points (and charts) stand. Silence is concurrence, as they say.
Now, I’m not sure exactly what you’re angling for, but maybe this will fit the bill:
http://www.co2science.org/education/reports/co2benefits/figures/Figure8.gif
CO2 is harmless, and it is beneficial to the biosphere. More is better, at both current and projected concentrations.
Next, you have a problem, this time with your #2 question. Why don’t you quote my words? Is it because then you can erect your strawman argument, and then argue with that? Or is it because you claim to not cut and paste? Whatever the reason, what I said was that all the available measurements show that T is the cause of the rise in CO2. Got a problem with that? If so, show me a chart that verifies that CO2 is the cause of (non-existent) global warming. Make sure it isn’t the typical alarmist overlay chart. Show causation, like I did. But I don’t think you can.
I explained that there are no measurements for that, like there are for T causing CO2. I also wrote that I *believe* that CO2 is the cause of some minuscule warming. It’s my belief, because there aren’t any charts or measurements that show that, like there are showing that global ∆T is the cause of ∆CO2. I have plenty of those. Ask, and I’ll post more.
That’s hard for you to accept, I can see. Because you folks are always trying to demonoze “carbon”. Why? Because that’s the misinformation you swallowed hook, line and sinker. You believe that CO2 is a problem. But you are incapable of producing any testable measurements to support your belief. It’s your religion.
Yes, I rest my case. You lose, because you cannot produce falsifying information. Try to find a chart contradicting what I showed in the 3 charts above. On time scales from a few years, to hundreds of millennia, ∆T causes ∆CO2. You cannot accept that, because if you did your whole belief system would be in disarray.
It must be hell trying to convince yourself that the most benign century since the MWP has justt passed, and there is still no indication of any runaway global warming, or accelerating sea level rise, or disappearing Arctic ice, or vanishing Polar bears, or any of the other evidnce-free, measurement-free globaloney nonsense you believe in. You just believe, because that’s your new religion. Facts don’t matter. Facts like this just get in your way:
http://4.bp.blogspot.com/-lPGChYUUeuc/VLhzJqwRhtI/AAAAAAAAAS4/ehDtihKNKIw/s1600/GISTemp%2BKelvin%2B01.png
To sum up, the planet is measurably GREENING due to the rise in CO2:
http://www.drroyspencer.com/wp-content/uploads/co2_growth.jpg
Even Scientific American knew that, before it was bought by foreigners with an agenda.
And of course, fossil fuels have been incredibly beneficial:
Current CO2 levels are the lowest they’ve been in geologic history. The biosphere is starved of that harmless, beneficial trace gas, which has been up to TWENTY TIMES (20X) higher in the past — without ever triggering runaway global warming:
http://2.bp.blogspot.com/_cHhMa7ARDDg/SoxiDu0taDI/AAAAAAAABFI/Z2yuZCWtzvc/s1600/Geocarb%2BIII-Mine-03.jpg
But once you start to admit that, skeptics win the debate. Which is all about demonizing CO2 — a trace gas that is every bit as essential for life on earth as H2O.
You’ve painted yourself into a corner: you can’t admit that CO2 is harmless. So you frantically search for anything you can find to claim it’s not good for plants, etc. — as preposterous as that sounds to rational folks. You’re being hopelessly confused by your confirmation bias, rejecting anything that doesn’t support your new religion.
There’s a way out of your conundrum. Just stick with testable evidence and verifiable data and measurements. Answer questions for a change, instead of always asking but never answering. Because if you start answering questions… there goes your belief system. The climate alarmist crowd never wants to answer questions. Your belief is logically and scientifically unsupportable. The Real World is busy falsifying everything you believe:
All the wild-eyed arm waving over a *tiny* 0.7ºC wiggle, over a century and a half, is ridiculous to rational skeptics. It’s crazy, really. That is as close to flat as anything in the temperature record. But that’s what you hang your hat on! You may believe it’s a problem, but to scientific skeptics that just looks silly.
“I also wrote that I *believe* that CO2 is the cause of some minuscule warming. It’s my belief, because there aren’t any charts or measurements that show that, like there are showing that global ∆T is the cause of ∆CO2.” ~ dbstealey
Mr. Stealey, that whole comment from which I quoted a tiny bit was a very good one. I do appreciate you taking the time to interact on this thread, it has been gratifying to see.
I must tell you that I think CO2 does not even cause minuscule warming but we can put that aside for another day and both of us agree there is no measurable warming by CO2 that can be shown. And that, my friend, puts an end to the alarmist claptrap. CO2 as “driver” of climate is a dead end that is preventing mankind from getting on with the job of trying to understand the climate. (or the “weather machine” as we called it back in the day)
T-Teq is not zero, Joel, or David Socrates, or whatever your latest nom de plume is. Only one person could be so dumb as to keep getting that rather important detail wrong, and continue harping on it like he had something useful to say.
Tell me, why exactly do you keep changing your screen name?
Bartemis,
Yeah, that looks like “David Socrates”, doesn’t it?
That would explain a lot. It’s hard to believe someone could be that ignorant of the basics.
=======================
Mark Stoval, thanks for that. I don’t know for certain, but I’ve read the majority of Lindzen’s papers, and I defer to his greater knowledge. Whether CO2 does or doesn’t cause warming is almost exactly the same thing. We can’t tell either way because there are no measurements.
Bart:
Because CO2 does not track T. The rate of change of CO2 tracks T. And, it has kept pace quite well for the past 18 years.
Of course, CO2 does track T with a pi/2 lag on short term, it is a transient function. It has done that for at least 800,000 years, except for the past 160 years, but it still does that for the small variability of CO2 around the human caused trend.
And dCO2/dt tracks dT/dt with a pi/2 lag, which integral gives a small increase of CO2 of ~5 ppmv over the past 55 years.
dCO2/dt tracks T without lag because taking the derivative shifts dCO2/dt pi/2 back in time compared to CO2 and thus synchronizes with T, but that has no physical meaning.
That is gibberish, Ferdinand. Why you insist on writhing through such logical contortions to avoid accepting the obvious is beyond me.
Bart,
The response of CO2 to an increase in temperature of the oceans (or any other liquid) is a transient function, as you can learn from any textbook of physics:
http://www.ferdinand-engelbeen.be/klimaat/klim_img/upwelling_temp.jpg
A step response in temperature will give a fast response in extra CO2 influx at the upwelling zones and reduced outflux at the sink zones. That leads to an increase of CO2 in the atmosphere, which zeroes out when a new steady state is reached at ~8 (4-17) ppmv extra in the atmosphere. Then the increase stops. There is no way that a small permanent offset in temperature against an arbitrary baseline can give a fixed influx of CO2 without reaction from the increased pressure in the atmosphere on the influx and outflux.
It is mathematically proven by Paul_K that a sinusoidal change in temperature for any frequency is followed by sinusoidal change of CO2 with a pi/2 lag, as long as the system response is slow enough, which we may assume in this case:
http://bishophill.squarespace.com/blog/2013/10/21/diary-date-murry-salby.html
second page, 4th comment.
Thus any fixed change in temperature in this dynamic system between oceans and atmosphere gives a fixed change of CO2 in the atmosphere with a lag, as is proven over the past 800,000 years of reliable measurements.
If you take the derivative from the CO2 level, you shift the sinusoid pi/2 back in time, which makes that dCO2/dt changes are in perfect alignment with T changes. That is normal, as T changes are the cause of the initial rise in CO2 rate of change. But integrating T to obtain CO2 has no physical meaning, as CO2 is not the integral of T, it is the transient integration towards the new equilibrium, it is the integral of dT/dt which with some factor will give the amount of extra CO2 in the atmosphere.
dT/dt has no slope and only a slight offset from zero, which gives some 0.6°C increase in the period 1960-2012 when integrated and accordingly some 5 ppmv CO2 extra in the atmosphere. That is all:
http://www.ferdinand-engelbeen.be/klimaat/klim_img/temp_co2_der.png
The whole slope of dCO2/dt is caused by the near twice as high dCO2(em)/dt human emissions over the full period, not by temperature.
No, Ferdinand. Such a high pass response would necessarily produce readily observable phase distortion, which is entirely absent.
This is a dynamic problem. It doesn’t work according to static, textbook formulas. It is static thinking that led you to believe the ridiculous “mass balance” argument. It is static thinking that is defeating you here.
I showed how the relationship can arise back on Dr. Curry’s blog. The surface ocean concentration is dominated by the temperature dependent balance between upwelling and downwelling
dO/dt := k*(T – T0)
and the atmosphere rapidly equilibrates to the ocean
dA/dt := (O – A)/tau + H
where H is human inputs, A and O are atmospheric and surface ocean pCO2, respectively, T is temperature, and T0 is equilibrium temperature. Since tau is short, the contribution of H to A is on the order of H*tau, which is small, and the atmospheric concentration tracks the ocean concentration
dA/dt := k*(T – T0)
It isn’t even a close call. You are wrong. The impact of our emissions on atmospheric concentration is negligible.
And, your plot above isn’t even close to a fit. You have a 90 deg phase difference in the two series.
This is so stupid. Back to teaching the dog Latin.
Stealey says, “I said I rest my case.”
..
Note that Stealy did not answer the question, “Why has CO2 not followed T for the past 18 years ?”
…
Also note that Bart said, “Because CO2 does not track T.
…
Thank you Bart, you have just shown Stealey is wrong to say T causes CO2
Bart:
dO/dt := k*(T – T0)
There we go again, a continuous source of CO2 until eternity from a small fixed change in temperature, without any influence from the increased pressure in the atmosphere. That simply violates all physical laws like Henry’s law…
Since tau is short
tau is ~51 years, not really short. The current pCO2 difference between atmosphere and equilibrium CO2 for the current average ocean temperature is 110 μatm which gives a net sink rate of 2.15 ppmv/year. That gives a tau of 110 ppmv / 2.15 ppmv/year = ~51 years for a linear process, which the ocean-atmosphere seems to be.
Further have you already calculated how there can be a fourfold increase in CO2 rate of change over the past 55 years without a fourfold increase in natural circulation (for which is not the slightest evidence…) if your formula holds any water?
And, your plot above isn’t even close to a fit. You have a 90 deg phase difference in the two series.
Of course it has a pi/2 phase difference, because it must have such a phase difference, as CO2 follows T changes with a pi/2 lag for every frequency without distortion, thus dCO2/dt follows dT/dt with a pi/2 lag…
The transition from T to CO2 is a transient response, which integrates to a new steady state level. That takes time to accomplish.
“… a continuous source of CO2 until eternity from a small fixed change in temperature.”
There are several mechanisms which can arrest the increase in the very long term. This is a non-issue. Local models are used all the time in engineering.
In the current timeline, where the majority of the rise has been observed, the relationship is unequivocal, and it establishes beyond any question that humans are not responsible for the rise.
“…tau is ~51 years, not really short.”
Not at all. This is the time constant of equilibration between the surface oceans and atmosphere. It is very short.
“…because it must have such a phase difference, as CO2 follows T changes with a pi/2 lag for every frequency without distortion, thus dCO2/dt follows dT/dt with a pi/2 lag…”
Gibberish. Just because a system takes time to respond does not mean the phase delay will be 90 degrees. There is only one linear system response which produces a 90 degree phase lag across all frequencies, and that is an integrator.
“That takes time to accomplish.”
And, in the frequency range commensurate with that timeline, there would necessarily be a transition in phase from 90 to zero degrees. We don’t see any such transition. Therefore, any such timeline is much longer than our 57 year data record, and it is adequate during this time to model the process as a pure integrator.
There is no way out of it, Ferdinand. The condition
dCO2/dt = k*(T – T0)
is fully descriptive of the dynamics that have been in place for over 5 decades, during the period in which most of the rise has been observed. The trend in T unequivocally causes the trend in dCO2/dt. Emissions also have a trend. There is little to no room for them. Ergo, emissions are not the driving force.
Bart:
In the current timeline, where the majority of the rise has been observed, the relationship is unequivocal,
The relationship between the variability of temperature and CO2 around the trends and between dT/dt and dCO2/dt is unequivocal, the relationship between the trends in the derivatives is pure fitting of the slopes of two straight lines. That doesn’t say anything about the cause of the trends, where human emissions are at twice the slope of dCO2/dt.
As it is proven beyond doubt that variability and slopes have nothing to do with each other, as caused by different processes, there is not the slightest reason to assume that temperature is the cause of the slope in dCO2/dt.
I know, you don’t accept anything that rejects your theory, but if all observations show that your theory is wrong… I rest my case.
Not at all. This is the time constant of equilibration between the surface oceans and atmosphere. It is very short.
Again, you have no idea where you are talking about. The ocean surface – atmosphere system indeed is fast, but the exchange capacity is limited, due to physical/chemical restrictions of the ocean buffer. In general, a 100% change in the atmosphere gives a 10% change in the ocean surface layer and reverse.
About quantities: the 30% increase in the atmosphere resulted in a 3% increase in the surface layer. For some 1,000 GtC in the ocean surface that means a change of only 30 GtC in the past 160 years.
Thus the ocean surface is not the origin of the changes in the atmosphere, the deep oceans are the main source/sink in the ocean-atmosphere carbon cycle. That system is much slower, as the exchange rate is limited to about 5% of the ocean surface where the deep oceans upwelling and downwelling occurs.
Just because a system takes time to respond does not mean the phase delay will be 90 degrees.
As Paul_K mathematically proved, in the case of a transient response, the response has always a phase lag of pi/2, for whatever frequency, as long as the overall system is relative slow. As the main frequencies are in the 1-3 years range and the overall system response is around 50 years, that seems to be the case.
The condition dCO2/dt = k*(T – T0) is fully descriptive of the dynamics
The real descriptive response of a dynamic system takes into account the response of the process itself, which is from an increased pressure in the atmosphere: dCO2/dt is reduced to zero at the moment that the increase in pressure equals the new steady state:
dCO2/dt = k*(T – T0) – ΔpCO2
where ΔpCO2 is the change in pCO2 since the start of the change.
At the moment that dCO2/dt = 0, ΔpCO2 = k*(T-T0), which is exactly what Henry’s law says.
Take another example:
A basin has an influx and an outflux which are more or less in equilibrium at a steady state level of the basin for a given input. At some moment the influx is increased with a fixed step. According to the same reasoning as yours, the level in the basin will go up at a constant speed without any reaction of the increasing level on the output…
“I rest my case.”
You have no case. The observations do not show I am wrong. They show you are wrong. You cannot reconcile the fact that dCO2/dt = k*(T – T0) with significant human forcing. There is no room for it.
This is a hard requirement. There is no way around it. Your interpretations of other data are, however, subject to alternative explanations.
“…in the case of a transient response, the response has always a phase lag of pi/2…”
Utterly ridiculous. You have no idea what you are talking about. The only system response with a phase lag of 90 degrees across all frequencies is an integrator. Only. Unique. One of a kind.
“dCO2/dt is reduced to zero at the moment that the increase in pressure equals the new steady state:
dCO2/dt = k*(T – T0) – ΔpCO2”
Not possible. There would be a phase distortion at the corner frequency where the phase transitions from -90 deg to 0 deg. There is none evident in 57 years of data. That means, for all practical purposes, any such potential feedback is very small, and can be neglected over our timeline of analysis.
“According to the same reasoning as yours, the level in the basin will go up at a constant speed without any reaction of the increasing level on the output…”
No, that is according to your reasoning. You are the one who thinks a 3% step increase will cause it to go up and up and up, instead of just leveling out 3% higher.
I am the one who is saying, when you plug the drain, the level goes up and up and up.
Bart:
They show you are wrong. You cannot reconcile the fact that dCO2/dt = k*(T – T0) with significant human forcing. There is no room for it.
dCO2/dt is not = k*(T-T0), it is a transient function and not responsible for the bulk of the increase.
Further, you can mix any sinusoid of any frequency with a steady increasing other independent source without any phase distortion:
http://www.ferdinand-engelbeen.be/klimaat/klim_img/matlab_sin_t_co2_slope.jpg
The only system response with a phase lag of 90 degrees across all frequencies is an integrator. Only. Unique.
Bart, I can’t respond on that, as my knowledge in the frequency domain is lacking, but Paul_K has done it: a transient response gives a 90 degrees lag for ALL frequencies as long as the overall system is (much) slower than the frequencies, which is the case for the ocean system, including his graph which shows that for a mix of frequencies. I wait your response to know where Paul_K was wrong:
http://bishophill.squarespace.com/blog/2013/10/21/diary-date-murry-salby.html?currentPage=2#comments
4th comment:
Here is an example where, as the temperature input, I have used two sine cycles of different amplitude and frequency superimposed on a straight line. You can see the temperature input on the graph.
http://img837.imageshack.us/img837/8824/a7uw.jpg
(Mods: there are warnings about that graph’s web site, but access is no problem)
Not possible. There would be a phase distortion at the corner frequency where the phase transitions from -90 deg to 0 deg.
Paul_K’s plot shows no phase distortion at all for a mix of two frequencies + a slope he plotted…
No, that is according to your reasoning. You are the one who thinks a 3% step increase will cause it to go up and up and up, instead of just leveling out 3% higher.
Nice try to reverse the plot…
“Further, you can mix any sinusoid of any frequency with a steady increasing other independent source without any phase distortion:”
NO! The temperature anomaly is not a bunch of sinusoids. It has a very marked trend. For that trend NOT to affect dCO2/dt, you have to filter it out. And, that filtering process would induce marked phase distortion within +/- a decade of frequency of the cutoff frequency.
You have to filter out the trend in temperature in order not to have it affect dCO2/dt. You have to. There is no way out.
That is what your equation
dCO2/dt = k*(T – T0) – ΔpCO2
would do, if the feedback were powerful enough to stop the effective integration of k*(T-T0). The feedback of the CO2 concentration is the equivalent of placing a high pass filter on k*(T – T0) in order to prevent its trend from producing a trend in dCO2/dt.
That high pass filter would have a phase response, which would transition from -90 deg at higher frequencies to 0 deg at lower frequencies, with the transition occurring in the range of +/- a decade of frequency of the cutoff frequency. If such a process were significant on the timelines we are looking at, it would impart a very noticeable phase distortion.
“…a transient response gives a 90 degrees lag for ALL frequencies as long as the overall system is (much) slower than the frequencies…”
Not for ALL frequencies, but for all frequencies well above the cutoff frequency. For frequencies above the cutoff frequency, the phase response approaches -90 deg because – pay attention carefully here – for those frequencies, the system is acting as a pure integrator.
That is the point I have been trying to make to you. If the cutoff frequency were high enough to make any practical difference, we would see the evidence of it in the data. We would see the phase distortion surrounding the cutoff frequency. As we do not see any such phase distortion, any such cutoff is at least a decade lower in frequency than the minimum we can observe over the timeline.
And, what that means is that, for all practical purposes, we are dealing here with a pure integration. The trend we observe in temperature, which has only been around since about a century ago, must be causing the trend we observe in dCO2/dt. It must. There is no way around it.
“Paul_K’s plot shows no phase distortion at all for a mix of two frequencies + a slope he plotted…”
What plot are you looking at? This one? If so, then yes, the trend from the temperature input is not taken out. That’s kind of the point.
To take the trend out, he would have to make the response faster (make the feedback large, i.e., in essence, increasing the frequency of cutoff of the equivalent high pass filtering operation). And, if he made the response faster to do that, then you would start to see the phase distortion.
This is the point, Ferdinand. You’ve got to remove the trend from the temperature series via causal filtering mechanisms such as can take place in the natural world. If you can’t remove it, then it explains the trend in dCO2/dt, and human inputs can’t be the driving force.
But, to remove that trend with causal filtering mechanisms, you would induce an observable phase distortion over the timeline of interest. Since we see no phase distortion, no point at which the phase response suddenly increases from -90 deg to zero as we go down in frequency, we conclude that any cutoff frequency is unobservable in our timeline, and therefore, the system acts like an integrator over that timeline, and the slope in temperature is causing the slope in dCO2/dt.
This, incidentally, is one potential answer to your objection above. The system acts like an integrator over some bounded interval of time, but for longer than that, other feedback kicks in to limit it. For our purposes, it does not matter. Over the modern timeline relevant to determining attribution, it acts like a pure integrator.
There is another potential limiting dynamic that I have been thinking of, but it would be going beyond the scope of this response to you, and I will save it for another day.
“Nice try to reverse the plot…”
How can you not recognize that, adding in human inputs H
dCO2/dt = k*(T – T0) – ΔpCO2 + H
if the feedback of ΔpCO2 prevented k*(T – T0) from integrating, it would do the same for H?
But, this is not how it works. The oceans accumulate the CO2
dO/dt = (k/kh)*(T – T0)
The atmosphere equilibrates to the oceans
dA/dt = (kh*O – A)/tau + H
and A is approximately the integral of k*(T – T0), with a small additional component tau*H from human forcing which is not even of the same polynomial order to match observations for A, and is thereby insignificant.
Shorter excerpt, so the main point does not just get lost in the above:
“…a transient response gives a 90 degrees lag for ALL frequencies as long as the overall system is (much) slower than the frequencies…”
Not for ALL frequencies, but for all frequencies well above the cutoff frequency. For frequencies above the cutoff frequency, the phase response approaches -90 deg because – pay attention carefully here – for those frequencies, the system is acting as a pure integrator.
If the cutoff frequency were high enough to make any practical difference, we would see the evidence of it in the data. We would see the phase distortion surrounding the cutoff frequency. As we do not see any such phase distortion, any such cutoff is at least a decade lower in frequency than the minimum we can observe over the timeline.
And, what that means is that, for all practical purposes, we are dealing here with a pure integration, and we can treat it as such in determining attribution.
Bother. I hate muddying the message.
A 1st order high pass filter generally has +90 deg phase at low frequencies, and 0 deg at higher frequencies. When applied to an integration, with -90 deg across the board, you now have 0 deg at low frequencies, and -90 at higher frequencies.
The shorter excerpt still works, but the longer needs some revisions. Just don’t bother reading it if you can’t figure out the changes for yourself. Maybe I should have avoided bringing in the low pass equivalency to integration + high pass in the first place.
Bart,
The essential error you make is that you start with the assumption that all increase (both in the CO2 levels as in the CO2 rate of change) is caused by temperature.
According to Henry’s law, the transient response of CO2 to temperature is about 8 ppmv/K (long term). The temperature increase over the past 55 years is about linear 0.6°C or in the rate of change that gives an offset of 0.01°C/year or a transient response of 0.08 ppmv CO2/year in offset with zero trend. Human emissions were starting at 1 ppmv/year and are currently at 4.5 ppmv/year and the net increase is measured from 0.5 ppmv/year to current 2 ppmv/year.
Thus indeed, temperature has a slope, but the effect of that slope on CO2 levels and CO2 rate of change is peanuts compared to the effect of what humans added to the atmosphere.
The effect of the huge year by year variability of temperature is hardly visible in the increase of CO2 in the atmosphere. Here for the years with the highest temperature swings: 1992 Pinatubo and 1998 El Niño in Wood for Trees.
For an maximum 8 ppmv/K transient response, the variability (with a pi/2 lag) is already too much: the short term response is only 4-5 ppmv/K. The trend in temperature is good for maximum 2 ppmv extra, while the measured increase was 19 ppmv and human emissions were ~40 ppmv in the same period.
So back to your response:
NO! The temperature anomaly is not a bunch of sinusoids. It has a very marked trend. For that trend NOT to affect dCO2/dt, you have to filter it out.
The influence of the temperature trend is so small as explained here before, that there is no need for any filtering. Thus no phase distortion at all.
What plot are you looking at? This one? If so, then yes, the trend from the temperature input is not taken out. That’s kind of the point.
No need to take the temperature trend out: his response function shows a 1.5 ppmv increase of CO2 for 1.5 K temperature increase. I do grant you 12 ppmv CO2 for 1.5 K increase…
You’ve got to remove the trend from the temperature series via causal filtering mechanisms such as can take place in the natural world. If you can’t remove it, then it explains the trend in dCO2/dt, and human inputs can’t be the driving force.
Again, no removing or filtering necessary, as the influence of temperature is far too low to explain the trend in CO2 and is near zero and has no trend in the derivative.
Thus all your calculations don’t hold as the result of the transient function is maximum 8 ppmv/K and the trend of temperature over the past 55 years gives not more than ~5 ppmv CO2 extra.
`dCO2/dt = k*(T – T0) – ΔpCO2 + H
if the feedback of ΔpCO2 prevented k*(T – T0) from integrating, it would do the same for H?
It does, but as k*(T-T0) is only ~0.08 ppmv/year and H was average 2 ppmv/year (currently 4.5 ppmv/year), the response to the sum of both wipes k*(T-T0) out in a fraction of a year, but even the yearly increase of ΔpCO2 does only reduce H to about half its value…
“The essential error you make is that you start with the assumption that all increase (both in the CO2 levels as in the CO2 rate of change) is caused by temperature.”
No, Ferdinand. I do not start with that assumption. It is what the data tells us. Not “all”, but most.
I was as surprised at it as anyone. But, in science, you start with the data, and then formulate your hypothesis to fit it. You do not start with the hypothesis, and then try to shoehorn the data into fitting it.
“According to Henry’s law…”
Henry’s Law is for a static system in steady state. This is a dynamic system. Every second of every day, new CO2 is coming in, and old CO2 is going out. That produces a temporal dependence in the sensitivity parameter.
The data show that there is an integral relationship
dCO2/dt = k*(T – T0)
Now, you start with that empirical fact, and work on constructing your hypothesis to be consistent with it.
“The influence of the temperature trend is so small as explained here before, that there is no need for any filtering. “
Wrong. You have said yourself that the variability is temperature dependent. In order for the trend in temperature NOT to influence it as well, it has to be filtered out.
“…his response function shows a 1.5 ppmv increase of CO2 for 1.5 K temperature increase…”
His response shows the trend getting through, and producing the trend in the output. You have to remove that trend, or there is no room for any other influence, such as human inputs, to be producing the trend in the output.
“Again, no removing or filtering necessary…”
Again, totally, completely wrong. You have to remove the influence of the temperature trend.
“… but even the yearly increase of ΔpCO2 does only reduce H to about half its value…”
The integrated H. H is a rate of input. Then, it would also reduce the integrated k*(T-T0) by 1/2, because both inputs, in this equation, are on an even level, with the total input being k*(T – T0) + H. They input equally, so their influence on the output must be equally atttenuated. They are about the same magnitude, so now, you have twice the observed level coming out. Obviously, this does not mesh with reality.
“They are about the same magnitude, so now, you have twice the observed level coming out.”
Actually, that is not the case where the feedback is strong, as you demand. The feedback prevents either one from making much of an impact.
You are saying that
CO2 = integral(H)
I am saying that
CO2 = integral(k*(T – T0))
For this equation
dCO2/dt = k*(T – T0) + H – ΔpCO2
if ΔpCO2 is proportional to CO2, say ΔpCO2 = CO2/tau for some time constant tau, the solution is
CO2 = exp(-t/tau)*CO2(0) + convolution(k*(T – T0) + H,exp(-t/tau))
If tau is long, then
CO2 := CO2(0) + integral(k*(T – T0)+H)
but, your claim is that it isn’t long. In that case, the approximate solution is
CO2 = tau*(k*(T – T0) + H)
NOT the INTEGRAL of the two, but just a straight proportionality. That means the output would bear no relationship to either of our prescriptions.
I hate going through this, because I realize you won’t know how to process it. It’s for any lurkers who might get confused by what I have said, and who might be able to understand the correction.
The bottom line is, no, there is no substantial ΔpCO2 feedback which becomes significant over the timeline of interest. The equation has to be of the form
CO2 = integral(F1(k*(T – T0)) + F2(H))
where F1( ) and F2( ) are filter functions. To match observations, one has to be all-pass over observable frequencies, and the other has to be high-pass. Your formulation is that F1 is high-pass, and F2 is all-pass. Mine is the opposite.
Mine is the right one, because there is no phase distortion in the readily observable relationship between temperature and CO2.
Bart:
The data show that there is an integral relationship
dCO2/dt = k*(T – T0)
That is just your imagination: the variability of T and dCO2/dt show a very good relationship, but not even an integral relationship, the transient relationship is between T and CO2 and dT/dt and dCO2/dt.
Moreover while the variability’s fit, the slopes are opposite to each other for 35 years of the 55 years for the simple reason that CO2 variability and CO2 slope and their derivatives are caused by different processes which have nothing in common…
Henry’s Law is for a static system in steady state. This is a dynamic system. Every second of every day, new CO2 is coming in, and old CO2 is going out. That produces a temporal dependence in the sensitivity parameter.
Bart, Henry’s law is for any part of any system at any moment of the day. It is for a flask in a laboratory and for an in-line monitor of seawater pCO2 and for the oceans as a whole. At steady state for any fixed temperature, the influx and outflux of CO2 between oceans and atmosphere are equal. If you change the ocean temperature with 1 K, the new steady state level of CO2 will change with the same value as for the flask in the laboratory and nothing more. That is proven by many million seawater samples taken since Henry invented his law in 1803.
Wrong. You have said yourself that the variability is temperature dependent. In order for the trend in temperature NOT to influence it as well, it has to be filtered out.
Again, no need to filter the temperature trend out: the influence of its variability is on (tropical) vegetation in the order of 4-5 ppmv/K over periods of 1-3 years, which practically zeroes out over that period. The influence of the temperature trend is negative in vegetation: vegetation is a net sink for CO2 over periods longer than 3 years. The trend is positive for the oceans. That is what causes a ~5 ppmv linear trend over the past 55 years and thus a ~0.08 ppmv/year flat offset in dCO2/dt with zero slope.
As variability and offset are caused by the influence of temperature on different, independent processes, there is hardly any influence of the very small offset on the variability.
I think that you are mistaken because you assume that the trend of T causes (most of) the trend of dCO2/dt, which in my opinion is not the case.
His response shows the trend getting through, and producing the trend in the output. You have to remove that trend, or there is no room for any other influence, such as human inputs, to be producing the trend in the output.
Paul_K’s example shows very little trend: 1.5 ppmv for 1.5 K temperature increase and huge variability. In reality the temperature trend is 0.6 K and the resulting CO2 trend 5 ppmv, much “higher” than Paul_K’s example. Thus with or without the trend caused by temperature, there is plenty of room to reach the observed 70 ppmv extra (from 140 ppmv human CO2) in the past 55 years.
Then, it would also reduce the integrated k*(T-T0) by 1/2, because both inputs, in this equation, are on an even level, with the total input being k*(T – T0) + H. They input equally, so their influence on the output must be equally atttenuated. They are about the same magnitude
Sorry, they are not on even level. k*(T-T0) is for a T0 which is ~0.01 K below average T. k*(T-T0) integrates to near zero for the variability and to 5 ppmv for the small offset, while H integrates to ~140 ppmv and ΔpCO2 to ~70 ppmv.
If tau is long, then
CO2 := CO2(0) + integral(k*(T – T0)+H)
Agreed to a certain extent (I still disagree that dCO2/dt directly depends on T-T0, it is a transient function).
As the process response shows, tau is long (~51 years). Where you still go wrong is that T0 is a lot lower than T (implying that it causes most of the increase), while in reality T0 is only 0.01 K below average T and most of the increase is from H.
“…he slopes are opposite to each other for 35 years of the 55 years…
Nonsense. Your method of analysis here is kooky.
“…but not even an integral relationship, the transient relationship is between T and CO2…”
Nope. There is no phase distortion consistent with this hypothesis.
“Bart, Henry’s law is for any part of any system at any moment of the day.”
Only in steady state, and this system is never in steady state. The surface oceans of today are not the surface oceans of tomorrow. A part of them has been removed, and a part of them has been added.
“Again, no need to filter the temperature trend out…”
Yes you do, or the trend in temperature will cause the trend in dCO2/dt.
“As variability and offset are caused by the influence of temperature on different, independent processes, there is hardly any influence of the very small offset on the variability.”
If that were the case, then the process causing the variability would be band limited above some minimum frequency, and in the transition region around that frequency, the phase delay would change from -90 deg to 0 deg. There is no way around this, Ferdinand. If what you are saying were true, we would not have a -90 deg phase lag even to the lowest observable frequency.
But, we do have a – 90 deg phase lag even to the lowest observable frequency. The necessary conclusion is that, over this timeline, a pure integration is a legitimate model, and the trend in temperature is causing the trend in dCO2/dt.
You are just asserting what you want the case to be. But, your assertion is physically impossible.
“Paul_K’s example shows very little trend”
I shows a trend consistent with the input trend.
“…k*(T-T0) is for a T0 which is ~0.01 K below average T.”
For the UAH data set, T0 is about -0.64 K from the baseline. It can be read directly in the dialog box of this chart.
Bart:
Nonsense. Your method of analysis here is kooky.
Bart, taking an arbitrary factor and offset which doesn’t hold for 2/3rd of the time span is “kooky”. That simply shows that your entire “match” of the slopes is spurious and has nothing to do with a real mechanism where the slope of T causes the slope of dCO2/dt
Only in steady state, and this system is never in steady state. The surface oceans of today are not the surface oceans of tomorrow. A part of them has been removed, and a part of them has been added.
Henry’s law is for any dynamic system, no matter if that is in steady state or in unbalance: as long as the pCO2 pressure in the atmosphere is higher than the weighted average pCO2 of the oceans, then CO2 is pressed into the oceans, not reverse, no matter if all of the ocean surface is renewed 5 times a day or once a year.
Yes you do, or the trend in temperature will cause the trend in dCO2/dt.
That is exactly where we disagree: T doesn’t cause the trend in dCO2/dt, T variability causes CO2 variability with a lag and a small part of the CO2 trend and dT/dt causes the variability of dCO2/dt with a lag and has zero trend, thus doesn’t influence the trend of dCO2/dt at all.
But, we do have a – 90 deg phase lag even to the lowest observable frequency. The necessary conclusion is that, over this timeline, a pure integration is a legitimate model, and the trend in temperature is causing the trend in dCO2/dt.
I am not sure, but I have the impression that you are not talking about a transient response process. As Paul_K showed, a transient response gives a 90 degree lag for all frequencies, as also can be seen in the current response of the CO2 system to fast variability’s of temperature.
Further, again the slope of T doesn’t cause the slope of dCO2/dt as there is zero lag between T and dCO2/dt, dT/dt does have a 90 degree lag and has no slope.
… shows a trend consistent with the input trend.
Yes, so do I: a trend of 0.5 K over 55 years does give a small increase in CO2 of 6 ppmv, which is 8 times more than what Paul_K calculated.
For the UAH data set, T0 is about -0.64 K from the baseline.
No, that is what you need to match the slopes, by which you attribute the whole increase of CO2 to T. But as T doesn’t give more than 5 ppmv CO2 increase per Henry’s law, the offset is only 0.01 K below the average T. That still gives you the full variability in dCO2/dt with the right factor and attributes the slope to another process, as is the case here with human emissions at twice the slope… If you insist that T causes dCO2/dt.
IPCC AR5 says that between 1750 and 2011 the additional 112.5 ppm of atmospheric CO2 added just under 2.0 W/m^2 of radiative forcing to the global heat balance. The same report says clouds have a -20 W/m^2 of RF or cooling. CO2 is a bee fart in a hurricane.
If you asked my unscientific observation here, it seems to me that shining sunlight on an ocean would not just heat the air but would heat the water, below it, too. So the CAGW’s allegorical (pun intended) claims put all of the blame on the CO2. What makes better sense? Two steps, heat the CO2 then transfer that heat to the oceans or just heat the oceans directly? (One step) What makes most sense to you. If I am wrong, please explain.
William,
It is curious that all of the observations support the assertion that the majority (no less than 66.6%) of the origin of the increase in atmospheric CO2 is due to natural sources, yet you state the opposite.
P.S. Oxygen balance supports the assertion that natural hydrocarbons were burnt by humans. How does that get on your list for observations that support the assertion that the majority of the increase in atmospheric CO2 has due anthropogenic reasons?
The 14C produced by atmospheric nuclear bomb blasts has irreversible moved into deep sinks so that it dropped to less than 5% of its initial value within 40 years which completely invalidates the Bern model.
Phase analysis of δ13C levels done by Salby unequivocally and phase analysis by Humluum et al unequiviacally supports the assertion that anthropogenic CO2 emissions are responsible for no more than 33% of the recent rise in atmospheric CO2. That observation/analysis fact supports the assertion that there is a much larger natural source of low C13 CO2 into the atmosphere and that there is large sink of CO2 in the atmosphere.
P.S. We have had this discussion before and you do not understand the mathematical basis and logical reason for phase analysis. You lack the mathematical basis. Phase analysis is a standard analysis technique to determine cause and effect. Effects cannot lead causes.
The cult of CAGW developed the Bern model of CO2 sources and sinks to push their ideology. The 14C bomb spike decline supports the assertion that the resident time for CO2 is 7 to 14 years not 200 years as assumed by the Bern model.
http://www.tech-know-group.com/papers/Carbon_dioxide_Humlum_et_al.pdf
http://wattsupwiththat.com/2013/07/01/the-bombtest-curve-and-its-implications-for-atmospheric-carbon-dioxide-residency-time/
http://www.false-alarm.net/wp-content/uploads/2014/05/paper5.pdf
William,
Indeed we have been there before…
Simply said: phase analyses can’t give you any answer about the cause of the CO2 increase for the simple reason that human emissions cause no measurable variability in the rate of change in the atmosphere. All variability in the rate of change is caused by temperature variations. But as the variability and the trend are caused by different processes and the variability is certainly not causing the trend (it has a negative trend…), all ways are open to know what caused the up going trend: linear in the derivative, slightly quadratic in the atmosphere.
As the human emissions increased linear per year over time and are twice the measured increase and match all observations, you must have a very good reason why you are looking for an alternative explanation…
What Humlum e.a. forgot is that the variability is only +/- 1 ppmv around the trend and the trend meanwhile is 110 ppmv above the steady state for the current SST according to Henry’s law. The first is temperature related, the second is not temperature related, except if you have ocean temperatures which increased beyond 12 K in the past 160 years…
What Petterson forgot is that the decay rate of the 14C bomb spike is much faster than of a 12CO2 spike, because what returns as 14C is from the pre-bomb age, thus much lower than at the time of the spike. The same happens with the 13C human “fingerprint”…
William,
Don’t the IPCC in AR4 2007 say that the turnover time for CO2 is 4 years? And they also say that this should not be confused with adjustment time. The Bern model by my understanding relates essentialy to the time it takes for the concentration to return to equilibrium whereas the turnover time relates to the time an individual molecule remains in the atmosphere before it is absorbed whereby it is then mixed indiscriminately with natural pre-existing CO2 in sinks. The theory, as I understand, is that as anthropogenic CO2 is absorbed by the ocean the CO2 is quickly transferred to the deep-ocean (according to the IPCC it only has a residence time of 10 years in surface-ocean before diffusing to the deep-ocean) which would explain why the measurements show nuclear-C14 taken out of the atmosphere fast. However due to the excess CO2 in the surface-ocean and because of the Revelle Factor the concentration in the atmosphere decreases at a slower rate even though anthropogenic CO2 molecules are being rapidly transferred to the deep-ocean.
The IPCC’s figures in AR4 and AR5 are somewhat confusing at first sight because they tag ‘anthropogenic fluxes’ as anthropogenic CO2 even though these aren’t original anthropogenic molecules. For example in AR4 they say that there is 165 Gts of anthropogenic CO2 in the atmosphere, although this is of course false and if that were the case the dC13 level would be much lower than it is now. I think this is where a lot of confusion comes from. On a side-note, I am not sure what Ferdinand means when he says that the removal of C14 and C13 from the atmosphere would be significantly different from C12. I am not following his argument. The residence times for C14 and C12 are very similar (see Segalstad 1998) with a residence time of about 5 years. Although the removal of nuclear-C14 seemed to take a little longer (with a residence time of around 12-14 years) which could be explained partly by the fact that large amounts would have been ejected into the stratosphere due to the heat of the nuclear-tests and CO2 has a residence time of about 5-8 years in the stratosphere before it is transfered to the troposphere.
Richard,
I know, there is a lot of confusion between residence time and adjustment time of any excess CO2 spike in the atmosphere. But even in the case of the adjustment time there are differences: while the rate only slightly differs between the different isotopes (the heavier are slower in either direction, sea-air or air-sea) which gives a slight change in ratio, that is not the main problem.
The main problem is that what goes into the deep oceans is the isotopic composition of today, but what comes out of the oceans is the isotopic composition of ~1000 years ago (plus some deep ocean mixing), thus long before human influences. For the 13C/12C ratio that makes that about 2/3rd of the human influence is removed by the deep ocean – atmosphere exchanges. For the 14C bomb spike that was less than half the spike that returns from the deep. Here a plot of the situation in 1960 at the height of the 14C spike (twice the “natural background”):
http://www.ferdinand-engelbeen.be/klimaat/klim_img/14co2_distri_1960.jpg
While about 97.5% of the mass in (12)CO2 returns from the deep (the slight increased pressure in the atmosphere already pushed some 1 GtC/year extra into the deep oceans), only 45% * 97.5% of the initial 100% 14CO2 returns from the deep oceans.
That makes that the decay rate of the 14CO2 spike is at least a factor 3 faster than for a 12CO2 spike…
I need to proof-read more.
What has happened during times covered by the ice core record is that atmospheric CO2 was a feedback mechanism. Back then, the sum of carbon in the atmosphere, hydrosphere and biosphere was essentially constant. Warming transferred carbon to the atmosphere, and cooling transferred it from the atmosphere.
Now, we have been transferring carbon from the lithosphere to the atmosphere. Despite the warming, there has been net transfer of carbon from the atmosphere to the biosphere and hydrosphere, especially the hydrosphere. Nature has been detracting from the manmade increase of atmospheric CO2 despite the warming.
IPCC AR5 focuses on four modeled “what if” scenarios. “What if” CO2 concentrations reach 421, 538, 670, 936 ppm by the year 2100. The resulting/corresponding RF would cause an increase of X C in the global temperature and a corresponding increase in sea level due to warming oceans and melting ice. The table below summarizes.
Table SPM 3….W/m^2…ppm…..….ΔC……….ΔSea Level, in
if/by 2100
RCP 2.6…………..2.6……421……0.3 – 1.7……..10.2 – 21.7
RCP 4.5…………..4.5..….538……1.1 – 2.6……..12.6 – 24.8
RCP 6.0…………..6.0……670……1.4 – 3.1……..13.0 – 24.8
RCP 8.5…………..8.5……936……2.6 -4.8………17.7 – 32.3
As the hiatus/pause/lull proves, CO2’s radiative forcing is inconsequential compared to the water cycle’s ability to absorb/release heat.
Reblogged this on Centinel2012 and commented:
I believe that this is a good part of the reasons I would long had the there is a 10,000 year cycle that reverse the Winter and Summer in relationship to Aphelion and perihelion which matters because of the uneven distribution of land and water.
Certainly natural processes such as seasonal changes drive changes in CO2. Changes in ocean temperature over time drive changes in atmospheric CO2 (the approximate 800 year lag between when a glaciated period starts to end and CO2 increases and vice versa). These facts are I think evident to everyone.
Where the disagreement is at is the idea that human emissions are not the main current factor in causing the increased atmospheric CO2 levels.
The reason humans are the main cause for increasing CO2 levels in the atmosphere is because overall, during an interglacial, for most of the huge mass of ocean water, average temperatures over for example a 10 year period are fairly stable. Seasonally and due to changes in ENSO, the temperature of the top layers of ocean water vary quite a bit. But the average temperatures over a period like 10 years do not change that much. This is apparent by looking at current argo ocean temperature data where it is very difficult to see a change in the average yearly temperature. Or looking at the interglacial CO2 levels from Vostok ice core data show that the CO2 levels during the last interglacial went from approximately 290 ppm to approximately 260 ppm over the several thousand year interglacial. See figure 1: http://www.atmos.umd.edu/~zeng/papers/Zeng03_glacialC.pdf
Any “spikes” in CO2 levels if there were any due to volcanic or other natural events that subsided would not be apparent in the Vostok ice core data – but the data does show that CO2 levels were fairly stable.
The point is that the current changes in CO2 are caused by man. But CO2 changes are not bad. They are causing already a “Greening” of earth. An increase in CO2 is not going to cause a runaway greenhouse effect or cause any major change in temperature.
Considerable work has been done to prove or disprove causality Co2 -> T or T -> CO2 …. ?? it depends on whether you like chicken or eggs for breakfast. More likely it is chicken and eggs. Beenstock and Reingewertz ran Granger cointegration analysis and found that … “although these anthropogenic forcings
share a common stochastic trend, this trend is empirically independent of the stochastic trend in temperature and solar irradiance. Therefore, greenhouse gas forcing, aerosols, solar irradiance and global temperature are not polynomially cointegrated, and the perceived relationship between these variables is a spurious regression phenomenon. On the other hand, we find that greenhouse gas forcings might have had a temporary effect on global temperature.” Earth Syst. Dynam., 3, 173–188, 2012
Why does the author assume that causality is invariant across frequencies?
A brief Google search yields such interesting articles as this:
http://www.scielo.br/scielo.php?pid=S1413-80502014000100003&script=sci_arttext
and this:
http://papers.ssrn.com/sol3/papers.cfm?abstract_id=2361527
It’s entirely possible for there to be small variations in seasonal C02 caused by temperature yet still have decadal scale temperature changes driven by C02. In fact, the combination of Henry’s law and with other short term mechanisms and human emissions would result in exactly this kind of scenario.
The author would need to apply wavelet decomposition (as described in the second article) and figure out what causes what in various time/frequency domains. The author might find unfortunately that there’s not a long enough time span to get anything useful at the very low frequency domains since humans only made significant contributions of C02 since the 1940s.
Again I argue “not enough data for conclusions by either side” for this kind of analysis. I think that Isotope and mass balance calculations are still the best tool for causality determination here, rather than time series analysis.
Peter
Google search: https://www.google.com/search?q=causility+varies+by+frequency
In reply to:
William,
Your comments illustrates your ignorance concerning mathematical analysis and modeling. You do not understand what phase analysis is. You do not understand how models are constructed and validated. You do not understand what is an assumption and what is a fact. You repeat incorrect assumptions emphatically which I would assume you believe validates your incorrect beliefs.
Phase analysis is a standard, I repeat, a standard basic analysis method which is done to determine what is causing changes. Effects cannot come before causes. Yes anthropogenic CO2 emission does not vary significantly year by year. There is a vast yearly variance in total atmospheric CO2 and δ13C levels. Phase analysis of total CO2 variance and δ13C both independently support the assertion that no more than 33% of the recent rise in atmospheric CO2 is due to anthropogenic emissions, the remaining 66% is due to natural sources.
It is absolutely amazing as Salby noted that no one had done phase analysis of the yearly changes in δ13C to determine cause and effect. There are observed changes of δ13C are up to 300% which is not possible if the physical reason for δ13C variation in the atmosphere was only anthropogenic CO2 emission.
If there has no source of low δ13C in the ocean the δ13C in the surface ocean would be the same as in the atmosphere. A change in temperature in the ocean would therefore only change the total CO2 in the atmosphere and have no effect on the δ13C. There are observed changes of δ13C in the atmosphere of up to 100% which is astonishing as that unequivocally supports the assertion that natural CO2 sources are the reason for no less than 66% of recent rise in atmospheric CO2.
The majority of low C13 carbon dioxide is coming from the ocean. When the ocean warms or cools there is a very large change in δ13C. The ocean is saturated with CH4 which indicates the ocean is a source of new CH4. ‘Natural’ gas has low C13. There are thousands upon thousands of emitting CH4 sources on the ocean floor. There are microorganisms that live at these CH4 emission sites on the ocean floor and convert CH4 to CO2.
http://www.tech-know-group.com/papers/Carbon_dioxide_Humlum_et_al.pdf
It is an observational fact that the pulse of C14 that was created by the atmospheric atomic bomb tests in the 1960s has been irreversibly absorbed by the deep sinks of CO2 in the oceans in less than 40 years.
That observational fact supports the assertion that the half life of CO2 in the atmosphere is 7 to 14 years, not 200 years. The atomic bomb observational data invalidates the IPCC’s Bern model for CO2 sources and sinks. The Bern model assumption is that the half life of CO2 in the earth’s atmosphere is 200 years.
The Bern model is known to be scientifically incorrect. The Bern model was developed to push the cult of CAWG.
Likewise the Greenland Ice Sheet data (temperature Vs time Vs atmospheric CO2 levels) indicates the earth’s temperature is being forced externally by the sun (which explains the periodicity of the changes and explains why there is cosmogenic isotope changes at each and every temperature change including the most recent warming). The Greenland ice sheet data shows there is no correlation of the earth’s temperature and atmospheric CO2 levels.
The entire scientific basis, scientific ‘conclusions’, summary for policy makers, in the IPCC’s ‘reports’ is incorrect.
Greenland ice temperature, last 11,000 years determined from ice core analysis, Richard Alley’s paper. William: The Greenland Ice data shows that have been 9 warming and cooling periods in the last 11,000 years. The warming events that were all followed by cooling events correlate with solar cycle changes, not atmospheric CO2 changes. The sun has in the past caused cyclic warming and cooling of the planet. The solar cycle has been interrupted, there is now – big surprise – observational evidence that the planet has started to cool.
http://www.climate4you.com/images/GISP2%20TemperatureSince10700%20BP%20with%20CO2%20from%20EPICA%20DomeC.gif
http://www.agu.org/pubs/crossref/2003/2003GL017115.shtml
William:
Phase analysis of total CO2 variance and δ13C both independently support the assertion that no more than 33% of the recent rise in atmospheric CO2 is due to anthropogenic emissions, the remaining 66% is due to natural sources.
As a simple engineer with 34 years of practical experience with chemical processes, I think I know something about the difference between theory and real life…
Phase analysis of the sum of two independent variables where one has no variability and a trend twice the measured increase and the other has little trend but a huge variability gives you any answer you (don’t) want: you can attribute 0% to 100% of the trend to the high variable source with the same analysis, as the high variably variable is responsible for 100% of the variability.
In such a case some common sense must be used: what is the possibility that the small trend in temperature causes a huge trend in CO2? Near zero: 4-17 ppmv/K is what is seen in the literature for the solubility of CO2 in seawater per Henry’s law and 8 ppmv/K is what is seen in ice cores over the past 800,000 years. Thus temperature is good for almost all the variability but only for 5 ppmv increase over the past 55 years. The rest of the 70 ppmv increase over the past 55 years is from the ~130 ppmv human releases over the same period. No hand waving or phase analyses or any other theory can change that…
Salby made the same error as many before him: he interpreted the year by year δ13C changes and extrapolated them as cause of the trend. The year by year CO2 and δ13C changes are opposite to each other, which proves beyond doubt that the changes are from changes in vegetation, not from the oceans. If the changes were from the oceans, CO2 and δ13C changes would parallel each other.
Moreover, as vegetation is a net, growing sink for CO2, the longer term (> 3 years) trend of vegetation is more CO2 uptake, preferentially of 12CO2, thus leaving more 13CO2 in the atmosphere, thus not the cause of the δ13C decline…
The majority of low C13 carbon dioxide is coming from the ocean.
William, before writing such completely wrong ideas, please first check your sources. The atmosphere is currently at -8 per mil δ13C (down from -6.4 per mil in 1850). The deep oceans are around zero per mil δ13C and the ocean surface is at +1 to +5 per mil. Any substantial release of CO2 from the oceans would increase the δ13C level of the atmosphere, not decrease it. That effectively excludes the oceans as main source of the increase of CO2 in the atmosphere.
Then from Humlum e.a.:
Analyses of a pole-to-pole transect of atmospheric CO2 records suggest that changes in atmospheric CO2 are initiated south of the Equator
Which only shows that the haven’t done their homework: the variability indeed is introduced south of the equator (ENSO influence on the Amazon), but the trends are coming from the industrial NH, where 90% of human emissions are released. Here for the CO2 trends:
http://www.ferdinand-engelbeen.be/klimaat/klim_img/co2_trends_1995_2004.jpg
Here for the δ13C trends:
http://www.ferdinand-engelbeen.be/klimaat/klim_img/d13c_trends.jpg
Again a wrong interpretation of the variability’s as cause of the trend…
“The year by year CO2 and δ13C changes are opposite to each other, which proves beyond doubt that the changes are from changes in vegetation, not from the oceans”
Or from soil, which is a 60 GtC per year input at -21 PDB vs. average maybe -24 human at 9 GtC per year. When you integrate isotope ratios into the Carbon Cycle, fractionation becomes a double edged sword just as pCO2 does. When plants fractionate Carbon from the air at about -16 (balance between C3, C4, and CAM fractionation), they leave +16 in the atmosphere. Thus the output from the atmosphere to land plants is strongly positive PDB to the atmosphere and it makes no sense to argue that this flow is the source of light Carbon in the atmosphere. The reverse is true.
Land plant respiration is extremely complicated and poorly understood but photosynthetic respiration seems to retain light Carbon just as photosynthesis selects light Carbon. Other plant tissues, petioles, branches, trunks, roots all have different fractionations but seem far less fussy than leaves about heavy Carbon. The net result is that the return respiratory flow from land plants to the atmosphere is probably either positive or neutral PDB.
Bottom line is that net flow between land vegetation and the atmosphere is greater than +16 d13C to the atmosphere.
“Any substantial release of CO2 from the oceans would increase the δ13C level of the atmosphere, not decrease it”
The surface membrane seems to fractionate at -10 from the ocean to the atmosphere so this flow does not increase atmospheric d13C by adding +2 ocean surface Carbon. This -10 fractionation applies to both deep water upwelling at 40 Gt per year and mixed layer atmospheric input at 70 Gt per year as they both pass through the membrane.
Now, how important is human 9 Gt at -24?
“The year by year CO2 and δ13C changes are opposite to each other, ”
I may have misread “opposite” here in a prior comment. Atmospheric 13C must increase at the seasonal peak of a +-100 Gt inhalation by land plants of -16 light Carbon. The exhalation is more complicated because it is offset by southern hemisphere inhalation. The exhalation is further complicated by the above mentioned -10 fractionation through the surface membrane from seasonal warming of predominant southern oceans (see OCO-2).
Gymnosperm,
To be more clear, the opposite CO2 and δ13C changes are from the biosphere, not from the oceans. That may be less uptake by plants, or more decay by bacteria or a mix of them. The cause was investigated and centered in the Mid/South American forests during El Niño episodes accompanied with drought in several parts in the Amazon region. Unfortunately I lost the link to that investigation.
If plants take more CO2 in, CO2 levels drop and δ13C levels increase. The opposite happens when there is less uptake and more decay: in both cases the changes are opposite to each other.
I doubt that the decay of plants is much less negative than what is taken out of the atmosphere: if you look at the seasonal cycle, about as much δ13C drops in fall and winter as it rises in spring and summer.
Anyway, since about 1990 the oxygen balance shows that the biosphere as a whole is a net sink for CO2, thus preferentially of 12CO2, thus leaving more 13CO2 in the atmosphere and thus not the cause of the δ13C decline in the atmosphere.
Most of the 40 GtC (deep) and 50 GtC (surface) ocean-atmosphere exchanges are bidirectional. For the ocean-atmosphere part, the drop in ratio indeed is -10 per mil, but for the atmosphere-ocean part, the increase is +2 per mil, thus average -8 per mil, except for any unbalances between influx and outflux. At this moment there is an unbalance of ~3.5 GtC/year more sink than source (0.5 GtC/year in the surface layer, 3 GtC/year in the deep oceans).
For the deep oceans (at 0 to +1 per mil) the net effect would be a slight drop to -7.5 per mil in the atmosphere (not taking into account that the largest growth of plankton is at the upwelling places, thus increasing the δ13C level). For the ocean surface (at +1 to +5 per mil) the average exchange with the atmosphere would give -5 per mil in the atmosphere. The levels measured in ice cores for the pre-industrial period were at -6.4 +/- 0.2 per mil, seems not far off for a mix of deep and surface ocean exchanges…
Currently we are at -8 per mil in the atmosphere and dropping in ratio with human emissions. Any substantial release from the oceans, no matter deep or surface, would increase the current δ13C level in the atmosphere, not decrease it…
It is absolutely astonishing that the foundation for CAGW, which is the assumption that the majority of the recent rise in atmospheric CO2 is due to anthropogenic CO2 emissions is incorrect. Salby analyzed three independent observational variables 1) δ13C changes in the atmosphere with time, 2) total CO2 changes in the atmosphere with time, and 2) Anthropogenic emission changes in the atmosphere with time Vs total CO2 in the atmosphere. The results of three independent analyses was the same which supports the assertion that the analysis result and conclusion is correct. Anthropogenic CO2 emission is responsible for no more than 33% of the recent rise in atmospheric CO2.
Salby’s result is not a big surprise. The following is a 2009 paper that supports the same conclusion as Salby and Humluum et al. As noted in the 2009 paper, the IPCC ‘reports’ has the same data and conclusion buried within the report. It is absolutely amazing how long the cult of CAGW scam has gone on.
http://pubs.acs.org/doi/abs/10.1021/ef800581r?journalCode=enfuem
MacRae makes exactly the same error as Salby, and for exactly the same reason. When SST goes up, there is an atmospheric response, as there must be according to Henry’s Law. But that does not mean that the atmospheric CO2 increase is caused by ocean temperature. Just the reverse is true: when SST goes up, the oceans absorb less of what we emit, leaving more of what we emit in the air. When SST goes down, the oceans absorb more of what we emit, leaving less of what we emit in the air. This gives just the illusion of causality that fooled Salby, and continues to fool MacRae.
Conservation of mass rules. Salby hasn’t explained it away, and neither has MacRae. The CO2 that we emit cannot just vanish.
The CO2 we emit vanishes into insignificance compared to the natural variations in CO2 within the oceans and biosphere.
Stephen,
So in your view, it did in fact just vanish? Then you’re violating Conservation of Mass too.
Keith Pickering,
It sounds like you’re making a distinction between natural CO2 emissions, and aCO2. But Allen MacRae’s thesis is that ∆CO2 follows ∆T. That has been confirmed repeatedly across time spans from months, to hundreds of millennia.
Interestingly, the opposite isn’t the case: ∆T is not caused by ∆CO2. So the whole “carbon” scare is predicated on something for which there are no measurements. All the available measurements show that T is the cause, and CO2 is the effect.
The alarmist crowd got their causation wrong. No wonder their conclusions are wrong.
If ∆CO2 follows ∆T. as you claim, could you please point out where in the last 800,000 years the T spiked to cause today’s CO2 levels?
http://lafenergy.org/essays/figs/Co2-temperature-plot.png
..
Thank you in advance of your response.
PS DBStealey,
In numerous previous posts you have claimed that global warming has stopped
..
If ∆T is now zero (past 18 years) why is CO2 continuing to rise?
“It sounds like you’re making a distinction between natural CO2 emissions, and aCO2.” No, rather I’m making the distinction between natural CO2 absorption, which is 102% of natural emissions, and human CO2 absorption, which is 0% of human emissions. Thus human emissions are responsible for 100% of the atmospheric increase. Kinda like a company that has one product that is responsible for 2% of the revenue but 100% of the profits; that is obviously the most important product the company makes.
∆CO2 follows ∆T at short timescales, but that’s totally beside the point. Which IS the point. You are incorrect when you state that “∆T is not caused by ∆CO2”; in fact it is: see Attanasio, A., Pasini, A., & Triacca, U. (2013). Granger causality analyses for climatic attribution. Atmospheric and Climate Sciences, 2013. DOI: 10.4236/acs.2013.34054 .
For another example, correlation between global surface temp and atmospheric CO2 peaks at lags of between 8 and 30 years (depending on the temperature dataset you choose), which is just what is expected from theoretical considerations (see, e.g., Joos, F., Roth, R., Fuglestvedt, J. S., Peters, G. P., Enting, I. G., Bloh, W. V., … & Weaver, A. J. (2013). Carbon dioxide and climate impulse response functions for the computation of greenhouse gas metrics: a multi-model analysis. Atmospheric Chemistry and Physics, 13(5), 2793-2825.)
Keith, are you Ferdinand posting another name?
You are making the same error that Ferdinand made at least three times on this page. Please see my note to him of April 12, 2015 at
http://wattsupwiththat.com/2015/04/09/how-to-convince-a-climate-skeptic-hes-wrong/#comment-1904964
Allan, no pseudo Ferdinand at work, one is already enough…
But indeed you haven’t claimed that the increase is not human induced, my bad. But again, the lag of CO2 after T doesn’t exclude a small feedback from CO2 on T…
No worries Ferdinand (at 2:06pm).
The misinterpretations (and the usual trolls) were a tiny bit annoying, but not that much.
I appreciate many of the comments, since they helped to better define the issue.
My conclusions remain intact – I am stirred, but not shaken. 🙂
Allan,
I confirm that I am not Ferdinand. And if you’re agnostic on the mass balance argument, you are essentially admitting that you have no answer for the one scientific argument that eviscerates your analysis. This is why Salby couldn’t pass peer-review. And it’s why you won’t either, if you choose to subject yourself to it. The history of science is full of ideas that sounded great on paper but were falsified by a single unanswerable argument, and this is another one.
Your statement that “it is clear that Earth’s climate is INsensitive to increasing atmospheric CO2” is also incorrect; you’re just looking at timescales that are too short. In fact you will find that the correlation between global surface temperature and global CO2 maximizes at lags of between 8 and 30 years (CO2 leading, temp lagging), which is just what we would expect from theoretical considerations (see my reply elsewhere on this thread for citations),
Keith at 9:26am:
Such an angry man – full of sound and fury, bluff and bluster…
And so certain he has grasped the issues. “Eviscerates”, Keith? Really?
I apologize to Ferdinand for my mistake – Ferdinand has much more intellect, and class.
Are you perhaps Mosher posting under another name?
See here::
http://wattsupwiththat.com/2015/06/13/presentation-of-evidence-suggesting-temperature-drives-atmospheric-co2-more-than-co2-drives-temperature/#comment-1964885
Allan,
No, I’m not Mosher either. And I’m posting under my real name. Nor am I at all angry. I use the word “eviscerates” because it is aptly descriptive of the situation. And although I disagree with your argument, I have been entirely polite to you personally; one wonders why you have not returned the favor.
One cannot violate conservation of mass and expect to be taken seriously by scientists. Not all of the CO2 that we have emitted remains in the atmosphere, and I can assure you it did not just vanish. It must exist somewhere. Oceans are growing more acidic, and oceanic CO2 is increasing in lockstep with atmospheric CO2. Both of these have been measured for decades now in various locations.
http://www.epa.gov/climatechange/science/indicators/oceans/acidity.html
The data falsifies your theory. Oceans are absorbing CO2 from the air, not emitting it, and it is the rate of their absorption (not the rate of their emission) that changes with temperature, according to Henry’s Law.
The anthropogenic CO2 moves into deep ocean. The Bern model assumes almost no mixing of the surface ocean (top 100 meters) with the deep ocean. As we all know now due to the heat hiding in the deep ocean hypothesis there is significant mixing of the deep ocean water with the surface ocean.
The following is a good review paper of the history of CO2 atmospheric research and the history of the IPCC shenanigans. It is interesting that peer reviewed papers all contradict the IPCC’s Bern model assumptions.
One of the key points is the resident times of CO2 in the atmosphere. The C14 bomb test analysis (Analysis of the spike of C14 produced by the atomic bomb test) indicates the resident time for CO2 in the atmosphere is 7 to 14 years as the C14 pulse disappeared in roughly 50 years (five folding times). As the surface ocean reservoir is reversible (that is key) the only way atomic bomb pulse of C14 can drop to very, very low levels is there must either be mixing of deep ocean water with the surface water and/or C14 must precipitate out. If there is significant mixing of deep ocean water with surface water (this what the heat hiding in the deep ocean hypothesis requires) then the majority of the anthropogenic CO2 will be transferred into the deep ocean carbon reservoir which is more than 50 times greater than the atmospheric CO2 rise. The key logical point is that anthropogenic CO2 emissions are very, very, small compared to the super enormous, deep ocean carbon reservoir.
The physical implication of the C14 bomb test analysis is the majority of the CO2 increase in the last 70 years was caused by the warming of the oceans rather than the anthropogenic CO2 emissions.
Truly fascinating!
http://folk.uio.no/tomvs/esef/ESEF3VO2.pdf
“The Bern model assumes almost no mixing of the surface-ocean (top 100 meters) with the deep-ocean”.
Could you cite a source for this? The IPCC’s carbon-cycle figures adhere to the Bern model and assume that CO2 in the surface-ocean is transferred to the deep-ocean with a residence time of 10 years.
Yes. The 1963 halt in atmospheric atomic bomb testing provided the perfect “tracer” experiment.
There is about a one year “delay” in atmospheric mixing/equlibrium due to the 14CO2 additions, but that is not a problem. By 1974 one-half of 14CO2 was gone, removed into what you call the “deep” sinks. Ferdinand claims that 12CO2 and 13CO2 behave differently, but that is wrong. 12, 13 and 14CO2 are chemically identical for any bulk behavior. Therefore, every 10 years, 50 percent of all atmospheric CO2 is “permantently” lost into the deep sinks, with a similar replacement from old “deep sources”
You, Bart, Salby, Gosta Pettersson, Segalstad and many others are basically correct, the global CO2 cycle is very large, with a very large “permanent” turnover. CO2 never “accumulates” in the atmosphere, from any source on any time scale, any more than water “accumulates” in a river.
The yearly addition (flux) of human CO2 amounts to about 3 percent of the global carbon cycle. The atmospheric component of the global carbon cycle has therefor increased by about 3 percent.
.03 times 400ppm is 12 ppm. 100 years ago, when human CO2 was maybe 1 percent of the global carbon cycle, the amount of human CO2 in the atmosphere was about 1 percent of the total CO2 at that time, say 300 ppm in 1915. So .01 times 300 equals 3 ppm. In 1915 the amount of atmospheric CO2 due to humans was about 3 ppm. Some day, the human proportion will increase to 4 percent of the annual total carbon cycle, so if that happens around 2030, and total CO2 is around 415 ppm, then the amount of human CO2 in the atmosphere will be about .04 times 415, or about 17ppm. Other people in the global carbon cycle biz have made similar approximations using other pragmatic approaches. Segalstad is pretty definitive, but the Gosta Pettersson thread is a good place for a start.
http://wattsupwiththat.com/2013/11/21/on-co2-residence-times-the-chicken-or-the-egg/
Adding 3 or 4 percent to a river flow is not significant to the content of the river.
bw,
Bart has a different claim than the residence time.
I never claimed that 12CO2 behaves different from 13CO2 or 14CO2, besides a slight physical difference in exchange speed which gives a slight fractionation between the isotopes. But that is not the point.
What the IPCC and I and many others claim is that the residence time only shows how fast a molecule CO2 is exchanged with a CO2 molecule from another reservoir, but that says next to nothing about how long it takes to remove an extra amount of 12CO2 or 13CO2 or 14CO2 or a mix of them out of the atmosphere. That is where William, Salby, Humlum, Pettersson and many others err.
The 14C bomb spike indeed is a good tracer, but one need to take into account that what returns out of the deep oceans is the 14C level of ~1000 years ago, long before any human influence on the 14C level. That makes that the decay rate of the 14C bomb spike is much faster than of a 12CO2 spike.
Well human emissions are only 9 / 150 = 6% of the natural cycle. But that doesn’t imply that the 6% is not the cause of the increase in CO2 levels of the atmosphere.
Take your example:
You add a year by year increasing amount of water to a river which flows into a basin behind a dam where at the bottom a valve regulates the outflow. In the years before, the valve opening was fixed and couldn’t be moved anymore. Despite that, the outflow was more or less in equilibrium with the inflows, the level in the basin did fluctuate a little, but in average it was fixed in height.
Now your extra inflow adds some more water to the basin. The initial outflow didn’t change much at the beginning, thus the level increased a little, enough to give some increased pressure at the outlet to remove halve of the extra inflow. But the extra inflow increased again, increasing the level, again removing more water out of the basin, but still only halve the extra input. This story is now going on for at least 55 years…
Do you agree that in that case:
1. The amount of water originating from the extra inflow in the basin still is small, only a few %.
2. The total 33% increase in the basin level is caused by the small extra inflow.
The CO2 “We” emit.
Per IPCC AR5 Chapter 6
1750………….…278.0 ppm……2.17E+15 kg
(How do they know? No MLO! Ice cores? Tea leaves? Ouija board?)
2011…………….390.5 ppm……3.05E+15 kg
Difference.….112.5 Δppm…..8.78E+14 Δkg
What was the source of the increase in ppm and kg between 1750 and 2011 and how does anybody know? Could be outgassing as the oceans warm. Could be limestone weathering. Lots of possibilities. Permafrost melting. Forest fires. But how to lay this at the “We” feet of industrialized man?
Per IPCC AR5 – 1750 to 2011
Anthro carbon contribution, PgC: 555 (How do they know?)
Anthro carbon atmospheric residual, PgC: 240 (43%, ditto?)
CO2 residual, kg…….2.40E14*3.67 = 8.81E+14 kg
Anthro residual as percentage of 1750-2011 delta…….100.3%
How fortuitous! How coeenkadental! How convenient! How totally dry lab’d! These numbers are all made up! 200 of the 260 years have zero reliable data. Wags, estimates, approximations, somebody’s judgment call! The uncertainty on these numbers must be a barn door wide! However they clearly were selected and adjusted to match the foregone conclusion! Presto! Anthro = 8.81E+14 kg. Run away! Run away!
Here’s the barn door as painted by IPCC AR5 6.3.1. All numbers in PgC.
…………………….minus……mean……..plus…Uncertainty +/-
Anthro output…….470……….555……….640……..15.3%
Fossil fuel…………..345……….375……….405……….8.0%
Net land use……….100……….180……….260……..44.4%
Ocean flux…………-185………-155………-125……..19.4%
Land sink…………..-250………-160………..-70……..56.3%
Anthro residual….230……….240……….250……….4.2%
Values at max range……………10 (-96%)…………..470 (+96%)
Square root sum of squares: +-/ 75%
So how does the bottom line have +/- 4.2% uncertainty when the input data runs as high as +/- 56.3%. Maximum range of the independent variables is +/- 96%!!! And the square root of sum of the squares is +/- 75%! Must be that new math. This is worse than bogus hockey sticks!
Nick,
Human emissions from fossil fuels are based on sales (taxes!) and burning efficiency and are quite well known. If anything wrong, probably more underestimated than overestimated (by under the counter sales).
Net land use is far more uncertain, but adds to fossil fuel use. The rest has large error margins, but that has little effect on the net result, only on how the human emissions are distributed over the main sinks.
The net effect is exactly known:
Net sink rate = human emissions – increase in the atmosphere
The latter is exactly measured (+/- 0.2 ppmv), human emissions are known with reasonable accuracy, thus the net sink rate is known with reasonable accuracy. Where the sinks are is of academic interest, but not necessary for the mass balance: nature is a net sink for CO2, not a source.
Between 1750 and 1950 IPCC don’t know squat!