By S. Fred Singer
Oh boy! Get ready to watch yet another big fight about climate change – this time mainly among different groups of climate alarmists. Is there a “pause”? Did global climate really stop warming during the last dozen years, 18 years, or even 40 years – in spite of rising levels of the greenhouse (GH) gas carbon dioxide?
Science mag is publishing a blockbuster paper today, on June 5. The renowned National Climate Data Center (NCDC), a division of NOAA located in Asheville, NC, claims that the widely reported (and accepted) temperature hiatus (i.e., near-zero trend) is an illusion – just an artifact of data analysis – and that the global climate never really stopped warming. If true, what a blessing that would be for the UN-IPCC – and for climate alarmists generally, who have been under siege to explain the cause of the pause.
This paper is turning out to be a “big deal.” The publisher of Science has even issued a special press release, promoting the NCDC claim of continued slow but steady warming.
Of course, NCDC-NOAA and Science may end up with egg on their collective faces. It does look a little suspicious that NCDC arrived at this earth-shaking “discovery” after all these years, after “massaging” its own weather-station data, just before the big policy conference in December in Paris that is supposed to slow the rise of CO2 from the burning of energy fuels, coal, oil, and gas.
Now watch the sparks fly — as there are two major constituencies that have a vested interest in the pause:
There are at least two rival data centers that may dispute the NCDC analysis:
the Hadley Centre in England and the NASA-Goddard Institute for Space Studies (GISS). In fact, Hadley’s partner, the Climate Research Unit at the University of East Anglia, was the first to announce, on the BBC, the existence of a pause in global warming.
Then there are also dozens of scientists who have published research papers, purporting to provide an explanation for the reported pause. Yours truly turns out to be amongst these. They will all be mightily disappointed if their intellectual efforts turn out to be for naught.
But hold on. NCDC may turn out to be quite wrong. Not surprisingly, they used the surface temperature record, with its well-known problems. Not only that, but a look at the detailed NCDC evidence shows that much depends on polar temperatures — which are mostly guessed at, for lack of good observations. If one uses the (truly global) satellite data, analyzed either by UAH or by RSS, the pause is still there, starting around 2003 [see Figure; it shows a sudden step increase around 2001, not caused by GH gases].

Not only that, but the same satellite data show no warming trend from 1979 to 2000 – ignoring, of course, the exceptional super-El-Nino year of 1998. This finding is confirmed by other, independent instrumental data — and also by (non-instrumental) proxy records (from tree rings, ice cores, lake sediments). This leads to important far-reaching consequences that are more fully discussed and referenced in the reports of NIPCC (Non-governmental International Panel on Climate Change) [search NIPCCreport.org, esp. the CCR-II report of 2013].
UN-IPCC claims for AGW undermined
IPCC-4 [2007] and IPCC-5 [2013] both present claims for anthropogenic global warming (AGW) that are based mainly on reported surface warming from 1979 to 2000. In the absence of such a warming trend, the IPCC claims become invalid; there would be no human-caused greenhouse warming in the 20th century – and certainly not earlier.
It is worthwhile, therefore, to re-examine carefully the absence of warming in the last two decades of the 20th century.
The satellite results of near-zero warming trend are fully backed by radiosonde data from balloon flights — notwithstanding spurious claims by Santer et al [in Int’l J of Climatology 2008; see full discussion by Singer in Energy&Envir 2013]. The absence of a tropical “Hotspot” (a once-controversial upper-troposphere warming trend) “makes the cheese more binding.”
Sea-surface temperatures (SST) show only a slight warming – as do night-time marine air temperatures (NMAT), assembled by the Hadley group. Data on ocean heat content before 2000 are spotty and not very useful. In any case, the interpretation of vertical temperature profiles would require factoring in ocean circulation at different levels.
Proxy data of various types, assembled by Fredrik Ljungqvist in Sweden, and independently by NOAA scientist David Anderson, generally show no warming; Michael Mann never released his post-1979 proxy data, and has even denied their existence (in a personal 1990 email); one suspects that the reason is they show no warming.
A quick word about the observed (and genuine) warming interval 1910-40. It can be seen not only in surface thermometers at weather stations, temperature records from ships, but in all published proxy records. Alas, I could not find any atmospheric temperature data for that period. It is generally agreed, however – including by IPCC –that this warming is of natural origin and not from GH gases.
Thus there is no evidence whatsoever of any GH warming from human-released CO2 — during the whole of the 20th century or earlier.
The bottom line
One can certainly argue about whether the NCDC results are correct –and I expect many months of back-and-forth. So, has global warming really stopped? We will know for sure in just a few years.
There will certainly be debate also about my proposition of no evidence at all for AGW. We will need a persuasive answer to the puzzle — why do land thermometers show a warming before 2000, but not after 2000? I may have an answer, but must first try to convince my colleagues.
One thing is quite certain, however: Current IPCC climate models cannot explain what the observations clearly show. This makes the models unsuitable for climate prediction – and for policy purposes generally.
*****************************
This article originally published on American Thinker
S. Fred Singer is professor emeritus at the University of Virginia and a founding director of the Science & Environmental Policy Project; in 2014, after 25 years, he stepped down as president of SEPP. His specialty is atmospheric and space physics. An expert in remote sensing and satellites, he served as the founding director of the US Weather Satellite Service and, more recently, as vice chair of the US National Advisory Committee on Oceans & Atmosphere. He is a Senior Fellow of the Heartland Institute and the Independent Institute. He co-authored the NY Times best-seller Unstoppable Global Warming: Every 1500 years. In 2007, he founded and has chaired the NIPCC (Nongovernmental International Panel on Climate Change), which has released several scientific reports [See NIPCCreport.org]. For recent writings see http://www.americanthinker.com/s_fred_singer/ and also Google Scholar.
*********************************************************************
A lot of discussion about the slope of the temp v. year trend being dependent on the start point. What if the current date was the start point and we ran it backwards in time? Legit?
That’s basically what Monckton does. Start today and go back until you find a positive linear trend.
I’m thinking this ‘paper’ may be the worst thing that has ever happened to the AGW argument. For the first time the ‘fellow traveler’ media are actually looking at the way surface temperature measurements are taken (and adjusted), not just blindly accepting it. Even they can’t buy the projection of surface temperatures over land being projected out over the ice in the Arctic. If they don’t buy that, then the entire record falls apart because most of the ‘warming’ comes from that area. It looks to me like this paper is drawing attention to the fact that the emperor has no clothes.
The atmosphere can hold only 1% of global energy increase and can therefore be thrashed around by every little hiccup of the ocean oscillations. We can now stop obsessing about surface measurement as an indication anything other than very long (multi-decade) climate. We can now take the temperature of the only accumulator of global climate accumulation, the oceans which show very little warming for the first decade of ARGO data. It smooths out all the noise and lets us stop bickering about every weather event driven by ocean energy cycles. By the way if anyone is still interested it shows 1/3 or less warming predicted for CO2 and 1/10 of that required to reach the vaunted 3 C/century.
Global Warming has been happening for the last 18 years. The only problem is that it has been happening in computer models, corny Hollywood sci-fi movies and TV miniseries, and not it the real world. Nothing new here – just a new model with massaged data. Meanwhile, back in the real world, nada……
No comment, but a question. Everyone (I think) agrees that we have been in an interglacial period since at least the little ice age. Tell me, please, what the earth’s temperature does during an interglacial period. Seems to me that the earth warms until it doesn’t, then back into an ice age. Am I correct? If so, all this hysteria over “the warmest month ever” etc needs to be analyzed against typical interglacial behavior.
just a rumour on the internet…
5 June: The Weather Network: Scott Sutherland: Global warming ‘pause’? New study shows it doesn’t exist
Despite evidence to the contrary, there’s been a persistent rumour floating around on the internet and on certain media outlets about a global warming “pause” or “hiatus.” In response to this rumour, scientists have been ***quick to point out that, although surface air temperature records might show that the rate of warming has slowed somewhat over the past 15 years or so, this does not mean that the Earth is no longer accumulating heat from global warming…
And what of the research that’s been done over recent years, to account for how a “pause” could develop? Karl told the Washington Post that the phenomena discovered in the research are very real and they did cause cause a slowdown in warming – just not to the point where the rate of warming actually slowed…
As Penn State climate scientist Michael E. Mann noted in an article on EcoWatch…etc
http://www.theweathernetwork.com/news/articles/whats-up-in-climate-change-no-global-warming-pause/52258/
For anyone who already suspected that temperature records may be subject to an excessive amount of guesswork and potential bias, this following paper is a shocking eye-opener.
It’s pretty clear that the best thing that could have been done with “bucket measurements” would have been to throw them immediately over-board.
Back where they came from.
The total sum the imposed guesswork is in some instances of the order of several whole degrees C.
And even all this analysis charitably assumes that sailors in the open ocean were diligently performing the task, as instructed.
Rather than just picking reasonable sounding numbers from the top of their head.
The reality of human psychology is that when required to fill out seemingly useless data on a form, non-scientists prefer to just scribble down a number that looks plausible and tus save themselves the trouble of completing the task.
Anyone who thinks that sailors could be relied upon to diligently complete this task is a gullible fool who clearly knows nothing about the mentality of low-wage workers.
And Karl et al. and “Science” are placing great reliance on this utter hogwash.
Then they are imbeciles of the first order.
http://www.ocean-sci.net/9/683/2013/os-9-683-2013.pdf
What you say, tireless amphibian, matches exactly the experience of my errant youth; in mines, mills and airports, I have witnessed creative recording of weights, temperatures, pH, and just about everything else.
It’s not always indolence, though frequently it is; sometimes it’s things like frustration with the instruments, which won’t say the same thing twice.
I would add that the problem is not remedied by high wages; people soon become habituated to the good wage and the immediate tedium of the task determines their behaviour.
Of course, people in elevated positions are unfailingly sedulous in all things! Or, they can’t imagine that their underlings are as lax as they are.
No – it does the reverse. Typically temperatures are warmest at the start of the interglacial and that period of warmest temperatures is called the optimum. There is then a cooling trend throughout the interglacial. However this is irregular so that you will see warm and cold periods superimposed on the overall cooling trend. Eventually it gets cold enough to hit the tipping point where land based ice does not fully melt over the Northern summer, and back into the freezer we go.
Transitions in and out of ice age are abrupt. There is a clear tipping point there which we should be wary of. There is no sign of a tipping point in the hot direction. In fact there are strong signs of a ceiling on temperature which rules out scenarios of runaway warming.
IPCC AR5 acknowledges the pause/hiatus/lull.
WG1AR5_Chapter09_FINAL
Box 9.2 | Climate Models and the Hiatus in Global Mean Surface Warming of the Past 15 Years
“The observed global mean surface temperature (GMST) has shown a much smaller increasing linear trend over the past 15 years than over the past 30 to 60 years (Section 2.4.3, Figure 2.20, Table 2.7; Figure 9.8; Box 9.2 Figure 1a, c). Depending on the observational data set, the GMST trend over 1998–2012 is estimated to be around one-third to one-half of the trend over 1951–2012 (Section 2.4.3, Table 2.7; Box 9.2 Figure 1a, c). For example, in HadCRUT4 the trend is 0.04ºC per decade over 1998–2012, compared to 0.11ºC per decade over 1951–2012. The reduction in observed GMST trend is most marked in Northern Hemisphere winter (Section 2.4.3; Cohen et al., 2012). Even with this “hiatus” in GMST trend, the decade of the 2000s has been the warmest in the instrumental record of GMST (Section 2.4.3, Figure 2.19). Nevertheless, the occurrence of the hiatus in GMST trend during the past 15 years raises the two related questions of (1) what has caused it and (2) whether climate models are able to reproduce it.”
And two very good questions.
(1) Heat is absorbed/released by oceans, water vapor, clouds, albedo, etc. orders of magnitude greater than CO2.
(2) Obviously no, no they haven’t and can’t.
That’s a ” keeper ” , Nick !
In summary – a bunch of self-described “scientists” decided to try and discern the temperature of the sea surface in the past, by collecting measurements taken by sailors with a variety of buckets and thermometers.
The scientists recreated what they imagined the sailors would have been doing with the buckets.
They recreated the buckets and measuring equipment. They even placed buckets in wind-tunnels to precisely investigate the cooling of the buckets in wind.
I expect that they probably all wore sailors outfits and addressed each other in strong cornish accents whilst drinking rum and singing shanties.
Having done all this and much else, they created a big heap of precisely measured terms.
With such precision at their fingertips it escaped their notice, that nobody involved had got the vaguest idea what they were actually doing.
Let them speak for themselves. This from our friend Phil Jones:
“For the nineteenth century data, the evaporating bucket model produces results which are noticeably less internally consistent compared with those for 1905-40. Based on somewhat sketchy evidence, wooden buckets were probably dominant up to 1870-1880, with a transition to un-insulated buckets occurring between then and the early twentieth century. We have assumed that canvas buckets, or their equivalent, accounted for 25% of all buckets prior to 1880, and that this fraction increased linearly to 100% in 1905. For ship speed we have used 4 ms-1 prior to 1880, increasing linearly to 7 ms-1 in 1905, and assumed wind speed on deck to be 60% of anemometer speed. The exposure time was kept at 4.5 minute.”
“Based on somewhat sketchy evidence” – never were these words more appropriate.
You assumed rather lot of stuff there, didn’t you Phil? But a fantastic job of creating the appearance of cargo-cult “sciencey” precision imposed on the sketchy assumptions.
No where have I seen that before?
http://www.researchgate.net/profile/P_Jones/publication/253273895_Corrections_to_Pre1941_SST_Measurements_for_Studies_of_Long_Term_Changes_in_SSTs/links/02e7e5299d47c91ba5000000.pdf
Leftists know CAGW is within 5~7 years of being disconfirmed if current flat/falling trends continue, as discrepancies between CAGW model projection means vs reality will soon exceed 3 standard deviations for more than 20 years, which is more than sufficient disparity and duration to toss CAGW in the trash.
Obviously Leftists will do anything to avoid that eventuality, hence the continuos upward “adjustments” to keep this CAGW hypothesis going.
As long as RSS, UAH, radiosonde data and the Scientific Method exist, CAGW will eventually end up on the trash heap of history.
In he interim, we’ll have to suffer through Leftists’ feeble attempts to keep the CAGW gravy train chugging along…
SAMURAI
You write
I provide assistance by correcting your mistakes which – out of kindness – I assume to be typographical errors.
Rightists know CAGW is within 5~7 years of being disconfirmed if current flat/falling trends continue, as discrepancies between CAGW model projection means vs reality will soon exceed 3 standard deviations for more than 20 years, which is more than sufficient disparity and duration to toss CAGW in the trash.
Obviously Rightists will do anything to avoid that eventuality, hence the continuos upward “adjustments” to keep this CAGW hypothesis going.
As long as RSS, UAH, radiosonde data and the Scientific Method exist, CAGW will eventually end up on the trash heap of history.
In <bthe interim, we’ll have to suffer through Rightists’ feeble attempts to split opposition to the the CAGW gravy train chugging along…
Richard
Richard– It wasn’t a typo when I wrote “Leftists”….
The CAGW political phenomenon is almost exclusively propangdized by and for Leftists’ numerous agendas.
RIchard, your comments are usually well worth reading and thought provoking but whilst some Rightists have naturally jumped on the bandwagon because they like the easy money of subsidies (big business will exploit anything on offer hence why BP, Shell, Swiss Re. Munich Re, the KMPG and the like, investment bankers such as Goldman Sachs all have depatrtments pushing the cAGW conjecture and carbon pricing/trading), it is clear that cAGW is a leftist big state intervention and wealth redistribution movement, promoted by leftist educationists.
SAMURAI and richard verney
The untrue political propaganda that the global warming scare is some kind of left wing plot is divisive and damaging to opposition to the scare.
The global warming scare is a bandwagon that always has been independent of left vs right political alignments except in the USA. Indeed, the scare was deliberately started by right wing Margaret Thatcher.
We approach the UN FCCC COP in Paris this coming December. That meeting will attempt to revive the corpse of international political action on global warming which was killed at the Copenhagen COP in 2009.
I am a socialist so very opposed to communism, but I assisted the communist Chinese in their successful destruction of the intentions for continuation of the global warming scare at Copenhagen.
Actions to oppose the global warming scare at the forthcoming Paris COP are hindered by the ridiculous attempts of the American political right to pretend the scare is a left-wing plot. We need to maximise opposition and not alienate the majority of our potential allies in opposing to the scare.
Richard
However CACCA started, the ho@x has been embraced by the Left. Besides yourself, how many skeptical Progressives are there?
Doubt that you wrote this, for instance:
http://www.ukcoal.com/climate-change.html
If UK Coal is on board with IPCC’s lies, what Progressive organization is opposed to them?
Given the need of the world’s poor for cheap energy, there should be some genuine Leftists among skeptics.
sturgishooper
You say and ask me
and
Taking each of your points in turn.
The global warming scare was started by the right (i.e. Margaret Thatcher),promoted by the right (e.g. the UK Conservative Party), became a bandwagon and was joined by people of all political persuasions for reasons of personal self interest. Simply, the ho@x has been embraced by people of the right, middle and Left of the political spectrum.
I don’t know how many “skeptical Progressives” there are. Indeed, I don’t know what a “skeptical Progressive” is. I am a left-wing socialist of the old-fashioned British kind, and many of us are opposed to the global warming scare.
Importantly, the views of “skeptical Progressives” are a change of subject. I was objecting to the damaging falsehood that the global warming scare is a plot by “leftists”.
The global warming scare is supported by many energy companies including large ones such as BP and Shell together with tiny ones such as UK Coal. So what? Are you trying to assert that these commercial companies are “leftists”?
I don’t know what you mean by Progressives, but I do know that there are many more “leftists” who oppose the scare than there are “rightists” who oppose the scare. China is a communist (so “leftist”) country that opposes the scare and is totalitarian so it is both an organisation that opposes the scare and is 1.3 billion people who oppose the scare.
Clearly, China alone demonstrates that there are more “leftists” than “rightists” who oppose the global warming scare, and China is building coal-fired power stations at the rate of two per week to provide cheap energy for millions of poor people.
I repeat,
Actions to oppose the global warming scare at the forthcoming Paris COP are hindered by the ridiculous attempts of the American political right to pretend the scare is a left-wing plot. We need to maximise opposition to the scare and not alienate the majority of our potential allies in opposition to the scare.
Richard
Richard,
“Progressives” is what American Leftists prefer to call themselves these days, especially those who also identify as socialists.
sturgishooper
Thankyou for explaining what you mean by “Progressives”.
Richard
Richard,
You are most welcome. I apologize for using a term I wrongly thought with which I thought most politically active people in the English speaking world would be familiar.
Progressives don’t find “liberal” to be Leftist enough, since after all there are classical liberals who today are in America conservatives.
97% of scientists now agree that the heat is hiding under Michael Manns bed.
Reblogged this on Utopia – you are standing in it!.
Fred Singer wrote, “Thus there is no evidence whatsoever of any GH warming from human-released CO2 — during the whole of the 20th century or earlier.”
Didn’t he mean “21st century”?
Don’t know if he meant to write 20th century, but the fact is that there is no evidence of man-made GH warming in either century.
But the way he wrote it implies a comparison to the 19th and 20th centuries, whereas I’m sure he meant the 20th and 21st.
All this discussion about temperature is total wasted time and effort. The only so called ‘greenhouse gas’ that has any REAL effect on LOCAL temperatures is water vapour. Water vapour can CHANGE STATE between gas, liquid and solid (ice) IN THE ATMOSPHERE. Get enough of these effects during defined SEASONS in either hemisphere of the planet and you can record a ‘global temperature’.
Carbon dioxide, CO2, cannot do anything like that. It acts as a thin dusty veil shielding the surface slightly from direct sunshine. In the dark CO2 can only continue cooling the local atmosphere until the temperature reaches close to around MINUS 30C. Then and only then can CO2 absorb any energy during the period of darkness but it will already be so high in the atmosphere that the so called RE-RADIATION escapes mostly to space.
At my age I can only hope to live long enough to see justice brought to the perpetrators of this AGW farce.
The efforts of GISS to “cool the past” continue. The Russian station of Ostrov Dikson has a temperature record stretching back to 1918. These rare arctic stations with a long record are having their past rewritten.
In 2011 the GISS record for 1918, 1919, 1920 showed annual means of -11.9 -11.8 -10.3C.
In 2012 these were amended to -12.6 -12.1 -10.7C.
Today I see a further reduction to -13.2 -13.0 -11.7C.
The artificial depression of early terrestrial records results in a spurious warming trend. This is how the claim of global warming is being substantiated.
To access the current data set, here is a clickable map: http://data.giss.nasa.gov/gistemp/station_data/
Clicking on it takes you to stations nearest your click (many with a fragmentary record).
In this blog I show how Iceland’s record has been fiddled: http://endisnighnot.blogspot.co.uk/2013/08/the-past-is-getting-colder.html
One other example. The Icelandic Met Office tell me that for Feb 1901 the Teigarhorn raw mean was -0.2C, adjusted to -0.3C for sound reasons. GISS publish this as -0.9C, “colding” it by 0.6C. http://data.giss.nasa.gov/tmp/gistemp/STATIONS/tmp_620040920000_14_0/station.txt
For the record, Iceland have always taken the mean of temperatures at 08:00, 14:00 and 21:00. This is in contrast to the practice in many other countries of reporting the mean of daily max and min. The shift from -0.2 to -0.3 is thus legitimate homogenisation. GISS’s shift to -0.9C is barefaced tampering; an Orwellian rewriting of the past.
I’d like to know who is making all these changes all over the WORLD. Do they do it by computer? Does it start at NOAA? Or does it start at White Sands? Does it mean that our own government personel is involved or is it just a hand full of people with vested interest? Just like all the non-science activity going on, along with all the reports of “hiatuses”, they will probably just eliminate all the records and use the lacunas. That way no one in the future can do a papertrail. Maybe a plead to the rest of the employees would bring out a real American Whistle Blower!
Hopefully, the GWPF will get to the bottom of this.
The more one reads, the more one gains the impression that the anomaly trend (or bulk of it) is simply an [artifact] of data adjustment/homogenisation.
Personally, I consider that whenever an adjustment has been made to data, then the extend of the adjustment sets the minimum error bar. If past temperatures are being cooled by 2 degrees, this immediately means that the error bar for the temperature data set cannot be less than +/- 2degC since the possibility exists that the adjustment is wrong. Of course, the law of sample size has a bearing but how many station records are adjusted, and what is the maximum adjustment made to each station.
Then of course, there is the problem of station drop out.
Personally, I consider the land based thermometer record to be so horribly bastardized that it is worthless. It was never intended to perform the role to which it is now being put, and heck, it does not even measure the right metric; it uses temperature as a proxy for energy. It is far too crude and overextrapolated and should be ditched.
We should simply accept [that] as far as ocean temps go, we have ARGO (that has its own issues not least short duration), and we have the [satellite] data set (again with issues) but reasonably good global coverage.
Since the atmosphere and climate are on this water world controlled by the oceans. the only useful data set is ocean temperature. All else is largely irrelevant to the assessment of global warming, and measurements of ocean temperature at least measure the correct metric, ie., energy.
I feel this opening credits theme to an old Henry Fonda film to be relevant…
‘
“One thing is quite certain, however: Current IPCC climate models cannot explain what the observations clearly show. This makes the models unsuitable for climate prediction – and for policy purposes generally.”
Welcome to the world of the engineer – where models are only models, theories are just theory and what really matters is what really happens.
And that is why we have engineers who are trained to make decisions where the models don’t work and academics flounder. And if it hadn’t escaped anyone’s attention, the vast majority of sceptics are engineers or other types of practical real-world scientists, and the vast bulk of alarmists are public sector and/or academics.
“… And if it hadn’t escaped anyone’s attention, the vast majority of sceptics are engineers or other types of practical real-world scientists, and the vast bulk of alarmists are public sector and/or academics.” ~ S.S.
Yes, I had noticed that. I hope you have noticed that those of us who teach math are also very skeptical since the entire edifice of “catastrophic CO2 induced global warming” is an exercise in ill logic. Extreme surface warming via “back radiation” does not pass the sniff test and never did. It is against all laws of thermodynamics to claim that CO2 heats the surface. I saw that in the 80s and nothing has come along to change my mind.
CO2 warming the surface is clear, simple to understand, and dead wrong.
Amen!
Did you, by any chance, read my May 26th Guest Post “The Role of Sulfur Dioxide Aerosols in Climate Change?
Would you say that it falls into the same category? It is supported by published data.
Burl,
I missed that one. I just now googled it up and bookmarked it. I’ll read it later today when all the chores are done. I look forward to it.
Thanks for the heads up.
~ Mark
First the climate kooks claimed there was no pause (privately they knew it was happening) and ridiculed (publicly) those skeptics pointing out the pause.
Then they claimed the pause was just normal variation.
Then when it lasted longer than a normal variation statistically could happen with high sensitivity, they started waving their arms: Hidden heat and the deep oceans,
Now they do as they always do and return to the earlier, failed excuse: It never really paused at all.
This is what a failed, non-scientific circular reasoning faith based system does: Endlessly circulate between failed claims, putting off the inevitable while protecting their social position and financial capital.
The corruption of climate science has nothing to do with the physics of CO2 and everything to do with human pride.
All I can say is that I am flabbergasted …. having heard nigh on 60 different reasons to explain the ‘pause’, we are now being told its just an illusion. That’s what he says ??? Its just a f$%#ing illusion !! FFS ! Speechless !
I was watching French reaction to the US prosecuting FIFA on France24 (in the US). One woman commented that the US is using RICO laws that brought down the mafia in the US. The scandal has spread to Latin America, and nations needing to fight corruption there, too. Thus, to bring down another mafia-like organization like FIFA using RICO – AGAIN – is only a very poetic outcome.
Seeing that and reading this thread now, one wonders if the new Republican Administration (ie, President in 2017) will use RICO to bring down the mafia of climate science?
We know that leeching on enormous sums of federal monies is involved, since “climate science” is funded the most, or rather second only to medicine in the US national budget. That isn’t in question.
I can only wish that the new Department of Justice is headed by Senator Ted Cruz – who, as head of Texas’s justice won all his cases before the US Supreme Court! And at Harvard Law, Cruz won the admiration of Professor Alan Dershowitz best student. “Don’t mess with Texas.”
So, Dershowitz’ attack dog is likely gunning for the climate mafioso! (Spread this meme to this paper’s authors – it’s time to see these frauds quaking in their boots! We know they do – the Climategate emails showed us that they will!)
AMO growth phase and global temperature from 1980 to 2010 are compatible.
http://woodfortrees.org/graph/esrl-amo/from:1980/to:2011/plot/esrl-amo/from:1980/to:2011/trend/plot/wti/from:1980/to:2011/plot/wti/from:1980/to:2011/trend
http://woodfortrees.org/graph/esrl-amo/from:1850
IMHO WUWT does the world a valuable service by examining claims for scientific validity, and may prevent some bad decisions being made at every level as a result. The latest article here is a good case in point.
At the same time, the scientists who believe that human-caused warming is real do the world a service by raising the topic for inspection, so that there is awareness and investigation.
Yes, there are some people with impure agendas on both sides of the debate, but it seems likely that most of the scientists in this discussion, regardless of their views, are sincere and well intentioned. (This comment explicitly does not discuss non-scientists; that is a very different topic)
The whole name calling thing is unfortunate – “deniers” and “alarmists”. However, both sides seem to be passionate and sincere in their beliefs. And there is a third side which is not a side at all – the silent majority of scientists who have no position and simply seek the truth. So, this seems to be a healthy debate, where eventually the facts will, one would hope, win. Let the cards fall where they may.
One thing that does not help is when either side look at the record, and then cherry pick to remove some data that does not support their position. The WUWT site frequently accuses the “alarmists” of doing this, which they do. But WUWT seems blind to when articles posted here do the same thing. e.g. a couple of the articles about 2014 being the hottest year (not) basically said you have to ignore all the stuff (Pacific warm spots ect) that made the average temperature warm, and after you do that it is not warmest any more. This is the same sort of nonsense that the “alarmists” are accused of, and is not credible when either side do it.
I think I speak for may when I say that I hope that WUWT keeps up the good work, but also that it would be to the benefit of mankind if WUWT could take the high road, and adopt a scrupulously neutral approach, avoiding name calling and not publishing anything but the facts, or at least serious scientists’ sincere interpretations of the facts, and publishing anything which seems scientifically sound, no matter what its conclusions, without any bias in the filter. In that fashion, WUWT may help the world form a more accurate view, so we can feel our way as a species towards understanding what is going on.
At present WUWT does do an excellent job of bringing relevant info to light, but it appears to be biased and does engage in publishing some name calling and other less than credible stuff on occasion. By removing that bias and being scrupulously neutral, WUWT can do the world a great service.
Keep up the good work.
People misunderstand cherry picking.
One cannot cherry pick data or scenarios to prove something.
However, if a theory is universal, one can chery pick data or a scenario that shows a potential shortcoming with a universal theory. Indeed, that is precisely how most universal ‘laws’ are disproved, such as Newtonian Mechanics. This is fine in 99.9% of scenarios, one has to cherry pick the 0.1% scenario where the ‘law’ breaks down, and reveals a potential problem,
If the the backradiation theory is sound, then any increase in CO2 levels in the atmosphere MUST ALWAYS result in warming unless a saturation point has been reached or unless there is some opposing forcing cancelling out the warming which was otherwise caused by the increase in CO2 levels.
This means that every year where CO2 levels have increase and where there was no corresponding temperature increase that year, an explanation consistent with the theory is required. If no explanation can be put forward explaining the lack of increase in temperature, the ‘theory’ is potentially invalidated.
The explanation may be that there was a volcano resulting in aerosl particulate blocking, or the year was particularly cloudy, or there was a larger than average change in albedo, or there was a La Nina etc. Or of course, there may be no obvious explanation and those promoting the theory fall back on it must be natural variation that cancelled out the warming. If the latter is the explanation then it is known (if natural variation truly did cancel out the warming) that natural variation trumps CO2, and CO2 is not the paramount forcing controlling Earth’s temperatures. At most, it one of a number of factors but cannot trump natural variation. That has profound implications since the late 20th Century warming was claimed to be the result of CO2 simply because no other factor or explanation could be thought of.
Of course, the more examples one cites which suggest problems/short comings with the ‘theory’ the more likely that the ‘theory’ is wrong, in whole or in part.
I agree with you about the name calling, but all debate is useful. Unfortunately, it is human nature to have bias, and nothing would ever be published if the author was obliged to be wholly free of bias, That would immediately invalidate everything that the Team has ever published. It is possible to be biased and still be correct. What is important is for the reader and reviewer to be sceptical and unbiased or at any rate at least open to consider both sides and all arguments. I often say that I am sceptical of each and every argument in support of cAGW, but likewise sceptical of each and every argument that seeks to refute it. Sceptism is a two way street.
We are adults on this site, and most of us ignore name calling and do not rise to the bait or jump on the wagon.
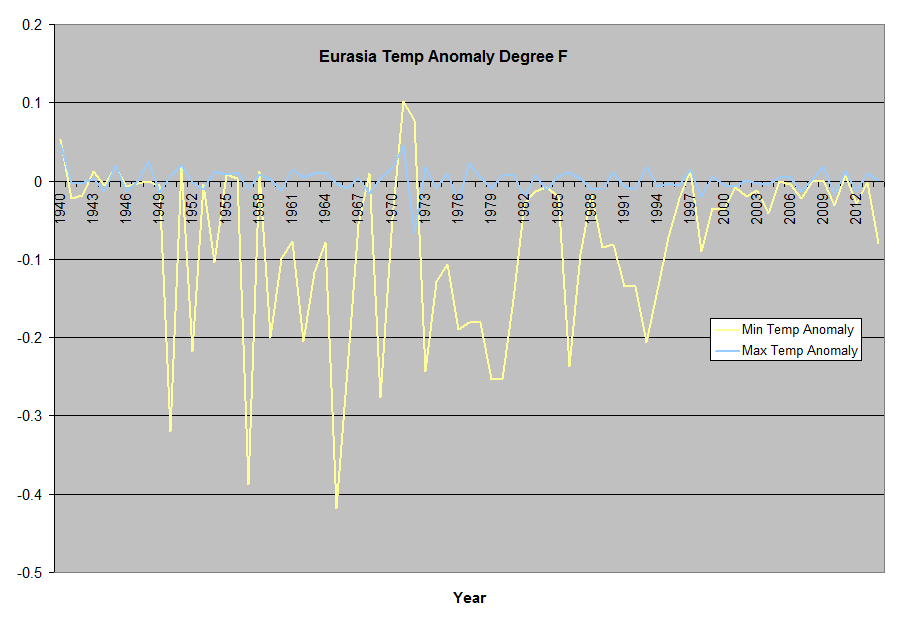
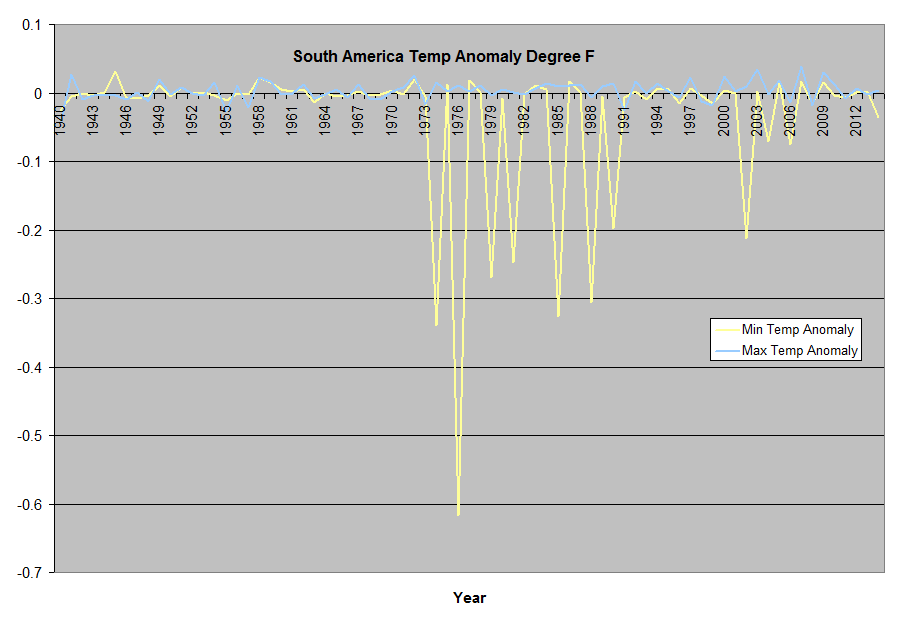
After spending close to 5-6 years looking at the NCDC global summary of days data set, I can identify more than one kind of warming.
1)The average temperature increase of the daily minimum temp.
2)The average maximum summer daily temp.
3)The integral of the average annual max temp.
4)The integral of the daily min to max increase.
5)The integral of the day to day change in max temp.
6)The integral of the day to day change in min temp
7)The change in the annual integral of max temp
8)The change in the annual integral of min temp.
9)The change in average temp (which for most surface stations is only calculated) as compared to a baseline of a multi year average of average temp.
10)The difference between the average daily rising temp and the following nights falling temp.
1 Is just slightly less than 18F, and has change some, but the processing I used (no infilling ) means the station list can changes some each year.
1&2The slope of the daily change is a slight curve peaking at ~1999-2000.
7, shows no Trend in warming since the 40’s.
8, shows no trend, but fairly large regional swings.
9, this is how the published series are calculated.
10,shows an average excess of nightly cooling since the 40’s, excess cooling 50 of the last 74 years, and excess cooling 30 of the last 34 years.
For Co2 to the cause of warming, 10 is not possible.
8 shows surface temp changes are driven from changes in ocean temps upwind.
9 allows any positive change in most of these to show up as warming.
1&2


7&8
Global
US
Eurasia
Tropics
South America
Australia
Africa
10
Daily change in temp
A year and a half’s worth of temps
Daily change in Min,Avg, Max
Mod’s can you release my follow up post it’s sitting in moderation, thank you 🙂
I hope it has some explanation regarding the various charts/plots. What they show, and the argued significance of what they are said to be showing..
Richard, I have some of it explained here.and code and a lot of data here.
As well as a WUWT post.
Average day to day temperature change, for the years 1950-2010


Summer slope, which peaks ~March-April in the NH
Winter slope, max cooling peak ~Oct.
The slope chart is the slope for each year, plotted by year. There is a clear trend, but it also looks like it the peak of a sine wave.
Oh, in these the day to day value is multiplied by 100.
I see that the Climate Liars have the perfect excuse now for their previous “mistake” of accepting that there ever was a “pause”, or what they prefer to call it- “slowdown”, and for their failed multiple attempts to explain it; Toilet’s paper about “seepage”. How convenient. We made them do it.
How pathetic.