There has been a visceral reaction by the defenders of the climate faith to the Mail on Sunday article by David Rose…

…where the Karl et al. 2015 “pausebuster” was not just called into question by a NOAA whistleblower, who [says] procedures weren’t followed, and that the authors “played fast and loose with the figures”, but basically called fraudulent on the face of it because it appears to have been done for political gain. In my opinion the lead authors, Thomas Karl and Thomas Petersen both retired from NOAA in the last two years, made this their “last big push”, so they didn’t fear any retribution.
Having met both of these people, and seen their zealotry, none of the shenanigans brought out by the David Rose article surprised me.
The faithful have been claiming that there’s no difference between the NOAA and HadCRUT temperature datasets depicted in the Rose article, saying it’s a baseline error that gives the offset. I’ll give them that, and that may have simply been a mistake by the Mail on Sunday graphics department, I don’t know.

When the baselines for anomalies are matched, the offset goes away:

BUT….there’s other serious problems in global climate data.
Despite what you might think, NOAA and HadCRUT data are not entirely “independent”. They both use Global Historical Climate Network (GHCN) data, and the GHCN was administered by ….drum roll… Thomas Peterson of NOAA, one of the co-authors of the Karl et al. 2015 “pausebuster” paper.
It’s the fox guarding the henhouse, and as you can see below, the data is seriously shonky.
PAUL MATTHEWS writes at the website CliScep:
The purpose of this post is to confirm one detail of Bates’s complaint. The Mail article says that “The land temperature dataset used by the study was afflicted by devastating bugs in its software that rendered its findings ‘unstable’.” and later on in the article, “Moreover, the GHCN software was afflicted by serious bugs. They caused it to become so ‘unstable’ that every time the raw temperature readings were run through the computer, it gave different results.”
Bates is quite correct about this. I first noticed the instability of the GHCN (Global Historical Climatology Network) adjustment algorithm in 2012. Paul Homewood at his blog has been querying the adjustments for many years, particularly in Iceland, see here, here, here and here for example. Often, these adjustments cool the past to make warming appear greater than it is in the raw data. When looking at the adjustments made for Alice Springs in Australia, I noticed (see my comment in this post in 2012) that the adjustments made to past temperatures changed, often quite dramatically, every few weeks. I think Paul Homewood also commented on this himself somewhere at his blog. When we first observed these changes, we thought that perhaps the algorithm itself had been changed. But it became clear that the adjustments were changing so often, that this couldn’t be the case, and it was the algorithm itself that was unstable. In other words, when new data was added to the system every week or so and the algorithm was re-run, the resulting past temperatures came out quite differently each time.
Here is a graph that I produced at the time, using data that can be downloaded from the GHCN ftp site (the unadjusted and adjusted files are ghcnm.tavg.latest.qcu.tar.gz and ghcnm.tavg.latest.qca.tar.gz respectively) illustrating the instability of the adjustment algorithm:

The dark blue line shows the raw, unadjusted temperature record for Alice Springs. The green line shows the adjusted data as reported by GHCN in January 2012. You can see that the adjustments are quite small. The red line shows the adjusted temperature after being put the through the GHCN algorithm, as reported by GHCN in March 2012. In this case, past temperatures have been cooled by about 2 degrees. In May, the adjustment algorithm actually warmed the past, leading to adjusted past temperatures that were about three degrees warmer than what they had reported in March! Note that all the graphs converge together at the right hand end, since the adjustment algorithm starts from the present and works backwards. The divergence of the lines as they go back in time illustrates the instability.
There is a blog post by Peter O’Neill, Wanderings of a Marseille January 1978 temperature, according to GHCN-M, showing the same instability of the algorithm. He looks at adjusted temperatures in Marseille, that illustrate the same apparently random jumping around, although the amplitude of the instability is a bit lower than the Alice Springs case shown here. His post also shows that more recent versions of the GHCN code have not resolved the problem, as his graphs go up to 2016. You can find several similar posts at his blog.
There is a lot more to be said about the temperature adjustments, but I’ll keep this post fixed on this one point. The GHCN adjustment algorithm is unstable, as stated by Bates, and produces virtually meaningless adjusted past temperature data. The graphs shown here and by Peter O’Neill show this. No serious scientist should make use of such an unstable algorithm. Note that this spurious adjusted data is then used as the input for widely reported data sets such as GISTEMP. Even more absurdly, GISS carry out a further adjustment themselves on the already adjusted GHCN data. It is inconceivable that the climate scientists at GHCN and GISS are unaware of this serious problem with their methods.
Finally, I just downloaded the latest raw and adjusted temperature datasets from GHCN as of Feb 5 2017. Here are the plots for Alice Springs. There are no prizes for guessing which is raw and which is adjusted. You can see a very similar graph at GISS.

Full post: https://cliscep.com/2017/02/06/instability-of-ghcn-adjustment-algorithm/
So the temps at Alice Springs were off by a full 3 degrees in 1880?
They tell you that the man or woman reading the thermometer back in 1880 misread by 3 degrees.
Those who believe that will also believe in airborne pigs.
We aussies have lots of trouble reading those fermomonometer things
Looks like the cats out of the bag as other whistleblowers are coming forward about the temperature misreadings.
http://dailycaller.com/2017/02/06/house-committee-to-push-ahead-with-investigation-into-alleged-climate-data-manipulation-at-noaa/
Hot Under: The linked article gives zero mention of other whistleblowers.
jorgekafkazar February 7, 2017 at 12:00 pm
“Hot Under: The linked article gives zero mention of other whistleblowers.”
This looks like a “mention” to me:
“The committee aide said they had heard from other NOAA whistleblowers as well, but would not bring that evidence forward until given permission by sources.”
Airborne pigs have been an essential element of the CAGW air-land-sea integrated assault on the scientific method since Hanson first addressed an thermo-enhanced house/senate committee. Airborne pigs with stealth capacity have been part of NOAA’s armoury for quite some time now as the Rose post reveals. We can now see very clearly that it has been very challenging to keep these airborne pigs flying and the software is vital, perhaps even more vital than the pigs themselves.
The grant hogs of the IPCC fly all over-constantly! They only touch down to cash cheques and spew garbage science papers that they write up in an afternoon.
Thanks BobM, at least someone actually read the article before replying!
Airborne pigs flew a lot lower in the past. They have since been trained to flyer higher and higher. Any pig caught level flying has been culled.
The Australian homogenisation (ACORN-SAT, post 1910 only) is independent of GHCN I believe, there is good documentation of what they do, Alice Springs was a case study of why adjustments were made, see page 86 of this pdf:
http://cawcr.gov.au/technical-reports/CTR_049.pdf
Temperatures in 1880 may well have been recorded in a poorly ventilated shed, so yes, could be 3 degrees too high.
It slowly changes from 3 degrees to zero, was it a magical shed that read to warm at the start of the readings but slowly got more reliable as time went on?
Too high from what? That’s the problem with all this temperature data. It “assumes” the outside temperature was a certain amount and then adjusts the data. Where’s the evidence? Where was the thermometer? How does one know the “correct” outdoor temperature? If we know what the temperature is supposed to be without data, why gather data at all? (of course, it seems in many cases, they don’t)
According to NT Library, there has been a SS at the Darwin PO from at least Nov, 1889 until the PO was bombed during WW2.
“May well have been”
Famous last words. In other words idle speculation.
“May well have been”
Until you know for sure, you have no justification for making adjustments.
Show me the shed, climan.
climanrecon @10:20; the claim is the historical record shows warming, however, when one looks at the raw data the warming disappears. Thus the support for the CAGW thesis is entirely due to the adjustments. You can claim these adjustments are reasonable but the fact is that when support for a thesis is entirely due to “adjustments” alarm bells should be ringing very loud and clear. It is a huge red flag for confirmation bias. If one cannot show confirmation in the raw objective data the thesis has to be considered shaky at the very best.
When, on top of the above, one sees repeated adjustments (to the earlier adjustments) over time and when each further adjustment increasingly supports the original thesis it is virtually proof of “at best” massive unjustified confirmation bias and “at worst” outright fraud.
Then the data should have been discarded. It is crystal clear it was never fit for purpose and I imagine that could be said of an awful lot if not most of the data around the globe. This whole exercise is based on data that is unfit for purpose that is then manipulated so self serving funding seekers can keep themselves in the manner to which they like to be kept.
Pure speculation.
An adjustment of 3°C means that there is at least ±3°C error margin that should have been carried forward.
” …recorded in a poorly ventilated shed … ”
Bunk. It is adjustment creep.
If the shed was ventilated eg open to prevailing airflow, then the temperature inside it would have been close to the outside temperature. If enclosed or unventilated, likely the interior temperature would have been a lot more than 3° higher. Either way, night temperature would have been the same, as typical sheds (eg uninsulated) loose heat very rapidly after sunset. Some of us have actually spent time evaluating factors like these rather than sitting on our backsides speculating about them. Like Jorge says, show us the shed.
“…could be 3 degrees too high.”
If it was in a simple shed, then got moved to a Stevenson Shed later, then there would be a noticable discontinuity in the recorded data. The fact that there isn’t, is strong evidence that this supposition is false.
The same trick has been done in Greenland, where they take their temperature record seriously. The post-hoc modifications to the official temperature record are even less justifiable than for Australian data.
That pdf says nothing about those adjustments. It refers only to a site move in 1974 and to variations in the height of nearby grass having some unspecified possible effect on readings at other unspecified times.
There is a lot of interesting stuff on Euan Mearns blog.
http://euanmearns.com/the-horrors-of-homogenization/
Yet another reason I never homogenized my work. I wanted to see what was recorded, as I believe they had the best knowledge to affect any required adjustments then, not 80 years later.
May need to search for Alice.
@climanrecon
Your BoM homogenization reference refers to photographs of grass growth and rainfall etcetera after 1974, which in its application could be an interesting separate discussion along with volcanoes, ENSO, UHI and whatnot.
Rather than consider your speculations back to 1880, let’s instead look at available data from the beginning of time according to the Oz BoM (aka ACORN and claimed as ‘World’s best practice’). Their daily max & min data for Alice Springs are available here:
http://www.bom.gov.au/climate/change/acorn-sat/#tabs=Data-and-networks
If you plot the mean from 1910 the BoM homogenised linear trend gives a temperature rise of ~1.8 C.
I don’t know where the GHCN data files are, but I’ve taken the final figure in the essay for Alice GHCN and eyeballed the linear trends for raw (blue) and “corrected” (red) as from 1910:
T rise Blue: ~ 1.0 C
T rise Red ~ 2.7 C
Do you not think it’s odd that GHCN experts think higher than Oz experts about “correction” of Oz data?
Hey look! Don’t trust me. Download the data into say Excel and check it out.
Bob Fernley-Jones
Stevenson’s screen was “reported” in 1864. -Wikipedia.
climanrecon: “so yes, could be 3 degrees too high”
I can understand the individual adjustments and the logic behind some of them. However when you look at the scope of the changes it invariably ends up as them cooling the past and warming the present. How is it even remotely possible for that to be the end result in all of these cases?
Even if done innocently, there would seem to be some motivated reasoning going on. The scientists presume there must be warming, and then go hunting to find it. And viola, indeed, they are finding it. But it is a bias nonetheless.
Time and time again they are cooling the past and warming the present to steepen the slope. To a layperson like myself, that seems extremely suspicious.
It seems like the new database GHCN v4 will fix the instability issue in Alice Springs. More nearby stations give support, and remove the algorithm’s indecisiveness about what the adjustments should be..
Trends in Alice Springs 1941-2016 (for the moment)
GHCNv3 unadjusted: 0.120 C/decade
GHCNv3 adjusted 0.237 C/decade
GHCNv4 adjusted 0.146 C/decade
The GHCNv4 adjustment scraps all data prior to 1941 (unreliable? quality issues?)
https://www1.ncdc.noaa.gov/pub/data/ghcn/v4/beta/products/StationPlots/AS/ASN00015590/
As a validation of the GHCNv4-trend we could use CRUTEM4-data for the gridcell (an average of all stations in it). CRU don’t adjust data themselves, but uses adjusted data as it comes from BoM.
The CRUTEM4 trend for the Alice Spring gridcell (1941-2016) is 0.147 C !!
So, all Batesians, Please don’t hold back the development of science..
GHCNv4 is good!!
Not exactly. The temps recorded in 1880 were off by some number. When you ask the question determines how large that number is/was/will be.
Perhaps that’s because Aussie’s hold their thermometers upside down!
It isn’t that Aussies hold our thermometers upside down. Rather that the rest of the world is upside down. I have a map that proves it.
We all have been yelling about ‘fixing’ the data to make global warming appear for the last ten years. About time that it explode in the faces of the cheaters and liars who pushed global warming when there wasn’t any.
Alternate Facts
Turning flat temp record into a 3 deg C rise, quite a stunt.
Of course stations like Alice have a very high impact being in the middle of massive sparsely populated continent. I seem to recall that Darwin N.T. has similar massive adjustments.
It would probably take very noticeable manipulation of hundreds if not thousands of US stations to have the same impact on global averages as these two Aussie sites.
It did. But worst Australian example is Rutherglen. It is a well tended, well sited agricultural reseach station with no site moves since onset. Shows if anything cooling. Homogenized into warming. Both Darwin and Rutherglen are illustrated in essay When Data Isn’t.
“But worst Australian example is Rutherglen.”
Rutherglen Research is a BoM ACORN station, but it isn’t in GHCN V3.
Nick…maybe true, but the same dodgy, one size fits all, adjustments applied…. For no good reason. Just as well we have good people keeping the original raw data ratger than allow the gate keepers to simply delete it and claim its BEST. Ugh.
Who wrote this program? Volkswagen emissions engineers, perhaps.
+10
Got to disagree on the volkswagon engineering comment. My thought is the software cheat was brilliant against the arbitrary requirements. No animals were killed; No measurement was faked; Not even sure exactly what law may have been broken. Kind of Kirks solution to the Kobayashi Maru simulation.
There’s an argument (that I’d like to see run to ground) that when volkswagon fixes their cheat the overall emissions could go up because of decreased fuel efficiency.
Gotta agree w/taz1999 — anything to get out of bogus “pollution” regulations is commendable — like the hallowed tradition of moonshiners avoiding state/federal taxes in the US.
There is another difference: The VW software engineers/managers broke the law in the USA, the climate data adjusters broke no law. (but the damage they did is far greater and is continuing)
NW Sage- the US does have laws regarding data integrity, “suitability for purpose”, archiving, etc. It was passed in 2001 as part of an appropriations bill(common practice in the US). “(Regulations) that provide policy and procedural guidance to Federal agencies for ensuring and maximizing the quality, objectivity, utility, and integrity of information (including statistical information) disseminated by Federal agencies…”
taz1999- The Volkswagen fiasco was caused by the EPA, since their own regulations required them to substantiate and randomly test vehicles for compliance. The Agency never did that. They wrote the regs to allow companies to self-certify that the cars passed the required tests, which they did. I believe the response was a gross over -reaction to the problem. Under normal conditions the VW diesels involved get better fuel economy but produce more NOx pollutants(real, smog-forming pollution) particularly at highway speeds. Given that some 500,000 vehicles, out of ~253million in use, and that the pollution was on highways, not primarily in cities, the effects have been miniscule in terms of smog and other overall pollution.
Given the egregious rule setting by EPA based on spurious “science”, I’m uncomfortable with blaming Volkswagen’s engineers with anything other that being clever.
The so-called VW settlement for the emissions “scandal” was that VW, a German company, would invest billions in California to switch the state to EVs.
See:
VOLKSWAGEN
Settlement billions to jolt EV industry
Camille von Kaenel, E&E News reporter
Published: Thursday, December 22, 2016
The billions Volkswagen AG is required to provide to electrify transportation as part of its emissions scandal settlement will boost, and in some cases displace, a nascent industry.
“The GHCN adjustment algorithm is unstable, as stated by Bates, and produces virtually meaningless adjusted past temperature data.” – unstable algorithms, meaningless “results” – the essence of the alarmist “climate science.”
Unstable = Unusable……..!!! Only two letters different, but a globe away.
If I’d tried this sort of stunt in my mining and civil engineering work I’d have been out the door that fast my feet wouldn’t have touched the floor.
But then only lives depended on the quality of my work – far less important than saving the world – er – and many very cushy careers.
BJ in UK.
Unstable “scientists” producing meaningless results with enormous funds and causing massive economic damage.
Thank you for continuing to follow this important debate. There are questions about modeling that need to be answered by scientists and others trained in this highly technical field. Enjoy learning from the debate look forward to more.
Any time someone has to resort to models to prove a theory, you know they can’t prove their theory. These models were so bad they couldn’t even predict the pause. To then go back and try to rewrite the past and erase the pause is just so anti-science, it is mind-boggling.
OK.
So the past is constantly changing. An unknowable fluid. Not fixed in reality.
But at least the future is certain.
HAHAHA…welcome to Wonderland!
Reminds me of the fake news from the media, rewriting the past so that Democrats fought for freeing the slaves.
Catcracking February 7, 2017 at 9:00 am
Actually they did, like it or not! McClellan, Porter, heck most of the Generals were democrats.
The so called political Generals were Republicans. Butler, Banks.
Not sure about Grant off the top of my head.
michael 🙂
Grant was a Republican by the time he ran for president. I don’t know about his politics earlier.
“hech they were all democrats”
That might explain why the war took so damlong.
What was the name of that battle after which Lee was allowed to slip away?
That’s right. The Civil War.
There was an alternative party in the north called the American Party, which tried to waffle and kick the can down the road on the issue of slavery spreading into the Western Territories and new states.
The Republican Party at it’s founding was the other alternative when the Whigs disappeared. The north overwhelmingly chose the anti-slavery Republican Party — while the American party only won one state, and subsequently vanished.
Now the Boomers want to replace the Republican Party with a pro-slave south party (libertarians)
Just watch. Now that their parents are dead they will go full on pro-German activists and bemoan our role and victory in WWII just like they did for WWI and the Civil War. IT is going to be like clock work. 3-2-1
“We should never have gotten involved in WWII!” It is coming.
McClellan was as political as Jefferson Davis was. McClellan was definitely and administrator; unfortunately, one who blamed everyone but himself for his failures and retreats.
Politics governed how Lincoln chose his Generals, until Grant kept winning his battles. A fact that Grant’s superior both tried to take credit for and then relieve Grant of his command.
Another truth – not all Democrats were Klansmen but all Klansmen were Democrats!
Some call Republicans ‘The Stupid Party’. They are too kind. However, to be fair, there are a few honorable exceptions.
In reply to “Mike the Morlock”
Republican Generals who later became President:
Ulysses S. Grant
Rutherford B. Hayes
James A. Garfield
Chester A. Arthur- political appointee, quartermaster general of New York State
Benjamin Harrison
William T. Sherman had a brother who was a Republican Senator, but as far as I know, he was apolitical, as I suspect many generals were.- One of my favorite Sherman quotes: .
“Grant stood by me when I was crazy, and I stood by him when he was drunk, and now we stand by each other.”
Anyone who would call the Libertarian party pro-slavery, knows nothing about politics.
And is a complete idiot to boot.
MarkW, try to get out a little more often. Every time the Civil War and Lincoln come up, there are a well-represented group of people who claim that Lincoln was a criminal and that slavery had nothing to do with the War of the Rebellion. They claim that this conflict was merely an issue of states’ rights, and that the federal government was infringing on the rights of the southern states by limiting slavery, which their economy was based on, and that Georgia, Virginia, N&S Carolina, etc. were merely standing up for their right to make their own laws in their own states.
These people often claim to be Republicans but more often than not are now identifying as libertarian. But it needs to be made clear that the founding of the Republican party was in response to the issue of slavery, and Lincoln was the first Republican.
I think you are not paying close enough attention to this very vocal group and you could make a better effort to understand it. Are you trying to say that libertarians never say that the South was right and the War of the Rebellion was not over slavery? Are you trying to say that people who identify as Republicans are not now trying to make Lincoln out as a criminal? In my experience, they are almost always libertarians. I have not met any Democrats who say this, but perhaps you have.
I think you cannot be a Republican and take the side of the Slave South. It is a contradiction.
PS: The US had no business getting involved in WWI. It was a war for the control of colonial empires.
There are many who feel that had the US stayed out of WWI, there never would have been a WWII.
MarkW says, “The US had no business getting involved in WWI. It was a war for the control of colonial empires.
There are many who feel that had the US stayed out of WWI, there never would have been a WWII.”
The Baby Boomers have adopted this ridiculous historical doctrine, so much so that there are even some encyclopedias which cite the victors of WWI as the cause for WWII. But thankfully, not that many.
Other scholars point out rightly that Germany was using the opportunity of war to invade its neighbors and attempt to take over Europe. There were a lot of socialists and German sympathizers who later promoted the view that it was all pointless and that it would have been “six-one-way-half-a-dozen-the-other” if the Kaiser’s Second Reich ambitions had not been contained in Europe by WWI.
By the way Germany never paid on red cent in reparations.
One of the German sympathizers who promoted the view that the Great War was pointless was John M Keynes. That is why I say that all Boomers are Keynesians. Either economically or historically.
Wha does the Civil War have to do with the subject of this blog?
Captain Picard would call that a transient temporal anomaly.
Maybe an alternate time line or a different possible future. All of this gives people headaches—for a reason.
As Chief O’Brian said to himself: “I hate temporal mechanics.”
Perfect summary of all those alarmists!
+1
That may be the best summary of the state of “climate science” today:
The future is known with certainty, while the past continues to be uncertain.
Thanks for the insight.
Can someone tell me why temperature measurements need to go through an algorithm at all?
Some of the usual suspects should be along shortly and provide you with a twisted tale…
Are you seriously asking this question? There is no need for the adjustments except to support the global warming agenda. It can easily by demonstrated that the alarmist global warming agenda has to do with redistribution of wealth and increasingly socialistic control of Europe and America. The alarmist really do want to put the world back to the stone age as a means to reduce and control human populations through the UN.
Hopefully, an axe will finally be taken into NASA and NOAA to get rid of departments that have grown to support this scam. The algorithm discussed here is only a fraction of the deception of those departments and meteorological services around the globe.
I remember during the late 1980s, during and soon after the Reagan years, the left talked of infiltrating the public service to implement ‘change from inside’. I think this was because it had become clear that democracy was not going to give them their their socialist/communist/whatever paradise.
Alexwade
Chinese whispers
noun BRITISH
a game in which a message is distorted by being passed around in a whisper at NOAA.
All stations need to be adjusted to match the accurate stations.
Accurate stations are determined as being those that best match the models.
If you have good measurements and bad measurements, you throw the bad measurements out. Adjusting the bad measurements to match gives a false impression of the number of independent measurements and the overall reliability of the data. Any measurement that is ‘adjusted’ to match other measurements is not an ‘independent’ measurement, by definition.
As one alarmist once told me, they have to use the bad data, because it’s the only data they have.
My response is that a wrong result is worst than no result.
ANSWER: … Al-Gore-ithm (yeah, it’s a tired joke by now, but alexwade might not have heard it yet)
Because global average is computed or estimated, not measured.
“Because global average is computed or estimated, not measured.”
It’s also meaningless.
“Can someone tell me why temperature measurements need to go through an algorithm at all?”
Because otherwise there would be no warming. In many places there would be cooling. And you can’t get grant money for global warming if the evidence shows the globe is cooling.
I have read that the NOAA is going to review itself over this issue. How the hell can that be allowed to happen? Surely the review must be conducted by an independent body. We all know what happened with Climategate when the UEA invested itself, they, of course, exonerated themselves.
Bingo!
It MUST be done INDEPENDENTLY (that word again) to have credibility.
Don’t forger ‘TRANSPARENTLY’
I hear the team from Penn State and Sir Muir Russell can do the “independent” investigation.
It’s not a review to lay blame and punish, it’s to figure out how all involved can keep their jobs and at the end of the day.
Judith Currie appears to be available at the moment! Lots of excellent people she could call on to assist.
In the UK, we don’t get an inquiry until the results of that enquiry are decided.
But it makes perfect sense!
The climate is a chaotic system which is impossible to predict.
They use algorithms which are non-deterministic, and are likewise impossible to predict.
When you think about it, this is exactly what we should have expected all along.
We certainly were given enough clues along the way that something like this might turn out to be the case.
TonyL
You wrote “The climate is a chaotic system which is impossible to predict”
In terms of average global temperatures, it is quite possible to predict, Google Climate Change Deciphered for proof of this.
What rock have you been under, Burl? The modelers and warmistas go to grear lengths to say they do not do “predictions,” just “projections.” And the “projections” run too warm when compared to actual data.
Few even try to assess an “average global temperature,” let alone “predict” it. Hence the widespread use of temperature anomalies.
Of course it is possible to predict, or as Shakespeare has it
“I can summon spirits from the vasty deep”
“Aye, and so can any man. But do they come when thou so callest?
I predict the future all the time when I play poker, or make a bet at the racetrack or on a football game.. Unfortunately, my predictions are not more accurate than random chance.
As difficult as it is to predict future temperatures, past temperatures are even harder to predict. Does anyone know what the GHCN temperature for Alice Springs in 1880 is going to be next week, or the week after that?
In other words, when new data was added to the system every week or so and the algorithm was re-run, the resulting past temperatures came out quite differently each time.
……….exactly
This is why it’s so hard to catch….the algorithm changes it every time it’s run
Stick with this…and bust them for it
Like a fun house mirror: it changes all the time as the frame is warped.
Every. Time.
Reminds me of something like this…
http://imgur.com/6u0fXNH.jpg
Good precision, poor accuracy.
Good point, Tapho.
When I saw Paul Matthews’ top graph with it’s under — OVER — UNDER — OVER misses (Jan, Mar, May, June), I thought of a Navy destroyer overshooting, then undershooting, to find its target. No good photos/videos of that (shrug).
“Long!”
“Short!”
“Long!”
“Short!”
“LONG!”
Sigh.
🙂
Nice shoes. Ruby slippers?
Two linear econometrists were out deer hunting. One, the hunter, held the rifle, while the other was “spotting” with binoculars. Lo and behold they saw a nice buck on a hillside quite some distance away. The hunter aimed and fired, kicking up dust three feet to the right of the buck, but with good elevation. “Three feet right!” exclaimed the spotter. The hunter compensated and fired again. This time the dust kicked up three feet to the left of the buck. “Got him!” exclaimed the spotter.
Hi Janice. OT (sorry). Would you contact me via my blog, I’m not getting through. Cheers. 🙂
I am not disagreeing with Latitude; just placing some context into position.
Normally, as in real world IT, any program that returned different numbers every time it ran, would be cause for employment termination, contract suspension and possibly fines.
But in the NASA/NOAA/NCDC world, not only are senior officers content with such a program, the senior officers trust said program!
How can the senior officers trust a program giving different results on every run!?
When senior officers are unconcerned about obviously wandering program results, then what those senior officers care about must be rock solid dependable every time. So dependable, that senior officers are willing to suffer and spin wandering historic results.
Somewhere in those programs are modules ensuring the past is cooled while the present is cooked.
Those senior officers allowed history to wander because their first demands are met.
model runs are laike a bawx o’ chawklits, ya nevr know what yer gonna git but yer know it’s gonna be warmer.
In the business world heads would roll for this kind of failure. It would make no difference if it was done for some kind of hidden purpose or came about simply by ineptness. And in the military when failures like this occur it leads to a disaster. People die. In the climatology field, the so called scientist are given more money. They go on a speaking tour. They write white papers and books. They get awards. They set-up and go to “conventions” in far flung and exotic places, where they plot new strategies with their political friends. So sad.
It is looking more and more that Tony Heller was not really overstating the corruption of temperature records. Karl et al seem to be channeling Winston Smith in his 1984 job.
Heller has done some things wrong. But he has well documented changes in temperature records over time that exceed the supposed error bars by >2x. The one thing he missed was the US state by state changes when NOAA switched from Drd964x tonClimDiv in 2014. Documented in essay When Data IsnT in ebook Blowing Smoke.
ristvan, would you consider posting that essay up here at WUWT?
I can post some excerpts, but not the whole thing by agreement with my publisher
Rud, I want a paperback.
Tony Heller is
denying climatedenying sciencetestifying in the Washington State Senate environmental committee at the moment (starting 10am PST). The Democrats—ranking or not—do not like it.Tony Heller is
denving climatedenving sciencetestifying in the Washington State Senate environmental committee at the moment (starting 10am PST). The Democrats—ranking or not—do not like it. Because science. Because work-flow. Because government efficiency.(reposted with D-words partially suppressed)
Everything is going to be OK – NOAA is going to investigate itself. 🙂
Think of a District Attorney letting an accused bank robber investigate himself.
pure gold , the entire warmista community will be in uproar that tony heller is being asked to do this 🙂
Might be worth creating a verifiable archive of the versions of GHCN over the years for anyone interested in making comparisons of the changes over time. GHCN is not archive online (take a look at GHCN v2 which now just shows some precip data in the ftp, no temp. It should be archived properly.
I have dated downloads of about 7 or 8 versions of GHCN V1, V2 and V3. Of particular interest to some may be that I have the final official GHCN v2 obtained directly from NOAA in 2013 (it was superceded several years earlier). I obtained this by special request when they stopped archiving it online and have the email trails to support this. I had planned to compare the historical temperature changes over time, as well as the adjustments, not got around to it yet although I do have some big awk scripts that will do a lot of the work.
Anyway, just a thought. NOAA clearly don’t keep archives of the results at different time points, perhaps a collective effort might be a useful exercise.
Steve McIntyre also requested this in a comment at cliscep.
If anybody with the technical knowledge could set up an ftp site or equivalent where people could upload versions of the files that they have saved, that might be a useful resource. Each file is about 12MB.
I have a sporadic collection of about 20 or so of the files, most from 2012.
Try Humlum’s site, climate4you.com. He has a chart showing the changes in the various records just since 2008. For GISS, the changes amount to half or three quarters of a degree!
Hmmm…. i have v1, v2 from 2012, and the first v3 (plus some odds and ends).
Wonder if sourceforge or github (normally used just for computer programs and things like LInux operating systems) would be OK with using them?
Oh, and I’ve got a web site scrape from 2015 for cdiac and http://ftp.ncdc.noaa.gov (plus a recent refresh of it)
https://chiefio.wordpress.com/2017/01/30/scraping-noaa-and-cdiac/
You do all know the UAH and RSS data has been multiply adjusted, don’t you?
Adjustment is a legitimate technique – try and understand it before assuming it is deception or wrong.
Yes, if the is the real reason and if you document carefully all the adjustments. That is what you can ask for UAH and RSS but if you ask same for the GISS, I guess you will never be replied. Phil Jones, the former director of the Climatic Research Unit (CRU) of the University of East Anglia has admitted that they have lost the original raw data of HadCRUT. By accident? Probably not.
So what was the temp at my house today? I thought I knew what it was, but you are telling me that in 30 years some guy behind his computer will tell me I was wrong and it actually was 3 degrees cooler because he needed to adjust it down to create some man-made warming. “We jest some dumb 2017 folk dat dont know how to read tempture, we need smart man n 2047 to tells us wat r temp waz”. Is that what you guys think of people in 1880?
Try defining “adjustment” honestly, Arch Deceiver.
The above article discusses ad hoc, without physical justification, adjustments. That they are not physical is PROVEN by their wild divergence from observed data.
UAH (and RSS, though lately, some of their adjusting looks more ad hoc than physical) only adjusts for physical reasons.
(Source: https://wattsupwiththat.com/2012/05/09/christy-and-spencer-our-response-to-recent-criticism-of-the-uah-satellite-temperatures/ )
Griff,
Fine. But then state the requirements clearly. Review them. Then design the code. Review the design. Then write the code. Review the code. Independently validate and verify (test) the code to ensure it meets the design and requirements. Then follow proper configuration management to track changes to the code. Implement an independent QC function for all the above phases of development. NONE of this was done for the current load of crappy code they are using.
Yes.
Griff, Griff, Griff: We been reading this site for over 10 years, so we do know what goes on.
Two questions for you:
Do UAH and RSS use unstable algorithms?
UAH and RSS use quality procedures. Why don’t NOAA?
Really? what is the difference between scientists working on RSS and UAH and those working with other temp data sets? Please do explain their different methodologies…
And this website has as much political opinion from one viewpoint as it does science… it is a political view, not a scientific or journalistic view (i.e. no fact checking or no seeking of comment from people and institutions quoted or reported on)
Having a political view that differs from yours invalidates the science on this site?
As to the difference, that has explained to you even more frequently than why Germany’s renewable power generation numbers have to be taken with a few truckloads of salt.
“And this website has as much political opinion from one viewpoint as it does science.”
That’s only possible if you, yourself, only have one viewpoint, and perceive the world as having only two – yours and everyone else. Political opinion from the skeptic side is wide and varied, based mostly on observation, common sense, and an understanding of how people and society actually work. The only common unification is against people like you, with your opportunistic ‘facts’, and your devious little efforts to exploit a digitally manufactured ‘crisis’.
Wildly varying unreliable results that almost always lead to past warming suggests anything but legitimate.
Grift knows this, of course. You can’t wake someone who’s only pretending to be asleep.
Griff you are, of course, correct. Some adjustments are needed. Would you please explain why, though, one would see such differences in the past at a single temperature station from month-to-month? And why would data from the past seem to continually change based on adding new data from the present? Shouldn’t the past become stable at some point?
Griff, the point of the post is that the adjustment is constantly changing, by large amounts.
Poor little Griffie.
Try reading the article, this time have a friend explain the big words to you.
It’s not the adjustments per se that are being criticized, it’s the fact that each time the algorithm that makes the adjustments is run, it comes up with different answers, even when the raw data hasn’t changed.
It’s also the questionable fact that every single “adjustment” makes the amount of warming greater. There has never been an adjustment that goes the other way.
I should also point out that many of the complaints deal with flaws in the adjustments.
As always, Griffie is forced to try and change the subject.
Griff,
Bet anyone alive today who experienced the world wide drought in 1936 would be puzzled to know that the temps back then were a lot cooler than today.
wow GrifF, it’s frightening what the cooler temps earlier in the 20th Century caused-
1933: Rare Hurricane Slams Into South Africa
1933: Bitter Winter Weather In Russia & Europe: Snow Causes Wolves To Attack Train
1933: West Australian Heat Wave – “Severest In History”
1933: Heat Waves, Floods, Droughts, Famines Plague China
1933: Spain’s Heat Wave: 130 Degrees In Shade
1933: Heat Wave Causes New Jersey Road To “Explode”
1933: Hottest June In U.S. History – Heat Wave & Drought
1933: 21 Perish During Texas, Louisiana Tornado & Hail Storms
1933: Drought In South Africa – “Worst Outlook For 50 Years”
1933: Flooding In China Kills 50,000
1933: India’s Ganges River Bursts Its Banks – Widespread Flood Damage & Fatalities
1934: 80% of U.S. Suffers From Drought Conditions
1934: “Heat Wave In China Kills One In Every Thousand”
1934: Antarctic Has Incredible Heat Wave – 25 Degrees Over Zero
1934: February Tornado Strikes Several U.S. States
1934: World Wide Drought & Heat Causes Vast Majority of Alps’ Glaciers To Melt
1934: Iowa Heat Wave In May – Pushes Temps Over 110 Degrees
1934: All 48 U.S. States Over 100 Degrees During June
1934: 14 Days of Above 100°F Temps Kill Over 600 Americans
1934: South African Drought Severely Hits Farmers
1934: Nebraska Temperatures Soar To 117 Degrees
1934: Drought, Heat, Floods, Cyclones, & Forest Fires Hit Europe
1934: British Drought Stunts Hay Growth
1934: Worst Drought In England For 100 Years
1934: 7 Days of Incessant, Torrential Rains Cause Massive Flooding In Eastern Bengal
1934: Global Warming Causes 81% Of Swiss Glaciers To Retreat
1934: Canadian Crops Blasted By Intense Heat Wave
1934: “South African Floods Are Unprecedented”
1934: Typhoon Hits Japan Followed By A Massive Tsunami
1934: Record Heat And Drought Across The Midwest
1934: China’s Fall Crops Burning Up During Drought & Heat
1934: Five Million Americans Face Starvation From Drought
1934: Adelaide, Australia Has Record Dry Spell
1934: Gigantic Hailstorm Blankets South African Drought Region
1934: Drought And Sweltering Heat In England
1934: Record Heat Bakes Wisconsin – 104°F
1934: 20 Nebraskans Succumb To Unprecedented 117 Degree Heat
1934: Poland Swamped By Floods – Hundreds Perish
1934: 115 Degrees In Iowa Breaks Record
1934: 115 Degrees Reached In China In The Shade – Heat Wave Ruining Crops
1934: Majority of Continental U.S. Suffers From Drought Conditions
1934: Severe Northern Hemisphere Drought Causes Wheat Prices To “Skyrocket”
1934: Extreme U.S. Winter Weather Leaves 60 Dead In Its Path
1935: Severe Wind Storm Lashes Western States With 60 MPH Gusts
1935: Florida Burns Its Dead After The Most Powerful Hurricane In US History
1935: “The Worst Dust Storm In History” – Kansas City
1935: Worst Drought Since 1902 Has Queensland, Australia In Its Grip
1935: “50 Dust Storms In 104″ Days
1935: France Cooked By Heat Wave
1935: Tropical Windstorm Strikes Texas With 85 MPH Gusts
1935: ‘Black Dusters’ Strike Again In The Texas Dust Bowl
1935: India Hit With Extreme Heat Wave – 124 Degrees
1935: Heat Wave, Drought & Torrential Rains Cause Misery In Europe
1936: “Niagara Falls Freezes Into One Giant Icicle”
1936: February Was Coldest In U.S. History
1936: Italian Alps Glacier Shrinks: WWI Army Bodies Uncovered By Melting
1936: Ice Bridge In Iceland Collapses From Heat Wave & Glacier Melt
1936: Violent Tornadoes Pummel The South – 300 Dead
1936: Dust, Snow & Wind Storm Hit Kansas Region In Same Day
1936: Unprecedented Heat Wave In Moscow
1936: Ukraine Wheat Harvest Threatened By Heat Wave
1936: 780 Canadians Die From Heat Wave
1936: Iowa Heat Wave Has 12 Days of Temperatures Over 100 Degrees
1936: Heat Wave Deaths In Just One Small U.S. City: 50 Die In Springfield, IL
1936: Missouri Heat Wave: 118 Degrees & 311 Deaths
1936: Ontario, Canada Suffers 106 Degree Temps During Heat Wave
1936: Alaska’s 10-Day Heat Wave Tops Out At 108 Degrees
1936 : Record Heat Wave Bakes Midwest; “Condition of Crops Critical”
1936: Midwest Climate So Bad That Climate Scientist Recommends Evacuation of Central U.S.
1936: 12,000 Perish In U.S. Heat Wave – Murderous Week
1936: Single Day Death Toll From Heat Wave – 1,000 Die
1936: Iceland Hurricane Sinks Polar Research Ship Filled With Scientists
1936: Severe Drought & Disastrous Floods In Southern Texas
1936: 20,000 Homeless In Flame Ravaged Forests of Oregon
1936: Northern California Seared By Forest Fires Over 400-Mile Front
1936: Tremendous Gale & Mountainous Waves Pound S. California – 7 Persons Missing
1936: Glacier Park Hotel Guests Flee As Forest Fire Advances – Worst Fire In Years
1936: Iowa Christmas Season Heat Wave Sets Temperature Records – 58 Degrees
englandrichard — Great list! Thank you for sharing!
Really? This tired old 1934 chestnut?
What we are looking at is a repeated series of high temps and weather events clustering over recent decades indicating a warming trend…
It does not matter if once we had some anomalous event as high or as cold or as windy… what matters is a trend and a change in a trend.
I refer you once more to the arctic sea ice…
Chestnut: A fact that Griffie can’t refute but still wants to ignore.
Griff February 7, 2017 at 11:13 am
I refer you once more to the arctic sea ice…
And I remind you of arctic ice 1940s, Pacific to Murmansk, Tankers and freighters, no ice breakers no radar.
Also using Kaiser liberty ships. Can’t do that today. Even icebreakers get stuck.
The last 25 yrs? ho-hum, nothing extreme or uneventful occurring.
michael
Oh and do read a bit of how the liberty ships were constructed, if there was any amount ice they would not have serviced the journey.
nah, the tired old chestnut is trying to con the the world that there is any warming of significance.
Seems like the 1930s incidences of extreme weather were worse than today. Today we have year after year of bumper crops due to benign weather- oops a bit of a thorn in the side for the comedian Bill Nye.
giffiepoo and his Arctic sea ice fantasy: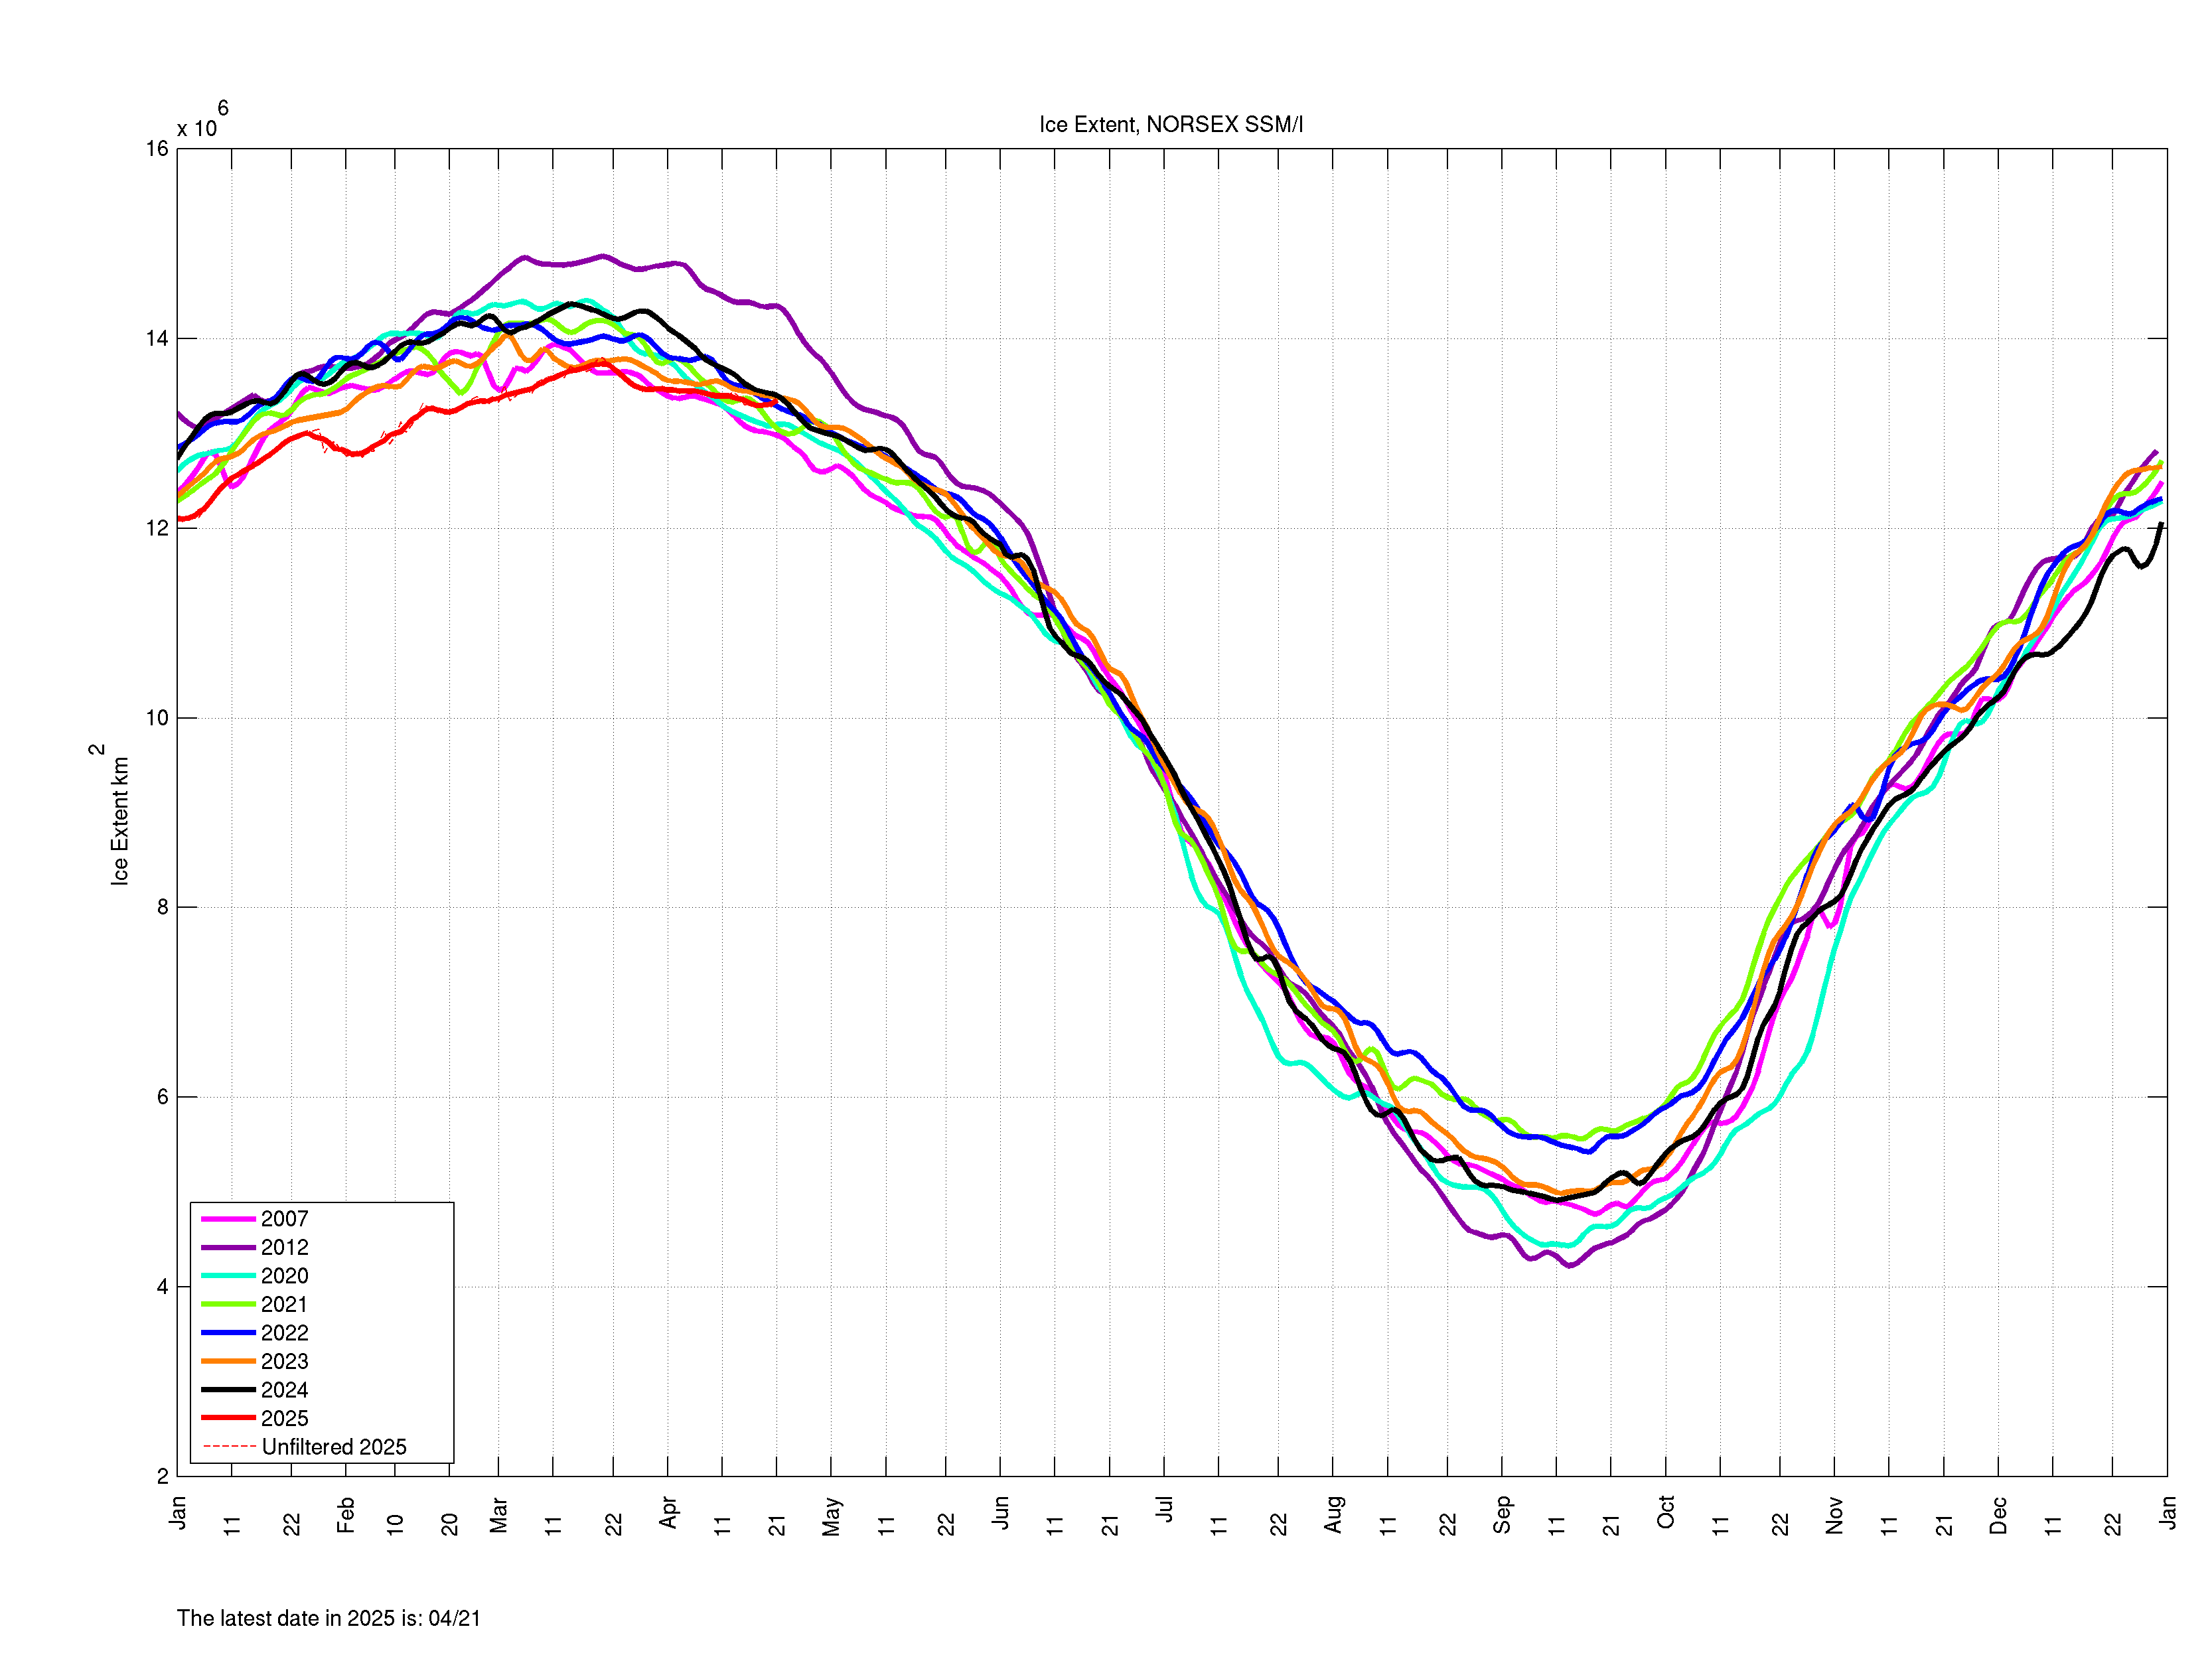
 ?zoom=2
http://wermenh.com/wuwt/cryo_compare.jpg
I’m just a regular sod.
Whether there is deception or error is irrelevant.
The more iterations, the more obscure the original state.
Adjustment is a legitimate technique – so long as it is applied consistently through the data set, that is not what is happening here. This is not adjustment, this is alteration of data. Selectively. You cannot change data. EVER.
I still don’t know why their algorithm even touches the past data. Once the site data is verified and any TOBS taken into account on a day-by-day, site-by-site, one-at-a-time basis, then the agreed upon spatial homogenization performed, the data should never be looked at again. When the new daily data comes in it should be site-by-site quality checked, added to the database and processed. The results for that day should then be added to the top of the daily file for continued plotting. Any “homogenizing” should only touch TODAY’S data and it should forever be locked in. The only exceptions would be for late arriving data sheets, which would necessitate rerunning the days covered by the new data only. Homogenizing over the TIME domain is an abomination.
Let me know if you’d allow your bank to adjust your balance using the same methods.
Caligula Jones banks adjust balances all the time with various methods. They commonly refer to these “adjustments” as FEES
There’s also interest. I think I got 5 cents last year.
Martin and Mark: I stand corrected. My money stays in my account long enough for me to wave at it goodbye. They charge me $3.95 a month for this privilege. Except on those months where they adjust it, always upwards, for my having the audacity to actually get at it.
Hang on, my bank balance actually affects something in the real world. Namely, me.
How is that like global temperature?
le·git·i·mate, adjective: conforming to the law or to rules.
Agreed, but whose version of the law or whose version of the rules …? If the law or the rules change sporadically, then this does not lead a person to nurture compassion for understanding, except for understanding deception.
The problem appears to be with the seemingly sporadic nature of the corrections, which logically leads one to question what law or rules are being applied — chaos theory? … tossing beans in the wind to see which one lands where? … flipping a coin that day? …
giffiepoo is making false claims again.
Adjustment is never a legitimate technique.
Even corrections, which in the accounting world are called adjustments, must never touch the original record.
Corrections are maintained separately with full documentation for the correction; e.g. late payment, transposed input, etc.
Reports may include corrections, but the report will always note the corrected numbers along with information on specific details.
Again, the original raw data is never changed!
Nor are generic rationale’s allowed; e.g. TOD (“Time of Day”) or TOB (“Time of Observation”) may be a generic title for tracking a correction, it is not a sufficient rationale.
Especially egregious is using a TOB title while assuming a specific quantity of change. Without full documentation on how a specific quantity is arrived at, it is specious assumption.
Filling in missing numbers is also bogus. If the number is missing, so be it! Filling in vacant spaces is akin to assuming mid-ear vacant spaces can be filled.
Using distant temperature stations is another specious reason for changing numbers. A major reason that the Arctic temperatures are so skewed is using temperatures from distant land based population center temperature stations.
Years ago I tracked 2 different locations that GISS used and downloaded their numbers each month. One of the locations was a local rural location and the other was the Charlotte, NC. Interesting was that the Charlotte location had many recent months that were 999 which meant incomplete data. I was skeptical about how a Major city would have so much missing data, anybody that watches the local news knows that you get the temps for your city every day. Well after about a year of doing tracking them they once again came out with another 999 for the Charlotte. I looked at many sites and they all had data for every day that month. Well GISS finally did their infill for data for that month and surprise, surprise GISS created an extra 2 degrees of warming for that month compared to what was recorded by every other site that had the daily numbers and didn’t FAKE numbers. After that I quit tracking GISS as it confirmed my thoughts that it is corrupt.
AtheoK writes: “Even corrections, which in the accounting world are called adjustments, must never touch the original record.”
This has been common dogma in every scientific discipline I’ve ever been associated with. An absolute rule. Truth. It’s written into textbooks; never change the original data and never ever lose it; either has been a cardinal sin in every investigative science project I’ve participated in. One of the fundamental lessons taught me from day one.
My first experience with investigative science was actually at NASA, at Ames Research Center in the 1970’s, which makes this so poignant, and my job at the time was to “spin tapes”. We had lab data that had been recorded on magnetic tape, a media that degrades over time from magnetic bleed through between the physical layers of a reel. To combat this and to preserve it as long as possible, every 5 years the tape had to be mounted on a drive, spun onto an empty reel (think “fast forward” without reading it), then rewound and replaced in the archive. We had thousands of reels of tape. Occasionally we’d get a request from another institution, usually a university, for a copy of some data set and it would be spun during the copy, but we spun them every five years just to be certain they didn’t decay faster than it had to. Eventually optical storage was invented and that wasn’t needed anymore, but I’d long since graduated to better things by the time that happened.
Preserving the primary source data is a cardinal rule. It’s never changed. If an investigator wants to perform a transformation on it, that’s done on a copy and never replaces the original. These folks have violated a principal rule of scientific investigation and should be fired for incompetence. There’s no excuse for it.
I think everyone understands the need for adjustments, but to adjust buoys measuring SSTs so that they are nearer temperatures measured be taking buckets of water at sea inlets is bizarre.
Paul Matthews is Associate Professor & Reader in Applied Mathematics, Faculty of Science, Nottingham University. He knows his subject.
Thou must not question the expert.
If you want to see the adjustments in action, go to:
https://data.giss.nasa.gov/gistemp/stdata/
Where you can click on stations and see the changes. I tried clicking on stations with long series (> 100 years) and it certainly seems to me as though the past is being cooled. Tried Valentia in the SW tip of Ireland, Plymouth in southern UK of Funchal out in the Atlantic.
Can anyone explain to me the physical reason why temperatures in the past were recorded too high relative and need systematically lowering? I keep asking this question and no-one ever answers….surely cannot be too hard to answer with a back of the envelope explanation. After all, the adjustments to GHCN account for bout half of the warming over the 20th Century….what is the physical cause? Surely UHI is the biggest problem – but that goes the other way when corrected?
Seems to me I saw an article that said a good deal of the adjustment is “time of day” adjustments. It seemed a good balanced article that made a good case for that adjustment. But I’ll leave it to those who have worked in depth on analyzing the validity of such adjustments. However, I have yet to see any work that justifies the associated margin of error – I don’t see how you can make those kind of adjustments without a significant increase in the margin of error associated with the now adjusted measurements.
That affects only some stations, only in the US. Not Rekjavik or Valentia.
gnomish! Applause! SPOT on.
Except…. Except that the cut-and-paste pet shop clerk was FORTHRIGHT and HONEST about what he was doing…. (still — great allegorical video choice little sort of like a gnome 🙂 )
Tony Heller did a ToBs analysis and found it made little difference. Adjustments were not justified
Whenever an assumption is made then justified as a correction to a datum, that is falsehood.
Exacting measurements are required to determine what, if any, correction should be made to a datum. Even then, the original observation should not be changed nor obscured.
NOAA/GISS/NCDC are apparently quite content with a very slapdash methods for determining corrections.
What they should be using is a “test engineer” for designing, testing and then using approaches for comparing, tracking and determining potential corrections.
Any “adjustment or correction” is admission to large error ranges. Errors that are never carried forward into their alleged global anomalies.
Can we have our grant money back from all the scientists who published papers on the (50) reasons for the pause when, apparently, it never existed! They must feel pretty embarrassed having wasted all that time.
Griff, so for those of us who have not noticed any change in temperature, would you mind if we did not have to pay for climate scientists to keep playing with their computer models and games? They don’t seem to fulfill any useful purpose.
“Adjustment is a legitimate technique.” And a necessary one. Fine.
But there are reasons and rules for adjustments. Legitimate reasons, such as accounting for station moves and time of observation changes. And illegitimate reasons, such as, only sometimes making one lone “outlier” station “match” the “correct” record of other nearby stations — if the “outlier” is lower than the the “correct” station records but choosing NOT to adjust an “outlier” if the data seems to be lying high.
The whistle blower claims the rhyme reason and rules government the release of this report was based on politics rather than established data management techniques. Maybe so, maybe no. But to argue that getting the same answer twice proves that the data handling was “correct” is a fight we’ve had since Wegman testified against Mann. “Right Answer plus Wrong Method” is less than “Science.”
Getting the same answer twice is less of an achievement when one of the comparisons is derived from the same dataset being scrutinised.
Not much better: the others were all told something to the effect that “you will find 10 C of warming per century. that’s the most popular number, therefore right”. Oddly enough, they all found a similar amount of warming.
This is probably just the result of poorly written/buggy code. That’s what you get when you assign graduate students with little to no software education/experience into developing software. I can understand why the models are not properly designed, developed, and tested using industry standard processes, since they are process models originally intended for research purposes only. But from the beginning the temperature data sets were intended to be used as a base input into not only further research, but for making policy decisions. It is inexcusable that they were just hacked together by a bunch of unqualified academics that couldn’t write a decent phone app, let alone something of this complexity. This requires a redo, from the ground up, by an experienced software development group.
Absolutely hear hear!!!!
+1000.
But why would they want to redo it when your aim is to try and find something wrong with it?
It does not need a “re-do”. More than enough money and time has been wasted on this garbage science. Fire them all. Throw all the research in a dumpster. There is no indication that we are experiencing any unnatural warming. Most unfortunate, as here in Western Canada it is -23 with a lot of snow!
I disagree. There is value in recording climatic data and making it available to the public. It just has to be done correctly and in a transparent manner. And contrary to popular belief, most of the raw data is still available; it just needs to be collected and collated. This isn’t rocket surgery people. It’s basic data collection and record keeping.
Just because some unqualified people did a poor job of it in the past does not mean it can’t (or shouldn’t) be done properly now.
Quick, somebody call Jon Gruber.
I think he knows someone who is good at writing programs, I believe they wrote the healthcare software which exploded on contact.
Paul Penrose writes: “This requires a redo, from the ground up, by an experienced software development group.”
But if they’ve “lost” the original data we can’t recover and start over from 1885, 1910 or 1979. We have to start over from now.
We’ve left the fox to guard the hen house, and with the anticipated results. “The dog ate my homework Ms. Peachtree! Please don’t make me stay after school!” is what we can expect. These folks obviously have no integrity or accountability and they’ve been allowed to do whatever they please for over 30 years. It’s way to late for a do over.
The only reasonable thing to do is reverse all policy decisions made on this subject since the 1960’s and begin collecting data again, this time (hopefully) with improved security and a verifiable chain of custody. If the data have been irretrievably lost and irreversibly corrupted there’s just no way to start over from where we were 40 years ago. That horse has left the barn.
There is no need to retrieve or redo any lost data. .
Climate Change is really VERY simple.
It is caused by the reduction in dimming tropospheric SO2 aerosol emissions, as I have proved in.my post: Climate Change Deciphered (do a Google search).
Carbon Dioxide (CO2) has NO climatic effect
All that is needed to be done to prevent future warming is to halt further reductions in anthropogenic SO2 aerosol emissions.
As would be expected, Increasing emissions will cause cooling
(The “rule of thumb” is .02 deg. C. or warming or cooling for each net Megatonne of change in global SO2 aerosol emissions)
.
Most of the raw data has not been lost. Phil Jones may not have the original data that he collected from all the weather services around the world, but they still have what they handed over to him. So it just needs to be collected and collated again – this time doing a better job.
This historical temperature data still has value, and that value extends far beyond the CAGW conjecture. Let’s not conflate the (real) data with the misuse of it.
Come on now. Having political activists in control of the data was always problematic. Government science is by its very nature subject to political manipulation. That should not be in dispute between skeptics and alarmists. It is after all the reason for panic in certain quarters.
That this problem can only occur in one direction is a silly proposition. Remember recently released felon John Beale was doing
important work at the EPA while lying about everything. Do you beleive that this did not include his work.
If the algorithm is that unstable, it cannot be used.
The algorithm should have settled down by now for older temperatures, in particular, and not be constantly reassessing all the close-by stations. I mean you can get some new data covering the last few years and maybe that changes the pair-wise homogenization process for recent years, but why would 100 year old records be changing just because of an algorithm.
What kind of algorithm changes the old data … ever? There may be justification for correcting it, but is that not a manual one-time thing based on the unique aspects of each surface station?
Someone once studied database pricing errors at grocery store checkouts and found they almost always favored higher profits for the stores.
Sounds like the same guys are programming NOAA software now.
http://www.infiniteunknown.net/wp-content/uploads/2014/01/Global-Warming-Cartoon.jpg
“Adjustment is a legitimate technique – try and understand it before assuming it is deception or wrong”. Right! Except that the adjusters always adjust in the direction that supports their global warming/climate change conjecture, i.e., adjust the past down, adjust the present up. If I toss a coin that always comes up heads, I wouldn’t be surprised if somebody suggested I wasn’t using a balanced coin.
Hey Trebla! Yes, Griff says: “Adjustment is a legitimate technique – try and understand it before assuming it is deception or wrong”.
Griff doesn’t seem to realize, we DO understand how adjustments are made. That’s why we are saying that it is wrong.
Trebla February 7, 2017 at 8:36 am ?width=800&height=600&carousel=1
“Adjustment is a legitimate technique – try and understand it before assuming it is deception or wrong”. Right! Except that the adjusters always adjust in the direction that supports their global warming/climate change conjecture, i.e., adjust the past down, adjust the present up.
The paper referred to in this thread appears not to do what you say.
Karl et al. 2015
Hey Phil.! Yes, you are correct. It would be more accurate to say “the adjusters OVERWHELMINGLY adjust it in the direction that supports their global warming”. Saying “always” instead of “overwhelmingly” is a slight exaggeration. It is like saying that a card shark “wins every hand of poker!” when in fact he only wins 98% of them.
In the case of the Karl et al paper the adjustments did, in fact, subtract out some of the previous adjustments, but it also allowed Karl to claim (falsely, as it happens) that the warming pause never happened.
“Saus” should be “says”.