Guest essay by Mike Jonas
In January 2012, my article “Peak Oil – the R/P Ratio re-visited” was posted on WUWT. 3 years on, maybe this ever-controversial subject is worth (re-)re-visiting.
In 2012, I said that it was getting ever more difficult to increase production, and that I suspected that we were already at or close to Peak Oil, but that it was still mathematically possible that Peak Oil was many years away. Do I still think that? In a way, yes, but … well, read on …
In this article, I look at the major factors affecting oil supply, look at past oil market behaviour and how the future may develop, see what lessons can be learned from Hubbert’s Peak, and speculate on when Peak Oil will occur and what it may feel like.
Some of the controversy generated by the 2012 article came from different interpretations of “Peak Oil”, so this time, I will start with the definition and a bit more background.
Definition of “Peak Oil”
The definition I am using is simply :When the rate of oil production reaches its maximum.
Please note:
· In this definition:
Peak Oil is not : “when we run out of oil“.
This is not a useful definition, because we’re not going to wake up one morning and find that yesterday’s oil has all gone.
Peak Oil is not : “when we can’t increase the rate of oil production“.
This isn’t very useful either, because “can’t” is always open to argument.
· The period over which the maximum is determined is not specified, so this still isn’t a precise definition. Certainly, any period less than a year is irrelevant. We very likely won’t know when it was until several years afterwards.
· The reason for oil production reaching its maximum is not specified, and possible reasons will be discussed below.
· I am not talking about fossil fuels generally, and I am not talking about oil and gas. I am talking specifically about oil. That does include gas liquids and “unconventional” oil, but not biofuel. (“Unconventional” oil is described later.) s` qA
· Peak Oil is not necessarily a disaster, it could even be a positive. This also will be discussed below.
One idea which surely is not open to argument is the fact that oil production will peak. Here is a long term graph of past and predicted future fossil fuel production – peak production rate is defined as 1, and the red star represents where we are now (or were recently):

Figure 1. World Total Fossil Fuel Consumption, past and predicted – the long view. [1]
Even if those future estimates are very inaccurate, it is inconceivable that fossil fuel production can keep increasing for thousands of years. The graph for oil must fit inside the graph for fossil fuel.
But predicting Peak Oil has always been an unrewarding exercise. As critics love to point out, various people have predicted Peak Oil for over a century and have been wrong every time.
Factors affecting oil supply
The principal factors affecting oil supply are:
- Geology
- Politics
- Demand
- Price “The solution to high prices is… high prices.” – T. Boone Pickens (h/t John Garrett)
- Technology
Geology is obviously a factor – geology dictates much of where the oilfields are, how much oil is present, its quality, and how difficult it is to extract.
The other factors are all interdependent, so it is arguable how much impact each factor has.
· Many if not most oilfields now belong to nation states, not to oil companies. Consequently many of the decisions affecting oil supply are political. There are also involuntary political impacts such as wars.
· Demand has grown fairly steadily for many decades, due to living standards increasing in developed nations and many other countries accelerating their economic development.
· To the extent that supply is flexible, production tends to be driven by demand.
· Price is the major balancing factor. High oil prices increase the attractiveness of bringing new sources into production, but can also suppress demand. Low oil prices increase the attractiveness of using more, ie, they tend to increase demand, while discouraging high-cost sources of supply.
· Technology is a two-edged sword. Oil production technology has seen tremendous advances since the start of the oil era, allowing ever more oil to be found and produced, thus boosting supply. But technology also helps to make oil use more efficient and other energy sources more competitive, thus reducing demand.
Should I have listed Discovery as a major factor? Maybe I should, but I chose to regard it as a subset of Geology, perhaps with Politics, Demand, Price and Technology as modifying factors.
Hubbert’s Peak
Most people are by now familiar with Hubbert’s Peak. M King Hubbert’s theory [5] says that for any given geographical area, from an individual oil-producing region to the planet as a whole, the rate of petroleum production tends to follow a bell-shaped curve. In 1956, Hubbert famously predicted that US oil production would peak in about 1970. His prediction was remarkably accurate over the next 50 years.

Figure 2. Hubbert 1956 prediction vs US Oil Production . [5]
Predictions that are that accurate over 50 years are quite rare.
For the global bell curve, the upward slope tends to be limited by demand, ie. as much as can be sold at a reasonable price. The downward slope, for regions and fields that have reached it, tends to be limited by geology, ie. the maximum production rate consistent with maintaining reservoir viability. [NB. I’m only referring to general tendency. There are many exceptions of course.]
The overall bell curve is the sum of its components, each of which is a bell curve. Thus a region’s bell curve is the sum of its fields’ bell curves, and each field’s bell curve is the sum of its individual wells’ bell curves. This pattern is demonstrated in, for example:

Figure 3. Historical extraction of crude oil by discovery/field for the Norwegian Continental Shelf (NCS), 1970-2013, plus forecast. [6]
Note that the “bell curves” for the individual fields have a wide variety of shapes. Note also that once a peak has been passed, even a very large field like Johann Sverdrup (Norway’s 4th-largest discovery at 2.9bn barrels) may only produce a brief delay in the decline.
Unconventional Oil
One notable exception is the USA, where very large quantities of “unconventional” oil have recently become viable thanks mainly to technological advances and high oil prices: This surge in “unconventional” oil production can be seen from around 2007 in Figure 4:

Figure 4. USA oil production 1965 to date. [2]
What is “unconventional” oil? A-simple definition is “oil collected by other means than simply drilling for it” [7]. Willis Eschenbach put it differently:
The strange part is, when you open a barrel of unconventional oil to see what conventions were broken in its creation, you find it is indistinguishable from conventional oil. [8]
Both are right, in a sense, but I’ll stick loosely with the “unconventional” idea simply because it’s a useful word for the oil which even under current technology is much more difficult and expensive to produce than the oil we’re used to that satisfied all demand until recently. The definition is loose, but some pictures [9] might help:

Figure 5a. An oil rig blowout in Turkmenistan. The easiest “conventional” oil to produce (with care!) is under pressure.

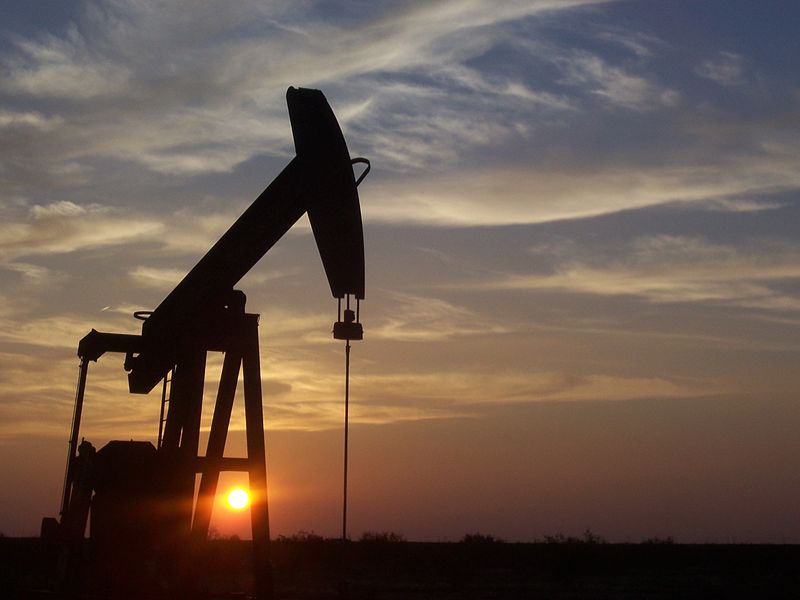
Figure 5b. West Texas pumpjack. Some “conventional” oil has low pressure and has to be pumped out.

Figure 5c. “Unconventional” oil such as the Alberta Tar Sands are currently being mined.
“Unconventional” oil also includes shale oil, which can be drilled for rather than mined, but tends to be in very tight rock formations that are difficult and expensive to produce from, and tends to require techniques such as horizontal drilling and fracking [11].
Past Oil Production
Before I show the graph of past oil production, it will be helpful to show the graph of oil price. It’s from data in BP’s June 2014 report [2], so doesn’t show the recent fall back towards $40.

Figure 6. Oil Price from 1965. [2]
Looking at the first half of the graph –
· The first major disruption in this period occurred in 1973, when OPEC quadrupled the price of oil.
· The second was the Iranian revolution in 1979 and the Iran-Iraq war starting in 1980.
· These disruptions helped to bring on a massive recession in 1981-2, the most significant recession since the Great Depression.
· Reduced demand because of the recession resulted in the oil price fairly quickly returning to “normal”.
In the second half of the graph:-
· For a decade or so after the start of the 21st century, supply struggled to keep up with demand and the oil price went up …
· … apart from a short sharp dip at the time of the GFC.
· Not shown is the recent sharp price decline, caused by surging US “unconventional” oil production and exacerbated by Saudi Arabia’s decision to maintain high production.
But in spite of the economic booms and busts, it is clear that although the oil price has been volatile at times, oil demand and/or supply have been relatively inelastic:

Figure 7 – Oil Production.[2]
Oil Reserves
Oil reserves are very much a function of technology and price. A generally-accepted definition [3] of Reserves, also called Proved Reserves or Proven Reserves, is:
the estimated quantities of oil which geological and engineering data demonstrate with reasonable certainty to be recoverable in future years from known reservoirs under current economic and operating conditions
In my 2012 article, I paid too much attention to proved reserves. That was partly because I was responding to a Willis Eschenbach article about the R/P Ratio (Reserves / Production), but mainly because in my mind I overestimated the importance of Proved Reseserves. What really matters is the Technical Reserve (“TR”, the total amount of oil that might be able to be produced at some future time), rather than the more narrowly defined “Proved Reserves”.
So – how much oil is there? That number is surprisingly difficult to find (well for me it is, anyway). The USA is it seems the only country that tries to estimate it. The U.S. Geological Survey (USGS) puts it at 732 Bbbl excluding the USA (565 conventional, 167 gas liquids) [12], plus 42 Bbbl in the USA (32 conventional, 10 gas liquids) [13]. But unfortunately USGS says “Unconventional oil and gas resources, such as shale gas, tight oil, tight gas, coalbed gas, heavy oil, oil sands, may be significant around the world, but are not included in these numbers.“.
Total USA shale oil is put at 2,175 Bbbl plus “significant volumes of heavy oil in the oil sands of northeast Utah” [14]. Outside the USA, total unconventional oil is put at 335 to 345 Bbbl, but with much information missing [15]. [Note: The source here is Wikipedia, but (a) the data isn’t particularly controversial so Wiki should be OK, and (b) accuracy isn’t very important, only the general level.]
Total oil production to date is about 1,440 Bbbl [16].
A possible estimate of global initial TR is therefore about 5,000 Bbbl:
| Bbbl | |
| Past production | 1,440 |
| USA conventional | 32 |
| USA gas liquids | 10 |
| USA shale etc | 2,175 |
| Non-USA conventional | 565 |
| Non-USA gas liquids | 167 |
| Non-USA shale etc | 345 |
| Total | 4,794 |
Peak Oil date
Looking back at Hubbert’s Peak in Figure 2, it is striking just how accurate Hubbert was for 50 years, and equally striking that after 50 years of impressive accuracy, it went badly wrong (see the production surge from 2007 in Figure 4). So – what happened, and are there good lessons to be learned?
If you read Hubbert’s paper [5], you will note that he bases his estimates on very few numbers. The most important number was the total amount of oil. For the graph in Figure 2, total oil in the USA was put at 200 billion barrels (“Bbbl”). Hubbert didn’t actually know what the correct number was, so he estimated for 150 Bbbl and for 200 Bbbl. The graph for 200 Bbbl proved remarkably accurate.
Where Hubbert went wrong (50 years later) was that he did not make proper allowance for the “unconventional” oil, even though he knew of its existence. The combination of technological advance and high oil prices resulted in a massive surge in USA production of “unconventional” oil from around 2007. There was therefore a major departure from Hubbert’s predictions for the USA (Figure 4).
Put simply, all we have to do in order to correct Hubbert’s predictions for the surge in “unconventional” oil is to update the figure for total oil TR. The other principal figures Hubbert used were current production rate and rate of demand growth, and of course new values for those should be used too.
Hubbert put initial global TR (today’s TR plus all past production) at 1,250 Bbbl, and predicted global Peak Oil in 2010, based on the theory that Peak Oil occurs when about half of the TR has been produced. 2013 production rate was around 32 Bbbl per year, so using Hubbert’s theory and our new figure for TR, we can do a rough calculation on an “all other things being equal” basis, of when Peak Oil will occur (see spreadsheet [16]):
If global initial TR was 5,000 Bbbl and future production growth rate is 3% pa, then Peak Oil occurs around 2036. At lower growth rates (2%, 1%) the date is only slightly later (2038, 2041). The truly fascinating aspect of these figures is that a quadrupling of initial TR from 1,250 to 5,000 Bbbl only adds about 30 years to the likely Peak Oil date.
Over the last few decades, oil production has grown at around 1.3% pa [2] on average. In spite of the recent surge in USA “unconventional” oil production, global oil production has slowed a bit in recent years to about 1.1% pa. With USA shale/tight oil production expected to decline from 2020 [17], it may be difficult to maintain a positive global production growth rate from then on. Peak Oil is when the global growth rate hits zero.
Variations
The above calculation putting Peak Oil at around 2036 is simplistic, of course. It implicitly contains some big assumptions about future demand, technological advances, massive mining operations from Alabama to Utah, and a few others no doubt. It is probably reasonable to view it as giving an upper limit.
But maybe we can get more realistic if we look at some of the major factors again:
· Politics : Already, fossil fuels are under savage attack from the Greens worldwide. Hopefully, sanity will prevail, but there is clearly some risk of a politically-enforced early Peak Oil date (and peak everything else). That could be very painful indeed, a disaster on a scale that is hard to imagine. On hopefully a lesser scale, political instability in oil-producing countries is a potential threat to oil supply.
· Demand : From 2000 to 2013, production has gone up from 74,983 to 86,808 bpd [2], an average increase of little over 1% pa. There are increasingly plentiful and cheap supplies of natural gas, which may well eat into the demand for oil. Greater efficiencies, possibly driven by the oil price, may also help to limit demand. However, a period of global cooling, as some think likely, may increase oil demand for heating. Also, a period of renewed global prosperity would surely push up the demand for oil.
· Note: The relationship between demand and Peak Oil date is interesting. In the simple calcs [16] a higher production growth rate gave an earlier Peak Oil date. But under higher demand, if the oil price is strong (but not so high that it knocks demand down again), it is likely that more of the TR will get produced and hence Peak Oil date could even be later.
· Price : The full incremental cost of oil production – the cost of a barrel from new sources taking up-front capital costs into account – is now probably above $US70/bbl [17]. This view is reinforced by the oil futures market, where oil for delivery in future years is in Contango, ie. higher than the spot price by more than the storage cost [19]. For global oil production to keep increasing, a greater proportion of production will have to come from “unconventional” sources, and that does look likely to push the cost up further. As the cost of oil rises, so alternatives such as natural gas become more competitive.
· Technology : Will technology be able to keep ahead of demand by both (a) reducing the cost of production of “unconventional” oil, and (b) increasing the rate at which it can be produced? If it cannot, then Peak Oil occurs earlier. Technology may also work to reduce demand for oil by, for example, replacing it with gas or electricity for some uses, and by enabling more efficient use of oil.
With all these conflicting factors, the future for oil looks difficult to pin down.
Conclusions
A Peak Oil date cannot, I think, be predicted with any reasonable certainty. Although it is mathematically possible for Peak Oil to occur after say 2040, it looks unlikely to be as late as that, and may well be much earlier.
Major advances in “unconventional” oil technology are needed to forestall Peak Oil for more than a few years. Technology has always delivered in the past, and it is reasonable to assume that it can continue to deliver in future.
But there is another possibility : The price of oil is still likely to increase. If alternative energy sources such as natural gas (or even nuclear or solar energy) are available in sufficient quantity, and if the technology is developed for them to compete for some uses of oil, then Peak Oil occurs early and everyone benefits.
So Peak Oil doesn’t have to be regarded as a disaster. With any luck it will be a massive non-event that no-one even notices.
Discussion
Prediction is very difficult, especially about the future [18]. So I won’t make any predictions. Instead, I will offer some scenarios (don’t take them too seriously, consider them as using “artistic licence”, a bit like climate model “projections” but hopefully more realistic):
Scenario 1. The marginal cost of oil (driven mainly by “unconventional” oil) stays high, while alternatives such as gas become increasingly available at attractive prices. Heating at first, then transport, start converting to the alternatives. Peak Oil occurs early, but the total amount of energy available just keeps increasing while prices remain fairly stable, so there is net economic benefit.
Scenario 2. US shale oil production increases sharply until 2020, then declines. Together with other new sources of supply, the US shale can more than keep pace with declines in existing fields until 2020, but then it is found that other “unconventional” oil sources simply cannot ramp up production enough to keep pace. Total oil production declines quite sharply. In this scenario, Peak Oil occurs around 2020 and the oil price soars. There is then a painful transition period while other fuels scramble to make up the shortfall.
Scenario 3. Technological advances continue to reduce the marginal cost of “unconventional” oil production and to allow ever-increasing production rates. Technological advances also allow increasingly efficient uses of the oil, fuelling economic advances world-wide. A lot more “unconventional” oil is discovered in various parts of the world, and oil production continues to increase steadily until well past 2040. Oil production peaks around 2050, but gas, coal and nuclear keep the energy supply increasing for many more years after that, while solar technology matures and eventually everything (except possibly air transport??) runs on nuclear and solar.
Scenario 3 should be the most likely, but if our politicians continue to get ever more adept at stuffing things up, then the unpreparedness of scenario 2 may be the best we can hope for.
As always, I will be happy to be proved wrong!
###
Mike Jonas (MA Maths Oxford UK) retired some years ago after nearly 40 years in I.T.. He worked for BP in the 1960s and 70s, including 3 years in Abu Dhabi.
References
[1] OilPrice.com “Declining Fossil Fuel Supplies and the Energy Trap“, Tom Murphy, 31 Oct 2011. http://oilprice.com/Energy/Energy-General/Declining-Fossil-Fuel-Supplies-and-the-Energy-Trap.html
[2] Data is from: BP Statistical Review of World Energy June 2014.
http://www.bp.com/content/dam/bp/pdf/Energy-economics/statistical-review-2014/BP-statistical-review-of-world-energy-2014-full-report.pdf
[3] BP: Oil Reserve Definitions.
[4] US Energy Information Administration (EIA): Petroleum & Other Liquids.
[5] From Wikipedia 3/9/14: Hubbert peak theory. The graph matches the graph in Hubbert’s 1956 paper, Figure 21, for assumed initial reserves of 200 billion barrels.
[6] Norway crude oil production 1970-2013. Data is from the Norwegian Petroleum Directorate (NPD).
[7] heatingoil.com Unconventional Oil Reserves in and Around the US.
[8] wattsupwiththat.com Conventional Wisdom, Unconventional Oil, Willis Eschenbach, February 2, 2013.
[9] Oil rig blowout photo from Azhargd Gdin. Pumpjack photo from Wikimedia. Alberta Tar Sands mining photo from Photobucket.
[10] Paleofuture article We’ve Been Incorrectly Predicting Peak Oil For Over a Century
[11] The Bakken Shale Oil Field, North Dakota. http://bakkenshale.net/
[12] USGS Global Estimate for Undiscovered, Technically Recoverable Conventional Oil and Gas Resources US Department of the Interior Press Release.
[13] USGS U.S. Oil & Gas Reserve Growth Estimates US Department of the Interior Press Release.
[14] Wikipedia Oil Reserves in the United States.
[15] Wikipedia Unconventional Prospective Resources.
[16] Spreadsheet.
[17] Business Insider Australia Breakeven Oil Prices For America’s Shale Basins. Keystone XL Project Draft Supplemental Environmental Impact Statement (Figure 1.4.6-8 Mining Breakeven Oil Price. Note also Figure 1.4.4-8 showing US shale/tight oil production expected to decline after 2020)
[18] Niels Bohr, from The Quotations Page http://www.quotationspage.com/quote/26159.html
[19] Futures Magazine Contango crude markets.
Biocrude produces CO2 when burned so what’s the advantage?
Increased CO₂.
So that we do not suffocate the plants.
The role of terrestrial plants in limiting atmospheric CO2 decline over the past 24 million years, Nature 460, 85-88 (2 July 2009) doi:10.1038/nature08133 Letter, concludes grasslands are the result of the CO2 suffocation of trees. Plate tectonics were responsible for CO2-depleting mineral formation, especially, the uplift of the Himalayas. CO2 levels dropped to 200-250 ppm from 1000-1500 ppm as forests, starved for CO2, gave way to prairies.
Peak oil is is a fundamentally flawed approach: it only focuses on the production side of the equation (as does this article) and ignores the many factors that limit demand, it assumes the only factor limiting production is difficulty of extraction, and it assumes that this difficulty is a monotonically increasing function that technology can never reverse. This author continues to double down on his mistaken understanding of the magnitude of the resource and the factors that govern production and consumption. He seems determined to join this crowd of failed prognosticators (http://i61.tinypic.com/2j2x8v8.jpg ).
Funny thing is that quite a lot of the article was taken up with discussing factors other than production – such as technology for example: “Major advances in “unconventional” oil technology are needed to forestall Peak Oil for more than a few years. Technology has always delivered in the past, and it is reasonable to assume that it can continue to deliver in future.“. I’m not sure how this translates into “assumes that [difficulty of extraction] is a monotonically increasing function that technology can never reverse”
Nice graph though. Well it would be if it was at all accurate. I note that Hubbert put global peak oil at 2010 but your graph shows 2000. Not impressed..
Jonas, you are apparently ignorant of your own prophet. You should read Hubbert’s 1956 paper that introduced the world to peak oil. Figure 20 on page 22 is particularly relevant as it shows a peak in global oil production in the year 2000 exactly. http://www.hubbertpeak.com/hubbert/1956/1956.pdf . I have studied Hubbert’s work in detail and followed his revised predictions over his lifetime. Even in 1956 he was aware of offshore and Alaskan oil (though many of his apologists try to deny it), and you will see in the paper that he factored into his calculations new discoveries. He was right about our ultimate need to migrate to nuclear power, but he was massively wrong about ultimately recoverable oil (only 2.2 trillion BBL of production by the year 2200) and about the inability of technology to dramatically rebaseline marginal costs and expand reserves by accessing previously inaccessible and unknown resources. If you are unimpressed by facts, there is not much that can be done.
BTW, where exactly in your article above did you discuss consumption, and how demand-side economic factors such as buying power and substitution drive production side factors such as carrying capacity and market share? Of course, these don’t have a place in classic peak oil theory, where production is driven purely by scarcity of the resource without regard to market forces and variable demand.
Yes it was indeed 2000, not 2010. My mistake. But regarding your question “where exactly in your article above did you discuss consumption, and how demand-side economic factors such as buying power and substitution drive production side factors such as carrying capacity and market share?“, you are bogging yourself down in unnecessary and/or irrelevant detail. None of those factors count at the level that we are discussing. Consumption for example is what you end up with after production, demand and price have done their dance.
You appear to be accusing me of arguing that “production is driven purely by scarcity of the resource without regard to market forces and variable demand“, yet I have been arguing precisely the opposite : that there is strong interaction between production, demand and price. If that’s not having regard to the forces in your market then you live in a very strange market.
Ike, so where is the new technology that allows us to re baseline costs? So far this century we are seeing much higher costs per barrel. Do you realize we have people getting laid off at $50 per barrel oil price? What was the equivalent price in 2000?
For Leanme,
Oil industry layoffs were all the news in 1986 when oil prices collapsed and took the Texas economy along with them. Yet, this ushered in a 17-year period where global oil was $20-$30 a barrel and world economies boomed, including that of the USA. Instead of peddling doom, you should study the economic history of oil. It follows a repeating pattern of perceived scarcity that generates a price spike that spurs massive wildcatting and capital investment, that inevitably lead to massive development of new resources, overproduction, and glut, which then causes a price collapse that halts capital investment and forces the oil companies to live off their fat and sell oil below sustainable margins for a decade or more before the next cycle begins again with perceived scarcity and a price spike. During the lean years of sustained low price, the major oil companies with vertical integration and refineries make their living off of the crack spread and downstream operations, and those without refineries typically get starved out and absorbed into the majors. We just saw BG get absorbed by Shell. That is only the beginning. Where in the world is oil production trailing off? Where capital investment and technology evolution has lagged for various reasons, such as Mexico, Venezuela, the North Sea, etc. Where is it booming? Where capital investment and technology evolution has been vigorous, such as GOM, Malaysia, and US terrestrial shale plays. Huge amounts of oil have been tapped and capped since 2003 and will come online progressively over the next decade even without further campaigns of exploration and drilling. Increasing efficiency from technology improvements will make some of today’s uneconomic oil economically producible in 5 and 10 and 15 years. But there will eventually be another price spike, and the peak oilers will start to crow again, and then, when the next glut comes, complain that the new massive influx of pre-salt oil and methane hydrates should not be counted because they are not “conventional oil” and were not foreseen by Hubbert.
Yet every major super field, just about every country with sizeable deposits of oil, are in terminal decline, like Norway, Egypt to name two.
Oil production decline is a very real issue for Norway as they have a very costly welfare system that will not be affordable in about 30 years or less.
A self-inflicted wound to be sure.
Europe’s largest resources remain untapped beneath shale rock.
All I can say according to the experts in the 1970 we were suppose to be out of oil by now, funny ask any oil man and we are going to run out in thirty to forty years that was true in the 1920s and it is true today.
Just because they were wrong then, doesnt mean they are wrong today. As noted, every super giant field is in terminal decline. We are consuming it faster than it’s being discovered. Most large producing countries are in terminal decline in production.
Would you say the Spraybury of West Texas is in terminal decline? I would sat it is jus getting started.
“Pioneer Natural Resources, the Irving-based company that ranks as one of the country’s largest independent oil and gas firms, is estimating the recoverable oil in a single field in West Texas’ Permian Basin at 50 billion barrels of oil and gas.
At almost twice the estimated reserves in the Eagle Ford, that would make the field, named the Spraberry/Wolfcamp, the largest in the country and the second-largest in the world behind the Ghawar.”
No expert ever said that. You are confusing peak production with exhaustion. They are very different, by hundreds of years. See the main post, which makes this distinction clear.
Mark, you jest tell me where to drill and make money out of it. You got any new ideas? I sure don’t.
Jonas and other peak oilers are stuck on the symmetric sigmoid that M. King Hubbert derived based on linearly increasing cost of extraction of a finite resource. There is another curve that fits the data better: it is the conventional sigmoid. US oil production was on a conventional sigmoid path to 9.5 MBPD (3.5 BBPY) of production in the 1970s and 1980s until the oil price collapse in 1986 shifted global market share to cheaper producers overseas and caused a discontinuity in the curve in the form of a precipitous drop. In 2014 the USA was again on a sigmoid curve to again achieve 9.5 MBPD of production when another price collapse occurred and has begun to shift market share to cheaper production overseas. 9.5 MBPD seems to be a natural global tolerance or carrying capacity for US oil production where the global price can no longer be sustained. On the basis of the curve below drawn in 2012, I predicted a 1986-like collapse of global oil prices before the summer of 2016 as US oil production again approached 9.5 MBPD. The US production surge from shale was a bit more rapid than I anticipated, but the collapse happened at the predicted production threshold, if not the exact year. It is time to swap sigmoids and pursue a more sophisticated approach to predicting future oil (and other resource) production and consumption. http://i60.tinypic.com/2iazomt.jpg
Ike Kiefer’s statement that Hubbert based his findings on “linearly increasing cost of extraction of a finite resource” is quite simply incorrect. Hubbert’s calculations were made without reference to price. Indeed, what he actually said was rather different: “secondary recovery techniques are gradually being improved so that ultimately a somewhat larger but still unknown fraction of the oil underground should be extracted than is now the case.“.
Interestingly, Hubbert did show a sigmoid-like curve – but for nuclear energy (figure 30 in his 1956 paper, see [5])..
Cost and price are two different things (basic economics again). Cost reflects the difficulty of extracting the oil; price reflects what a consumer is willing to pay. To generate a Hubbert curve one has to apply some cost v. price function that starts at 100% marginal profit for the producer when no resource has been extracted and reaches 0% marginal profit when all the economically-extractable resource has been extracted (by definition). The usual way to do this is a linear function of increasing cost (decreasing margin) per unit of resource extracted. Without such a cost function, the area under the curve is unbounded and you have infinite production.
The upper bound of the area under the curve is the total amount of oil. Period.
“The upper bound of the area under the curve is the total amount of oil. Period.”
Now Mr. Jonas reveals he does not understand the difference between resources in place and ultimately recoverable resources. Peak oilers who genuinely understand Hubbert’s theory and his curve realize that the oil produced (the area under the curve) is always a tiny fraction of the oil in place (the total amount in the ground), and that the amount produced is a function of continuously declining economics.
There happen to be an infinite number of curves with an area equal to a given value. Production could follow an increasing ramp to a cliff, or be a rising then falling symmetric sawtooth, or be a square on/off pulse to name a few. To get a symmetric sigmoid requires a unique cost function that increases linearly with cumulative production. It is the same curve one gets for distance traveled in a tractor pull. At the beginning the engine is running full blast and the brakes are off and there is maximum acceleration. But the brakes (the weight rising up the ramp on the sled) apply linearly increasing drag proportional to the distance the tractor proceeds down the track. At the peak speed (aka “distance production”) curve, drag equals thrust. At the tail of the curve, drag has overwhelmed thrust and decelerated the mass to a standstill, even though there is a whole lot more pull left in the engine and a whole lot more track out in front of the tractor. Oil technology throughout history has had the dual effects of both removing weight from the drag sled (improved extraction efficiency), and adding more track in front of the tractor (discovering more producible resources). Both are very real and very valid factors one must consider if pretending to be able to predict the future of oil.
Mr. Jonas should not be presenting himself as an authority on peak oil, nor Hubbert, nor any aspect of energy until he gets some further education in the subject. Perhaps he should attend some tractor pulls.
Ike Kiefer – “To get a symmetric sigmoid … “. I am not the least bit interested in getting a symmetric sigmoid, or a symmetric anything, or an anything sigmoid. I state that the bell curves have a wide variety of shapes. Now, regarding the area under the curve : Let’s move to the hypothetical future situation where oil production has ended, IOW the curve has been completed. Now the area under the curve is exactly the total amount of oil that has ever been produced. The only thing you can say with mathematical certainty is that it cannot exceed the amount of oil that was there to start with. It is indeed possible that the total amount of oil produced is orders of magnitude lower than the amount initially present, but every barrel of unproduced oil is unproduced because of some combination of technology, demand and price. (Include cost if you insist).
All you are seeing is the left half of a classic bell curve. There is no way oil production will remain at the flat level at the top of that curve, not when every super field is in terminal decline.
Check out this graph, No Terminal decline here.
http://www.eia.gov/dnav/pet/hist/LeafHandler.ashx?n=PET&s=MCRFPUS1&f=M
How about the Alberta oil sands?
Also some of the richest oil fields are off limits because of politicians who hat oil. yet they have the biggest carbon footprint in the world flying around on taxpayer $$$
The real concern is Peak Propane.
Seems to me that “peak oil” occurs when we must spend a barrel’s worth of energy to extract a barrel — when the EROEI reaches 0, oil will no longer be an energy source. It might still be mined for non-energy purposes (e.g., for plastics), of course.
Iirc, in the early half of the 20thc, 50 barrels of oil were produced from one barrel’s worth of energy/effort. By the close of the 20thc, that return had fallen to four barrels retrieved for every barrel “spent”.
Is there any reason why that ratio will always be positive?
While I wouldn’t argue that EROEI is irrelevant, I think it is more helpful to look at ERO$I. If it makes a buck it makes sense, and more bucks makes more sense. That’s one of the themes in the post – as the cost of oil rises, so alternatives can become more attractive.
Except the Energy Trap would take hold. Energy would have to be diverted from society to get that energy from oil. That would drive up the price of the energy source being used to extract the oil.
Thank you for bringing up EROI. EROI is the real driver of the cost function for the oil production curve. It limits carrying capacity for a logistic curve (the conventional sigmoid I advocate above). However, it is a misperception that oil production EROI (even for conventional oil) has always been decreasing. I will let the experts like Dr. Charles Hall speak for themselves, but the current hindcasts of conventional oil production EROI have been moderated to agree that it was probably never much higher than 30:1, and today the estimate is between 10:1 and 20:1 as a global average. It has probably dipped to about 6:1 or 8:1 at times and rebounded. The EROI estimates for unconventional oil and gas are much higher. Mean EROI for Marcellus gas from a study of 300+ wells has been estimated at 85:1, and that is why some production is sustainable even at today’s low prices.
Oil was original extracted using human labor — four men bouncing a drill bit into the ground and able to drill only 2 or 3 feet of rock a day — very low EROI. Then drills were spun by horses on treadmills and that improved EROI and production rates. Then steam engines and rotary drilling rigs were incorporated and that made much deeper oil much more easily accessible — another increasing step function in EROI. When Howard Hughes Sr. invented that bi-conic drill bit, it revolutionized the efficiency of drilling again, and made much deeper oil accessible. More recently we have had continuing technology revolutions in seismography, directional drilling, horizontal drilling, deepwater drilling, measurement while drilling (i.e., borehead sensors and telemetry), well bore casing, sequential fracturing, and proppants, among many other things. We are now drilling 20 horizontal wells from the same surface site, and extracting energy at such high efficiency that it is often more economical to use a small fraction of the produced energy to desalinate water from local saline aquifers deep beneath the surface to use for the next fracking operation and recycle the fracking formula ingredients and purify the water after use onsite rather than paying to truck everything in and truck the waste water out and impound it underground. Fracking may well be a significant part of the answer to global water scarcity as it offers an economical means to produce both water and energy. tapping universally available source rock directly instead of hunting for the shallow reservoirs of migrated oil that are accidents of geology. With ultra-deepwater drilling and deep drillling in general, we have now discovered “pre-salt” oil far below the zone where conventional biogenic and thermogenic oil theory can explain. And vast amounts of methane hydrates await a technology to make them economically recoverable, even has it has been newly discovered that some is generated abiotically and may represent a renewable resource (http://geology.geoscienceworld.org/content/early/2015/03/27/G36440.1.full.pdf+html ).
In short, EROI is a function both of the nature of the target resource and the technology used to extract it. Both are subject to dramatic change, and that is why Hubbert curves are poor predictors. When the wax and wane of economic cycles and market forces are also factored in as they must be, the actual production is best described by a logistic curve with some oscillations about the asymptotic peak.
Very busy article, well woth the time to read along with all the comments. Thanks to Anthony and Mike for bringing this to WUWT.
This peak oil theory is mainly based on the supply side, but what about the demand side.
Demand is high at the moment. However over time demand in the west will decrease as we switch to more efficient energy production and uses as we are doing at the moment. At the same time demand is increasing in developing countries. But these developing countries will become developed countries in time. Then they will start to decrease their demand just like the west is doing.
Plus the population of the developing countries will become more like that of developed countries and stagnate rather than grow. This will happen naturally as the need to keep producing babies to counter high mortality rates decreases as the developing countries become better at health care just like the west is doing.
If demand drops it will more likely going to happen because the economy tanks.
Peak oil will be reached before those developing countries get developed. I’m afraid some of them will not get to even see an air conditioner.
Well, all this ignores a few things
1. All/nearly all the shale oil found is on the North American continent. Do you really believe that the geological history of this continent was profoundly different than all the rest of them?
2. There is a sharp price break between the cost of drilled oil like that of Texas and Arabia versus shales and oil sands. The evidence I have seen is that we are indeed past “peak oil” in the 20th century definitions about “cheap” oil (what a mushy phrase that is–“cheap” is not a precise thing). We have now reached a switch-over point where shale oil is more practical. But there’s still enough “cheap” sweet crude to enable Saudi Arabia to break American oil producers–for a while. So we have a jumpy transition.
3. The Russians prepared beautiful chemical explanations of abiotic oil. These have been rewritten by Westerners so they are nowhere near as clear and do not acknowledge the Russian discoverers. Certainly, the oil found in sedimentary rock was mostly produced by decay of once-living organisms (fossils). But before Earth had life–where was the carbon? The origin of Life was abiotic oil bubbling up from undersea volcanoes and deep-sea vents. This would have been far indeed from equilibrium when it came into contact with sea water. This powered the emergence of life, all of which gets its energy from phosphate-rich compounds using energy produced by the oxidation of carbon compounds. (A couple billion years later, certain bacteria found a way to recharge the carbon by using sunlight to reduce carbon dioxide. These became incorporated into green plants as chloroplasts, and now form the basis of all land life).
1. No. But as I said in reply to another comment, I used the best data I could find rather than make it up, and details don’t matter as much as the total.
2. Yes.
3. Pass!
3. Once again, someone who has never worked with a single Russian petroleum geologist putting words in their mouths. Amazing how much time they spend analyzing biomarkers and source rocks if they think the oil is from elsewhere.
Do you have a reference for this hypothesis about the origin of life?
I suggest believers go find the abiotic oil and come back to tell us about it.
Abiotic oil has long been theorized and has been produced in laboratories under conditions plausible to exist underground. Now, according to this paper in Geology (http://geology.geoscienceworld.org/content/early/2015/03/27/G36440.1 ), it has been found and with a geochemical mechanism to explain both its origin and its continued production and accumulation. Much about it remains to be quantified, including its global prevalence and its rate of generation. On what basis will Leanme now cling to his disbelief and mock others for views comporting with the evidence?
The problem with predicting the future is that nobody knows what is going to happen. It is the paradigm shifts that make a nonsense of even the most sage like predictions. Previous ‘peak oil’ predictions have proved useless due to unconventional reserves being tapped. As mentioned in the article, these were known about but it was not thought they would be a factor. To quote Rumsfeld, this was a known unknown that has affected forecasts. The factors that really derail the predictions are the unknown unknowns. One example, prior to the invention of the jet engine the forecasts for the air speed record were based on piston engine, propeller driven, aircraft. A safe, practical, supersonic aircraft was considered highly impractical. So much for prediction.
Where there is money to be made, some ingenious person will crack the problem. It is the denial of this fact that is the most unpleasant aspect of the green machine and its scaremongering (Please note, that comment was not aimed at the author whose article is extremely thought provoking).
I guess we’ll have to find the super unconventional oil. I’ve given that some thought. For example, if we could build nano robots equipped with tiny spatulas they could go down there and recover the oil we left behind?
“I am not talking about fossil fuels generally, and I am not talking about oil and gas. I am talking specifically about oil.”
Stopped reading right there. What matters is “peak hydrocarbons,” which is a long ways away.
What matters is the cost of those hydrocarbons. It is clear that throughout the last 50 years higher energy costs forces economies into recession. That drops demand, which collapses prices, which makes expensive extraction of hydrocarbons unprofitable.
Nah. What matters is peak oil and condensate. Natural gas liquids don’t count, and neither does methane.
If you are serious, can you tell me why?
TJA – What matters is … peak oil? peak hydrocarbons? peak energy? peak prosperity? peak human happiness? I’m trying to get people away from the idea that “Peak Oil” is a looming disaster by placing it in a wider context. If, for example, other hydrocarbons take over smoothly from oil, then Peak Oil is a non-event. If nuclear energy, for example, takes over smoothly from hydrocarbons, then Peak Hydrocarbons is a non-event. The future doesn’t have to frighten.
Well, you could have hinted at that earlier. I have read so much nonsense about “Peak Oil,” all heavily documented, full of charts and graphs, and all studiously avoiding the main point, which is that there are still plenty of fossil fuels in the ground or under the oceans after the easily extracted oil is gone, and that we get richer in technology every year, so the price keeps going down. The hydrocarbon age isn’t going to end because we run out of hydrocarbons any more than the stone age ended because we ran out of stones.
Seaweed cultivation for energy purposes
http://www.renewableenergyworld.com/rea/news/article/2013/06/from-the-beach-to-the-pump-is-kelp-a-viable-biofuel
May be, but not just yet.
Well after a three day blow from the south late in the summer, I get plenty of compostable seaweed on my beach. Harvesting seaweed from lakes that are choked because of ag runoff and surrounding camps with inadequate handling of sewage always seemed like a win-win to me. Use thermal depolymerization and you can not only extract oil, but you could slowly separate and remove the mercury dumped there by centuries of burning coal.
And of course the Victorians worried about Peak Coal…
Jevons, W.S. (1865) The Coal Question: An Enquiry Concerning The Progress Of The Nation And The Probable Exhaustion Of Our Coal-Mines, Macmillan And Company, London and Cambridge 467 pages.
Philip,
Thank you for that wonderful link. Jevon’s was a brilliant mind and he built much upon the foundation laid by Adam Smith. I was unaware of this particular work. O what a wonderful education is available today now that Vannevar Bush’s memex is a reality via the internet. It is inexcusable that so many live in ignorance of history and rely on the media and the popular memes and the short span of their own life experience to inform themselves, and thus are susceptible to the charlatans and doomsayers of the age.
Are you calling me a charlatan? I may have to interview you.
Much of the decline in oil from developing countries is due to the rapacious way those governments treat the oil: as a pot of liquid to be drained rather than something that needs continuous investment. Venezuela and iran are 2 examples. This bad management is usually accompanied by nationalizing the oil industry.
I just did four reserve estimates for Venezuela under four scenarios. In three of them I assumed regime change. I couldn’t come close to their official reserves unless I got rid of Maduro and his cronies. They have an extremely serious problem with the Orinoco region reservoir performance. If they allow pdvsa to keep doing what they are doing they will ruin those reservoirs.
So… in other words.
How long is a piece of string?
Interesting article and great commentary by Rud, Wakefield, Fernando and others who have studied oil resources and production. Typical WUWT. One can learn things here.
Come on, how likely is that? The US occupies 6% of global land area, therefore a better lower estimate for global “shale etc” is 36,000 Bbbl.
Which alone puts peak oil many years into the future.
Then there’s Fischer–Tropsch and coal is abundant indeed. One can even supply Hydrogen to the process using advanced nuclear, in which case its energy requirements are covered for the rest of Earth’s lifetime (one ton of ordinary granite, the default stuff continents are made of, has as much recoverable energy content as fifty tons of coal). And, with some additional energy, carbon can be extracted from limestone.
How soon you’d expect either peak water, peak granite or peak limestone? It’s not all gloom and doom, after all.
How likely? Good question. Please note that Saudi Arabia is under 1.5% of world land area yet is ~8% of TR (with TR at 5,000 Bbbn).
I haven’t counted F-T as oil, as I regard it as being energy from coal.
China has more shale than the US, but it is a different kind of shale, and so they will have to develop their own technology to extract it, minus market incentives, of course.
http://oi62.tinypic.com/23wvgj4.jpg
That up tick is because of fracking for the most part, like the Bakken. Except oil extraction from fracking is completely different from conventional extraction. The biggest problem with fracking is the decline curve is immediate. As noted above by others, the drop off of flow from a single well is 80% within 3 to 4 years. There is no secondary nor tertiary recovery methods (so far). Once a well is done, it’s done. The USGS is predicting that the Bakken is at or near peak production as the best locations have been sucked to the limit. So expect that spike to not last, especially now that OPEC is screwing with us by their flood of conventional oil, all with the full intent of killing off expensive unconventional extraction in the US and Canada.
I observed a fracking operation as a summer ME intern – in 1967 and it wasn’t new then.
OPEC can leave the taps wide open as long as they can stand it but the Bakken and other such deposits will still be there when they have to throttle back to increase income for internal economic reasons. Oilies come and go but the resource stays until it’s pumped out.
Bakken peaked. I think Eagle Ford will peak in a few months. Russia has peaked. Argentina peaked. Colombia peaked. Mexico is cratering. Norway peaked. UK peaked. Indonesia peaked. Australia peaked. Azerbaijan is done for.
Let me ask you guys, why do you think the really important low permeability oil and condensate plays are in North Dakota and Texas? Why not in California? What happened to the Polish unconventional oil play? Why aren’t the Chinese drilling their “shale” fields with 10 million Chinese? Why isn’t anybody doing it in Norway? What about Kansas? Or Louisiana? What do you think is going on?
I don’t look as those wells as having a steep decline, I see a gangbuster start which provide very fast return of investment. You get your money back fast, and drill another well. Soon you have a huge portfolio of wells chugging along at a low rate, but they are all paid for and don’t much production to turn a profit. That tail is going to be very very long.
Doug
Rather, you buy 30 wells. Pump three for three years, rotating one each year. Put the next three on for three years, cap them, go to the next group over over. 27 years later, you pump the first group again for three years – unless something new has come along, or some new “solvent” or new pipe or new technology has come along.
Regardless, you PLAN AHEAD for the long-term. Now, today in the southern US for example, all of the US paper products are from company-owned tree farms and plantations, and the paper and wood companies are harvesting what was planted 15-20 years ago. And so they are planning to continue to do so for the next 450 years. It is the government that is FORCING false assumptions into the planning process. The COMPANIES are trying to do it right.
When oil gets expensive enough, the artificial restraints on developing ANWR will fall, and there is a lot of oil still on federal land. I am not sue if herding people into collective yurts is going to be a successful electoral strategy.
Although i disagree with Mike Jonas on cllmate change, he has done some good analysis in other areas. However, he has missed the elephant in the peak oil room – the impending disruptive switch to electric ground transportation.
http://www.eia.gov/oiaf/archive/ieo05/images/figure_28.jpg
http://www.streets.mn/wp-content/uploads/2013/03/US-transportation-oil-use.jpeg
Around half of oil is used for transportation with 70-80% of this for ground transportation. Ships are highly efficient. Air transportation uses much less oil than ground transportation and bigger planes and more efficient engines are likely to put a cap on the potential increase in oil for aviation, despite increasing demand.
Ignoring battery considerations for a moment (they are addressed later), oil is far more expensive than electricity as a fuel for land vehicles – calculations based on the sources below indicate oil is 2.5 to 3 times the cost of electricity as a fuel for ground transportation.
http://www.eia.gov/petroleum/weekly/
http://www.washingtonpost.com/blogs/wonkblog/wp/2013/12/13/cars-in-the-u-s-are-more-fuel-efficient-than-ever-heres-how-it-happened/
Current average gas prices are $2.50 and average consumption is around 25 mpg (US gallon), giving a fuel cost of 10 cents / mile. That’s based on recent oil prices, assumed to be $50 / barrel. At last year’s high oil prices gas prices were $3.7 / US gallon which is 15 cents / mile.
http://www.eia.gov/electricity/monthly/epm_table_grapher.cfm?t=epmt_5_6_a
Residential electricity prices average 12 cents / kWh across the USA with commercial prices half that. Electric vehicles get around 3 miles per kWh, giving a retail power price of 4 cents / miles and an “industrial” price of 2 cents / kWh, with commercial use somewhere in between. Very little oil is used in power generation.
So oil is actually very expensive as a fuel for ground transportation – 2.5 to 3 times the cost of electricity, more for commercial use, and considerably more for last year’s oil prices at which most new oil production would become economic once more.
This is probably not a surprise to anyone. Let’s get on to the bit which might be.
The big problems with electric vehicles in the past have been due to batteries. There include 1) weight 2) availability of fast charging outside the home and 3) high battery costs. Problems with “range anxiety” are a symptom of not being able to afford the capacity to get a decent range so are another symptom of high battery cost.
http://en.wikipedia.org/wiki/Lithium-ion_battery
Lithium ion batteries and other technologies such as the newly announced aluminium battery generally solve the weight problem. li-ion comes in at 200 Wh/kg or better which is 5 kg / kWh. For a decent range of,say,180 miles you need 60 kWh, which would weight 300 kg – light enough not to be a problem compared with the weight of a petrol engine.
For the daily commute home charging is fine, but what do you do if you want to travel over 100 miles? Tesla is solving the problem for its customers (who have all spent huge sums on their luxury EV’s) by setting up networks of free, fast charging stations in the USA, Europe and other regions. Lower cost, bigger batteries and thus a larger range also assist in solving this.
So that just leaves battery cost. With the exception of the battery an electric car is simpler and cheaper than an internal combustion engine drive train.
http://www.iea.org/publications/globalevoutlook_2013.pdf
The US EIA estimates that $300 / kWh is the break-even point at which EV’s will be competitive in the general market, which price the EIA believe would be reached around 2020.
http://www.carbonbrief.org/media/389356/screen-shot-2015-03-23-at-142210_600x365.jpg
from http://www.nature.com/nclimate/journal/v5/n4/full/nclimate2564.html .
The best evidence is that the big hitters in the EV market are already at $300 / kWh. We needn’t wait until 2020.
http://www.forbes.com/sites/greatspeculations/2014/03/11/gigafactory-will-cost-tesla-5-billion-but-offers-significant-cost-reductions/
Volume production at the Tesla battery megafactory is expected to reduce battery costs by 30%, giving $210 kWh. We are now talking lifetime costs for an EV (slightly higher total purchase price plus much low fuel costs and reduced maintenance) which are cheaper than lifetime costs for an internal combustion engine vehicle – and with a decent range too.
Within a five to ten year timeframe it looks increasingly likely that the ground transportation new vehicle market will move to electric vehicles, driven by reductions in existing battery technology costs caused by the move to high volume battery production.
Hence, when discussing peak oil, the smart money should be on :
Scenario 4 – with the advent of large-scale lithium ion battery megafactories, in the 2020-2025 timescale road vehicle production moves mainly to electric vehicles. This dramatically reduces the demand for oil (eventually down to 50% of 2015 levels), production levels from existing wells reduce gradually and prices remain at rock bottom. No new oil wells are economic.
Except the metals and plastics for the batteries come from oil. Without them, no batteries.
Battery powered cars may have some small intrusion on the roads, but not trucks, buses, aircraft or trains for that matter (too expensive to switch over).
Electric cars might do OK in California, but the northern states and Canada in the winters, they will flop. Between heating the car, wipers going, lights on, stopped in traffic… Well, you get the picture. A lot of dead cars blocking the roads…
Richard said
https://www.google.co.uk/url?sa=t&rct=j&q=&esrc=s&source=web&cd=3&ved=0CDEQFjAC&url=https%3A%2F%2Fwww.afpm.org%2FWorkArea%2FDownloadAsset.aspx%3Fid%3D4186&ei=N7s0VerxBuPP7gb54oHACQ&usg=AFQjCNHsBZQf1Yk4coygGChLP0b1MksK7A&sig2=3A5QiK6bCdu0pO4jYA-Tvg
The average car uses around 600 lbs of plastics, and this is going to apply to both EVs and ICE (internal combustion engine) cars. Not much plastic goes into a large EV battery compared to the 600 lbs in the car. Average car mileage is around 10,000 miles/year which is 400 gallons at 25 mpg, weighing 2,400 lbs. So it is going to take the oil for at most six month of fuel to make the plastics parts in a car. If cars last for 5 years before scrapping then oil use over the lifetime of a car will reduce 90% when comparing ICE cars with EVs.
The decision to replace a fleet vehicle (train, bus, truck) to use a cheaper fuel is easier than a personal decision to replace a car, because fleet vehicles travel considerably further each day than the average personal daily commute which is around 40 miles. So fuel costs are a much bigger factor in the equation.
Commercial air flights are a different matter because you need a minimum energy to weight ratio out of the fuel, but see the comments below on low-end flight.
http://www.theguardian.com/environment/2015/jan/13/low-carbon-battery-powered-train-carries-first-passengers.
The trains on lines which are not electrified already are ideal application for electrification using batteries – you really don’t mind the weight penalty and you know they stop periodically at places where you can recharge them. You can even recharge them as they go along by electrifying limited stretches of line.
http://www.shanghaidaily.com/Metro/public-services/Citys-supercapacitor-buses-improved/shdaily.shtml
There are now a number of supercapacitor buses in operation in China – which can go 10km without recharging. Supercapacitors are great for bus charging, because they can charge at a tremendous rate. But a combination of supercapacitors and battery would extend range much further, allowing longer stretches between bus stops equipped with charging capabilities. New technology batteries with much faster charging rates would spell the economic death of diesel buses for cities, but may be some years off, and my point is that current battery technology with volume manufacturing is going to bring on peak oil just on its own.
http://www.dailymail.co.uk/sciencetech/article-2641593/Impossible-electric-aeroplane-takes-skies-Silent-battery-powered-craft-rolled-20-years.html
http://www.flyingmag.com/aircraft/new-electric-trainer-pipistrel-takes-flight
Small electric powered planes are already available and much cheaper to run than jetfuel-powered planes. Electric trainers reduce the cost of learning to fly by up to 70% – because it is mainly fuel cost.
Although electric cars are pretty efficient, they are not 100% efficient and the battery and motors do give out heat as they go along. As in a gas-powered car, this can be used to keep the occupants warm while travelling. In fact air conditioning is a bigger consumer of power, but not a show stopper.
LED lights (as used on most electric cars) use around 10% of the power of halogen lights, so lights and wipers need very little power. And the EV really comes into its own when stopped in traffic as the motor just stops dead, ready to spring to life when the lights change.
Canada when at minus 30 degrees is a little more of an issue, because the battery might need pre-heating before a journey to ensure it can deliver power initially. Once the journey starts it will produce enough waste heat to keep itself warm. But many more people live in USA than Canada, so the Canadians on their own are not going to delay peak oil by much.
Plastics apparently are mostly built up from short chain hydrocarbons — frequently ethane. While those can come from petroleum, they can equally well come from natrural gas or Natural Gas Liquids. You’re right about electric cars in Canada and the Northern US (Not that anyone much seems to deal in reality wrt to limitations). But hybrid vehicles offer substantial reductions in petroleum consumption in urban environments and also throw off waste heat which will surely be much appreciated by Northern drivers and their passengers.
The latest London Transport “Route Master”, bus, is fully diesel electic. That’s the way to go! I so miss the original London “Red Bus”, the route master. It was so way ahead of its time!
http://usatoday30.usatoday.com/money/industries/manufacturing/2008-12-25-biodegradable-plastic_N.htm
You can also have bioplastics – at the moment mostly made from corn. Whether these are any greener than plastics made from oil depends on the whole manufacturing and disposal cycle of the parts.
https://www.tfl.gov.uk/info-for/media/press-releases/2015/march/london-s-first-all-electric-bus-route-to-be-operated-by-arriva
This is a pilot to see if all-electric buses are feasible in London too.
https://www.tfl.gov.uk/info-for/media/press-releases/2014/august/new-hybrid-bus-charging-technology-trial-announced
And they are trialing inductive charging of the new hybrid London buses while waiting at their stands at either end of the route. Inductive charging at normal bus stops is also possible in the future, of course.
http://en.wikipedia.org/wiki/New_Routemaster#Design
There are 800 New Routemaster hybrid buses delivered and on order in total. They are 40% more efficient than the old diesel buses, even without going pure electric.
If you live in London and are over 60 you get free bus and tube travel. And guess what…….!!
Climate Pete; I admire your optimism, but when it comes to risking my own $$$, I’ll stick with investing in fossil fuels for the time being. 🙂
Jbird,
Just make sure you time your exit right. I bet you’ve taken a bath on oil company share prices over the last 6 months already.
The time to really start worrying about your oil shares is when Iran signs on the dotted line for their new anti-nuclear weapon commitments. Because at that point they are going to start producing and selling oil again on the world market. This will increase the Saudi-induced surplus even further.
And as for coal – see http://www.vancouverobserver.com/blogs/climatesnapshot/collapsing-share-prices-us-coal-hold-warning-bc-and-alberta-carbon-bubbles .
Hope you didn’t hold coal shares.
I suspect many consumers have chosen the configuration that I use: an economy car for commutes and an SUV for hauling people on longer trips or heavy goods as desired. Sometimes I take the SUV on commutes when my spouse wants to take the economy car into dense population areas with small parking spaces. Even if our situation was two people working full-time, I would still keep one economy car and one SUV, because of the added maintenance and insurance costs of owning a third vehicle. An all-electric vehicle fits this scenario now, and the economics will improve with time.
Many people reject all-electric vehicles based on their perception that they are inadequate (range anxiety), or on principle (green-government giveaway program). They come up with far-fetched excuses why EV won’t be accepted (plastics as discussed above). Most of these people will come around as the economics of electric transportation becomes unassailable, and some will not, just as some may be reading this post on a CRT instead of an LED display.
We have two cars in London. My wife uses hers daily, but mine sits in the street and does less than 2,000 miles per year while I use public transport each day. When mine finally expires there seems no downside to replacing with an EV which we would use only around London. If we need to make a longer trip then we would use my wife’s ICE (internal combustion engine – petrol) car. I can’t see why we would both need to drive cars outside London on the same day, but if we did, we could always hire one.
Many households have two cars and will be in the same position – make one an EV but keep the fossil-fuelled car for the longer trips. No range anxiety in all this.
I just picked up four LED lights to replace four burned out bulbs. Now these sweet little replacements will shine on for years and at a fraction of the cost. My desktop is soon to be replaced by a dongle. I’m seeing a trend. Those who imagine a world where our energy needs are approaching gluttony aught to be aware of the trends. I’m not the least bit worried as usual. Choose whatever energy creation you like. Robots are getting smaller and more efficient.
You are speaking about only marginal energy usage. Main usage is caused by heating water and houses. In most of world if you change your bulb for LED light, 9 months of the year heating will have more work for replenishing missing heat from bulb…
I would say 90% of households energy consumption goes for heating/cooling, 8% for heating water and only 2% for rest. And there much more visible trend for going down with energy for heating/cooling.
I converted my house from natural gas heat to ground source heat pump. Our costs to heat and cool were negligible until the Ontario government tripled our power rates with their wind turbines… Geoexchange is still the most energy efficient method to heat and cool a home.
https://www.gov.uk/government/uploads/system/uploads/attachment_data/file/48195/3224-great-britains-housing-energy-fact-file-2011.pdf
Lighting in the UK is generally just less than 20% of total domestic electricity use. I believe USA is similar. In the report above the graphs for electricity use indicate :
– lighting – 17 TWh
– appliances – 60 TWh
– cooking – 15 TWh
so lighting is 17 / 92 = 18.5%.
(space heating is 330 TWh and hot water is 86 TWh)
That’s before wholesale replacement of incandescent and halogen bulbs with LED and compact fluorescent bulbs which have the potential to reduce lighting energy and costs by a factor of 5 or 10.
And although lighting TWh are only 3.4% of total energy, electricity generation is inefficient. You get 30% or maybe 40% of the TWh out of a generating station that you put in as fossil fuel, and it is costly. In UK electricity costs are often on a par with gas boiler space and water heating costs, so lighting could cost you 10% of your annual energy bill. But the power / natural gas ratio will vary hugely as both power and natural gas prices are very depending on location
Even at $8 a bulb, my payback time on LED bulb is one year. As soon as I can no longer stand those hideous CFL bulbs, they get replaced by LED.
DME as a direct drop in replacement for gasoline. LFTRs providing electricity during the day and during off peak hours produce DME and desalinate water. First step? Wait for someone else to develop LFTRs. Second step? Buy it from them after missing the boat that we designed in the first place.
I pick LFTR as it is the most likely at this point. It could be fusion or LENR or something nobody has on their radar yet.
Why not do the obvious thing – store heat at night from the LFTR’s running all the time then generate power during the day from the stored heat. And let batteries take care of ground transportation so charge them at night from the LFTR’s too.
Peak Oil is Big Brother’s wettest dream.
ladylifegrows: “The origin of Life was abiotic oil bubbling up from undersea volcanoes and deep-sea vents.
L. E. Joiner: “Do you have a reference for this hypothesis about the origin of life?”
===================
There’s a lot of evidence in support of the hypothesis on my webpage “Life from Petroleum.” I recently added a link to this abstract:
There’s a link under my pseudonym if your interested.
Fernando Leanme
April 19, 2015 at 3:20 pm
“I suggest believers go find the abiotic oil and come back to tell us about it.”
================
Here you can find the equivalent of 500 years of OPEC output on a tiny, abiotic pebble:
http://en.wikipedia.org/wiki/Oil_shale#Extraterrestrial_oil_shale
Go find that oil, make a discovery, announce it, get rich. Send me your shoe and I’ll eat it when you meet those conditions.
Surely, abiotic hydrocarbons, if any, are going to be mostly methane (gas) not petroleum. It there is one thing about the interior of the Earth that is non-controversial it is that it is HOT down there. Even if long chain/complex hydrocarbons somehow form deep in the Earth, I’m skeptical that those molecules would stay intact for long.
They cant. It is beyond the oil window. Oil breaks down into light gases at that depth. That alone debunks abiotic oil.
The other aspect of oil that debunks abiotic theory is that there are many molecules in oil which have clear lipid properties. I find it VERY unlikely that abiotic chemistry could produce the complex chains of lipids. DNA is needed to do that.
Besides all that, as I noted above. All oil fields have a unique chemical signature. That chemical signature allows geologists to pinpoint the source rock, and it is almost always a shallow marine environment under warm conditions. The deep oil fields off Brazil are an example. The oil field sits above the source rock, which is a clear shallow marine environment, sitting on top of basalt. As the south Atlantic started to open, the sea was teaming with life, which produced that oil some 200 million years later.
Lipids can indeed be produced abiotically, as for example hydrothermally:
http://www.ncbi.nlm.nih.gov/pubmed/16642268
I thought that Hubbert’s argument was about EROEI, energy return on energy investment. “Easy oil,” the kind under pressure at shallow depths that gushed out of the ground had a great energy return because it didn’t cost a lot of energy to get it out. However, as time goes by, the oil must be pumped out, and drilled for at greater and greater depths, so more and more energy was required to extract it. Easy oil is now gone, and at some point, the amount of energy required to retrieve any oil EQUALS the amount of energy the oil delivers, and then you are finished. Of course, before that point arrives, the oil becomes too costly (in terms of dollars) to make a profit and you stop pumping anyway. The actual dollar cost runs up against competitive technologies like nuclear, but EROEI is something that is ultimately independent of dollar cost and technology. It is useful to think in terms of energy cost, because the actual dollar cost of things gets obfuscated by inflation, deflation, variable market factors and so forth.
No, Hubbert’s theory was on peaking flow rates, regardless the reason why.
Peak oil is an incorrect concept, that arises over and over again. Julian Simon’s work has proved that human ingenuity grows exponentially in a manner similar to compound interest. Rapid increases in knowledge and technology will either discover new ways of extracting oil or substitutes for the oil.
JD
Yet countries around the world are experiencing terminal decline in their output of oil, and it’s causing them grief. The uprising in Egypt coincided with their having to start to import oil. Prior to them peaking they exported their oil to pay for food. Egypt can only provide some 15-20% of their food requirements. Without income from oil exports, they have to borrow money to buy food for their country, and borrow more money to import oil.
Production decline is highly correlated with government owned assets and industries in resource-endowed areas. See VNZ and Mexico if you have any further questions. You don’t actually think that production is down in VNZ because the Orinoco Belt is running out of hydrocarbons do you?
JR You ignore the bigger picture. I am not saying that oil production won’t decline in some countries or for some period of time. However, over the long haul, over broad markets, innovation will ensure either an increase in the supply of oil or the development of alternatives. For instance, whale oil used to be a substantial fuel for lighting, but it was replaced by electricity and the lack of production of whale oil is now irrelevant. There have been many warnings over the course of the last century that we would run short of oil. They have all been proven wrong.
JD
Blaming the Arab spring on peak oil is a hoot. You’re too late. The climate alarmists already blamed it on CO2. If you actually go back and read the headlines, the Egyptian insurrection began as bread riots because the Egyptian government could no longer afford to subsidize grain. The proximate cause was not oil, it was a spike in the global price of grain in 2007 and 2008 that persists to this day. A series of studies commissioned soon thereafter by the World Bank and a consortium of international food aid charities attributed much of this spike in price to the redirection of global agricultural resources from food to biofuel in response to US and European biofuel subsidies and mandates beginning in 2005 and escalating over subsequent years. The definitive study on the topic reveals how 10 International Agencies including FAO, IFAD, IMF, OECD, UNCTAD, WFP, the World Bank, the WTO, IFPRI and the UN HLTF formally petitioned the G20 starting in 2010 to “remove provisions of current national policies that subsidize (or mandate) biofuels production or consumption”
(http://www.oecd.org/agriculture/pricevolatilityinfoodandagriculturalmarketspolicyresponses.htm ).
Peak oil alarmists blame everything bad on oil. Climate change alarmists blame everything bad on CO2. Neither will acknowledge that both oil and CO2 have made and continue to make huge positive impacts on the world and that the “cures” advocated for them are often worse than the diseases. Fossil fuels have saved the whales from becoming lamp fuel, have saved the worlds forests from becoming firewood, and have pulled billions of humans out of the poverty and brutally short lifespan of subsistence living in underdeveloped agricultural economies. CO2 is increasing plant growth, plant fertility, crop yields, and topsoil around the world, and the net effect of its increase to date is calculated in the trillions of dollars of gain to the world’s GDP. It requires 2 more degrees C of warming to bring the negative effects of climate change (mostly sea level rise) to a point where they offset the positive effects. This is what the consensus of integrated resource models say, not my personal opinion. Of course, the positive effects that are demonstrably happening right now are generally ignored by the media and artfully hidden by the alarmists, while the negative effects that have yet to be seen and are yet only the predictions of grossly flawed models are trumpeted from the rooftops.
Ike Kiefer – I get the impression that you have glanced at the article headline and assumed that I’m a Peak Oil Alarmist. Please note that my “Conclusion” ends:- “So Peak Oil doesn’t have to be regarded as a disaster. With any luck it will be a massive non-event that no-one even notices.“. Is that alarmism?
Yes, Peak Oil is an incorrect concept. Suppose the commodity was TV sets and we tried to model it without import substitution, tax policy, labor policy, alternate media switching, price elasticity of demand, and host of other factors outside the model. It is low price and investment risk as much as anything that limits investment and therefore future production. Those factors are on top of the usual problem of lag times in market adjustments in the medium and long run.
JD Ohio – I am somewhat bemused by your comment “Peak oil is an incorrect concept,“. I define it at the start of the article, and it seems a pretty clear concept. Obviously it differs from your concept, so maybe your concept is “incorrect”? You then go on to say “Rapid increases in knowledge and technology will either discover new ways of extracting oil or substitutes for the oil.“. Well, the funny thing is that apart from the word “Rapid”, that’s pretty much what I was saying.