Guest Post by Bob Tisdale
First: Congratulations to the teeny-tiny 2014/15 El Niño. It’s now official. NOAA included it as an “official warm event” on their Oceanic NINO Index this week.
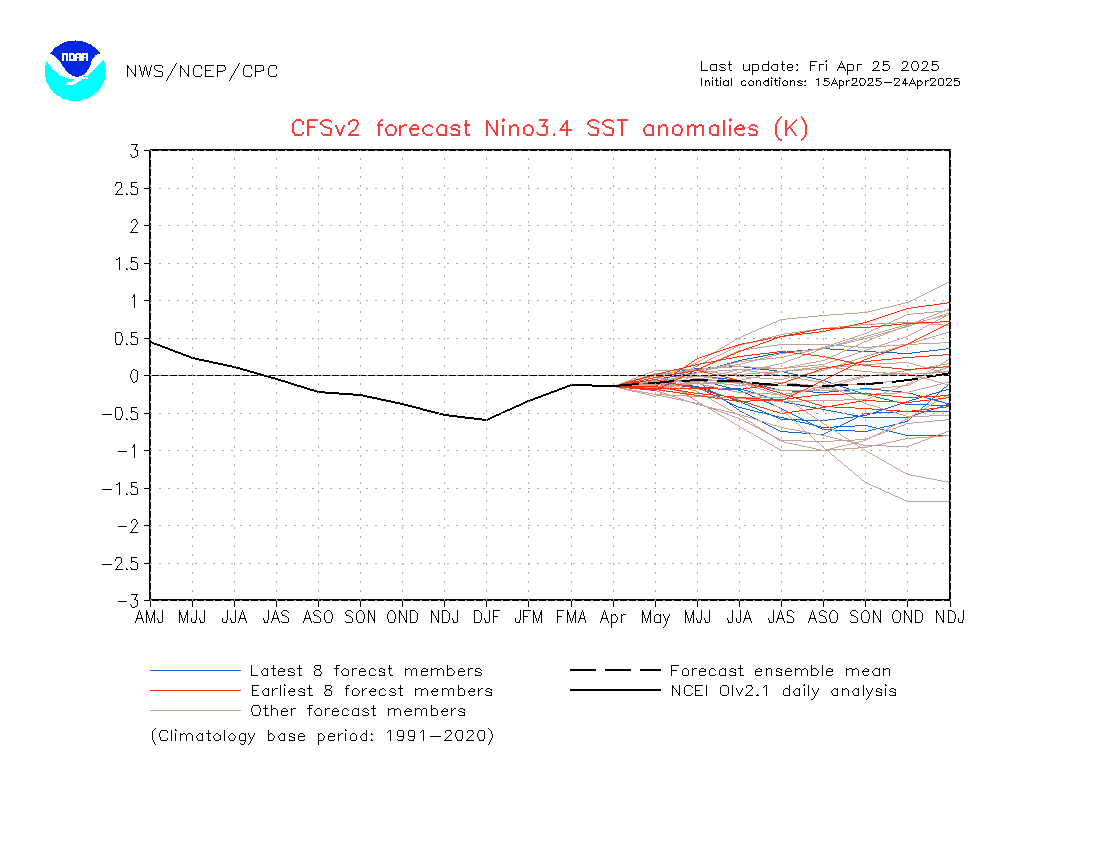
NOAA’s CFS.v2 model (dated April 9, 2015, source here) is now forecasting a strong El Niño for this upcoming ENSO season, or as blogger Alec, aka Daffy Duck called it, “a supercalifragilistic el nino” when he brought the forecast to my attention here. See Figure 1. That forecast is noticeably higher than the one that shows up on page 25 of the NOAA weekly ENSO update, which was dated April 4th.

Figure 1
If you live in California and are hoping for drought relief, I wouldn’t get my hopes up just yet. It’s still (boreal) springtime, and ENSO forecasts have a hurdle called the “spring prediction barrier”. Basically, El Nino forecasts have a bad history during and before boreal spring. [See of Torrence and Webster (1997) The annual cycle of persistence in the El Niño/Southern Oscillation for more info on the spring prediction barrier.] The spring prediction barrier is especially true for El Niño development predictions…not so much for El Niño decay or La Niña development and decay. [See Duan and Wei (2013) The ‘spring predictability barrier’ for ENSO predictions and its possible mechanism: results from a fully coupled model.]
There are a number of aspects that may help in the development of a stronger El Niño this year than last. (1) This year’s downwelling Kelvin wave is a little later in the year, so it will be impacting equatorial sea surface temperatures later in the normal ENSO development “season”. Keep in mind that El Niño events are normally tied to the seasonal cycle. [See the post Why Do El Niño and La Niña Events Peak in Boreal Winter?] (2) The eastern tropical and equatorial Pacific (surface and subsurface) are warmer this year than last. [See the March 2015 ENSO Update – Will the 2014/15 El Niño Become the 2014/15/16 El Niño?] (3) The downwelling Kelvin wave making its way across the equatorial Pacific is a little weaker than the one last year, but it’s still a reasonably strong downwelling Kelvin wave.
But as we saw last year, the development of an El Niño can be suppressed by a lack of westerly wind bursts over the course of the year. Strong westerly wind bursts early in the year only initiate the process. They are needed throughout the rest of the year to strengthen the El Niño. Also, the upwelling (cool) Kelvin wave that should come next can offset the strength and impacts of the existing downwelling (warm) Kelvin wave. So part of the development will depend on the strength and timing of that upwelling (cool) Kelvin wave, too.
A COUPLE OF NOTES ABOUT BACK-TO-BACK AND MULTIYEAR EL NIÑOS
For this discussion, we’ll refer to NOAA’s Oceanic NINO Index again. Of the 20 El Niño events since 1950 that are shown on the ONI index (in red), there are 2 pairs of back-to-back El Niños (the 1957/58 & 1958/59 El Niños, and the 1976/77 & 1977/78 El Niños) and two multiyear El Niños (the 1968/68/69 El Niño, and the 1986/87/88 El Niño). El Niño events normally evolve in one year and decay in the next, so I’m defining multiyear El Niños as those that developed in year one, extended through the second year, and decayed in the third. Bottom line: multiyear and back-to-back El Niños can and do happen. In other words, just in case some alarmists decide to get goofier than normal and try to make a fuss about a multiyear El Niño or back-to-back El Niños, there would be nothing unusual about either type coming to pass this year.
And for those wondering, there is no set rule about the strengths of the first and second years of multiyear and back-to-back El Niños. See Figures 2 and 3. For the multiyear events, the second season of the 1968/68/69 El Niño was slightly weaker than the first year, but during the 1986/87/88 El Niño, the second season was definitely stronger than the first. Looking at the back-to-back El Niños, the 1976/77 & 1977/78 El Niños were comparable in strength, while the 1957/58 El Niño was stronger than the 1958/59 El Niño. In fact, the 1958/59 El Niño was so weak it doesn’t appear on the Old Oceanic NINO Index, which uses a fixed set of base years for the climatology. [See the post Comments on NOAA’s Recent Changes to the Oceanic NINO Index (ONI).]

Figure 2
# # # #

Figure 3
As I noted a number of times last year, we’ll just have to watch and see what Mother Nature has in store for us.
[Thanks to blogger Alec, aka Daffy Duck for the heads-up.]
http://ggweather.com/enso/oni.htm
According to Bill a big El Nino should have followed approximately 3 months later the extreme -OLR period from Jan 2010-Apr.2010. I see La Nina instead.
The 2009-10 El Nino peaked at +1.9C in the week of December 23, 2009, and the negative OLR values followed in the few months later just like I said.
http://www.cpc.ncep.noaa.gov/data/indices/wksst8110.for
Nice graph above, I have never seen that particular one before. Note well who you are talking to in respect to how he answers you.
I should have said more accurately El Nino heading to neutrality for the three months following -OLR period Jan- Apr. 2010 ,followed by a strong La Nina some 9 months later.
The author seems to think that “multiyear” El Ninos somehow deserve special attention. l. That is nonsense because multiyear El Ninos and La Ninas are the norm. ENSO is a concatenation of alternating El Ninos and La Ninas. It is caused by an harmonic oscillation of ocean water from side to side in the equatorial Pacific, not by any submarine happenings, and is powered by trade winds. It has existed since the Panamanian Seaway closed and established the current system of equatorial currents in the Pacific. There can still be irregularities due to oceanic conditions but when it is over the basic frequency returns. It can be traced in all global temperature curves as far back as they go which means as far as the CET has been recorded. It is most obvious as a sawtooth pattern persisting in observed temperature records. For an example of an ENSO wave train of five multiyear El Nino peaks with La Ninas in between them see figure 15 in my book “What Warming?”
Bill , the way I read it you said originally that El Nino is in response to -OLR and not the other way around.
Here is what you said originally.
The energy does not get to escape to space as readily as it normally does and this extra energy held in spreads to the rest of the world in a month or two. It takes 1 to 2 months for the large increase in tropical storm activity to develop and then one to two months for the extra heat held-in to spread to the rest of the world. This is the formula for why there is a three month lag from the ENSO to where it starts to impact tropical and global temperature. It is the explanation for why there is a lag.
Then you say this which is opposite to what you said in the above. Lag versus followed. Which one is it?
The 2009-10 El Nino peaked at +1.9C in the week of December 23, 2009, and the negative OLR values followed in the few months later just like I said
Maybe I read it wrong now that I have read many times. Maybe you were trying to say the lag between an ENSO event and the effects from this ENSO event takes two to three months, due to -OLR , and hence tropical storm development/heat spread.
If so I understand the point you were trying to make and I say time will tell.
Yes, the -OLR values lag behind the Nno 3.4 Index (in an El Nino). The large +OLR values lag behind a La Nina.
This area is also important because the heat distribution from the equatorial region to the poles is very strong here and many of the systems move directly north (or directly south) from this important region and then catch the mid-latitude winds now going west-to-east which mean the west coast of North America and the area from Alaska to Minnesota are the regions second most impacted by the what is happening with the storm systems here.
The most impacted region is Indonesia and Australia (because the most important winds are the trade winds which move the majority of the systems at the equator from east-to-west). When there are large convection storms at the International Dateline area (like now in an El Nino), the moisture rains out here and Indonesia and Australia get much reduced rainfall. The opposite happens in a La Nina.
Thanks Bill.
The 77-77 one did not break the bad 70s drought but the following 77-78 one did. Hoping for a repeat.