UPDATE: Miriam responded in depth (?). See update at end of post for links.
# # #
Guest Post By Bob Tisdale
Date: October 5, 2014
Subject: Thank You for Admitting You Were Clueless
From: Bob Tisdale – Climate Observations and Regular Contributor at WattsUpWithThat
To: Miriam O’Brien – HotWhopper (a.k.a. Sou from Bundangawoolarangeera)
Dear Miriam:
I wanted to thank you for admitting you had little grasp of the subject matter in a recent post at your blog HotWhopper. Your post was Human influence on the Californian drought. (Archived version is here, just in case you decide to change your post.) Under the heading of “Disclaimer and further reading” you wrote (my boldface):
I make no assurances that I’ve interpreted the work properly. I think I’ve got the gist of it but please point out if you think I’ve gone astray anywhere.
If I may suggest, it would be helpful to your readers if you would preface all of your posts with the reality that you can make no assurances that you’ve interpreted anything properly at any time, and that you’re going to yak about it anyway, regardless. That way your readers can respond as I do to your absurd writings, with laughter.
EXAMPLE 1 OF WHY I FIND YOUR POSTS SILLY
In your recent post, you criticized Anthony Watts for referring to El Niños in the title of his recent post about the California drought: Claim: Cause of California drought linked to climate change – not one mention of ENSO or El Niño. Under the heading of “Why not ENSO or El Niño?”, after quoting Anthony’s title, you wrote (my boldface):
Indeed. I’ve no idea why Anthony thought ENSO or El Niño should be mentioned. For one thing, doesn’t El Nino often bring rains to California? For another thing, the paper was about the 2013-14 Californian drought. There was no ENSO event in that time.
That was exactly Anthony’s point. If El Niños “often bring rains to California”, and there hasn’t been an El Niño since the one in 2009/10, one might think the absence of El Niños may have exacerbated the drought.
And “another thing”, when your paragraph includes a statement where you, Miriam, admit to not having any idea why a statement was made, it undermines the point you’re trying to make. The facts that (1) you didn’t understand why Anthony mentioned El Niños in the title of his post and (2) you admitted it, made your criticism twice as funny.
EXAMPLE 2 OF WHY I FIND YOUR POSTS SILLY
This example is rather long, but please bear with me, Miriam, because this will help you understand a little more about weather and climate.
You then moved on to comment about my blog post California Drought – A Novel Statistical Analysis of Unrealistic Climate Models and of a Reanalysis That Should Not Be Equated with Reality, which was cross posted at WattsUpWithThat here.
You noted that much of Swain et al. (2014) was about the Ridiculously Resilient Ridge and geopotential height, not about sea surface temperature:
Bob didn’t mention geopotential height once. He spent most of his time writing about sea surface temperatures and CMIP5 models.
You continued (your boldface):
Bob wrote a whole heap about stuff that the paper wasn’t about and didn’t discuss what the paper was about.
And you, Miriam, added later (my boldface):
I don’t know what he was thinking.
I will apologize, Miriam. Sorry that I wasn’t thinking of you when I wrote my blog post. I assumed when writing it that the readers at my blog and at WattsUpWithThat were knowledgeable enough of climate and weather to understand that the oceans and atmosphere above it are coupled, meaning they interact with one another; they’re interrelated. That is, a change in one impacts the other, and that it’s difficult at best to determine which is the ultimate driver in any given situation. I received a comment at my blog that told me that I needed to clarify that, so I provided an update to my post and the cross post at WattsUpWithThat:
[Start of update to earlier post.]
Based on a comment on the thread of the cross post of this article at my blog Climate Observations, some persons might be wondering why I compared models of sea surface temperature to data, when Swain et al (2014) focused on geopotential height (see note below). My reply:
The large scale atmospheric circulation patterns are in part dependent on local sea surface temperatures. The oceans and atmosphere are coupled. If the models cannot simulate the sea surface temperatures properly, then they are not simulating atmospheric circulation properly.
Let’s confirm that.
Lead author Swain also wrote an article for The California Blog at WeatherWest titled Special update: The Extraordinary California Drought of 2013-2014: Character, Context, and the Role of Climate Change. In it, he acknowledged the relationship between ocean and atmosphere a number of times. On page 2 of his article, Swain wrote (my boldface):
Several recent studies have examined precisely this possibility in assessing cause of the extraordinary persistence of the Ridiculously Resilient Ridge in 2013 and 2014. Wang et al. (2014) find that tropical West Pacific SST warm anomalies (associated with the West Pacific Warm Pool that acts as a precursor of El Niño) played a leading role in causing the strength and longevity of the Triple R by generating a recurring series of atmospheric “Rossby waves” that propagated from west to east across the Pacific Basin. Wang and Schubert (2014) find that the North Pacific SST warm anomalies during early 2013 created a “predilection” for dry conditions during the second half of the 2013-2013 2013-2014 “rainy season” in California, and Funk et al. (2014) also report that the observed Pacific SST anomalies during 2013-2014 contributed to the extremely low precipitation that was observed during 2013-2014.
However, Funk et al. also note that it’s possible the record-breaking warmth in the North Pacific (discussed further below) was actually a geographically remote response to the changes elsewhere in the Pacific–similar to the mechanism considered by Wang et al. It’s even possible that that the Triple R played a role in sustaining itself by reducing North Pacific storm activity and preventing vertical mixing of cooler sub-surface ocean water, culminating in a self-reinforcing feedback loop by which atmospheric ridging led to warm SSTs , which in turn led to more ridging, and so on. Regardless of whether the record-breaking warmth in the North Pacific was the primary cause of the Triple R or merely a secondary one, it’s pretty clear that Pacific SST anomalies contributed to the persistent northeastern Pacific ridging and extremely low California precipitation observed in 2013-2014.
Swain confirmed that the sea surface temperatures of the eastern extratropical North Pacific and atmosphere above it are interrelated, and that the warm sea surface temperatures contributed to the California drought.
Looking back now at my post above, Figures 1 and 2 [The figure numbers refer to earlier post, not this one.] showed that the sea surface temperatures of the eastern extratropical North Pacific had not warmed for 2.5 decades, and had cooled prior to the unusual warming…while the climate models employed by Swain et al, Figure 4, showed the sea surface temperatures of that region should have warmed more than 0.65 deg C in those 2.5 decades if they were warmed by manmade greenhouse gases.
In other words, the climate models employed by Swain et al are not realistic representations of climate in the eastern extratropical North Pacific. This further indicates they have no value when attempting to determine the cause or causes of the California drought, and no values when trying to attribute that drought to manmade factors.
Note: If the term geopotential height is new to you, see the ECMWF webpage here.
[End of Update to earlier post.]
Oddly, Miriam, in your post, under the heading of “Teleconnections and The Blob”, you quoted one of the same paragraphs of lead author Swain’s blog post at WeatherWest that I included in my update. But you ended your quote too soon. If you had read one more paragraph…just one more paragraph…you would have found the answer to your questions:
Regardless of whether the record-breaking warmth in the North Pacific was the primary cause of the Triple R or merely a secondary one, it’s pretty clear that Pacific SST anomalies contributed to the persistent northeastern Pacific ridging and extremely low California precipitation observed in 2013-2014.
Does that help you understand why I focused on sea surface temperatures, Miriam? Between the Triple R (Ridiculously Resilient Ridge) and the sea surface temperatures of the eastern extratropical North Pacific, Swain understands they’re interrelated, but he does not know which is the ultimate driver.
EXAMPLE 3 OF WHY I FIND YOUR POSTS SILLY
Early in your post you presented a gif animation of sea surface temperature anomalies, which I have presented here as my Animation 1. You were very kind to your readers and you highlighted the region of elevated sea surface temperatures being discussed with a red circle. Please notice, Miriam, that the unusual warming of the sea surface (known as “the blob”) varies in strength and location.

Animation 1 (gif Animation “SwainBlob” from HotWhopper)
Very oddly, Miriam, after posting that gif animation of sea surface temperature anomalies, you questioned the fact that I presented graphs of sea surface temperature anomaly data. Thanks, your apparent contradiction made me chuckle.
EXAMPLE 4 OF WHY I FIND YOUR POSTS SILLY
Later in your post, you presented a map of the region I used for the unusual warming in the Northeast Pacific and then you criticized me for using such a large area. See the lower map in my Figure 1. The upper map is one of the cells from your gif animation (presented above). Oddly, they’re basically the same region, Miriam.

Figure 1
Your readers must really be wondering about that complaint of yours.
EXAMPLE 5 OF WHY I FIND YOU’RE YOUR POSTS SILLY
Toward the end of your complaints about my post, Miriam, you wrote:
Not that anything Bob wrote had anything to do with the Swain paper. That was about the Californian drought of 2013-14. It was about the Ridiculously Resilient Ridge, which is in the atmosphere not the ocean. The paper was about geopotential height and precipitation. Bob was writing about sea surface temperatures.
You forgot something, Miriam. If you had read and understood Swain et al., you would understand what you missed. Swain et al. used climate models to attribute the “ridiculously resilient ridge” [Triple-R], which is associated with the “blob” in sea surface temperatures, to manmade global warming. They wrote:
While the occurrence of events exceeding the P.I. 90–99th percentiles categorically increases in the 20C simulations (which include both natural and anthropogenic forcings), we find no such increase in those CMIP5 simulations which include only natural forcing (Fig. 2.2f; see SM). Thus, we find that anthropogenic forcing—rather than natural external forcing—dominates the simulated response in extreme GPH.
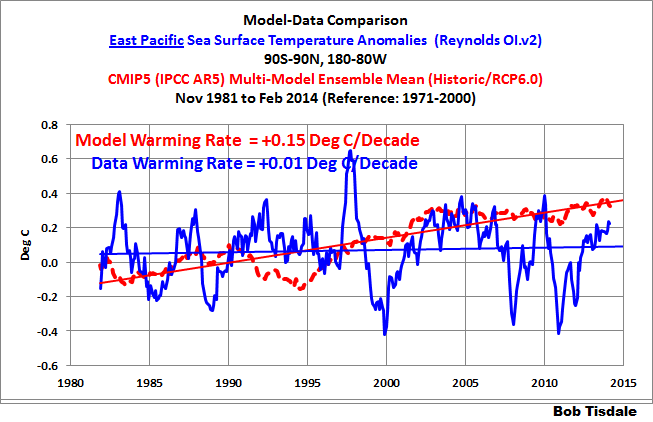
That’s basically the flawed IPCC argument that’s been around for years. In other words, the climate models that are forced by natural factors alone (volcanic aerosols and solar radiation) cannot simulate “metric X”, but the models that are forced by natural and anthropogenic factors can simulate “metric X”; therefore, the anthropogenic factors must be responsible for the change in “metric X”. That is an absolutely absurd argument, because the models cannot simulate naturally occurring coupled ocean-atmosphere processes that contribute to long-term warming or stop it. A side effect of that is, they cannot simulate where global sea surfaces show no long-term warming, Miriam. And one of the very large ocean regions where the surfaces show little to no warming for over 30 years is the entire East Pacific Ocean, from pole to pole, from the dateline to Panama. That region covers about 33% of the surface of the global oceans, and its surfaces have shown little to no warming in more than 3 decades. I post a graph of the surface temperature anomalies of the East Pacific every month in my monthly sea surface temperature updates, Miriam. Surely you’ve seen that graph and understood its importance, especially when climate models show it should have warmed about 0.45 deg C in that time.
Not too surprisingly, Miriam, the region with the blob is part of the East Pacific.
The fact that Swain et al. presented that flawed argument, Miriam, is why I presented the climate models used by Swain et al. and showed how poorly they simulated sea surface temperatures for the Northeast North Pacific, which as you’ll recall is coupled to the atmosphere and the recent Triple-R above it. Swain et al. presented a flawed argument and used flawed models to support it. If the models didn’t simulate the cooling of the ocean surface in that region, a cooling that occurred for almost 2.5 decades before the 2013/14 ridiculously resilient ridge appeared along with the unusual blob, then the models have no value in any attempt to attribute the Triple-R and blob to manmade greenhouse gases.
Miriam, hindcasts are different than forecasts. The data existed. The modelers knew the answers. Yet the modelers could not get their models to spit out those answers. Climate models have no value other than to show us how poorly they perform, and they do a great job of showing how poorly they perform.
EXAMPLE 6 OF WHY I FIND YOUR POSTS SILLY
In your post, Miriam, you wrote about the region I used for sea surface temperatures in the Northeast North Pacific:
It covers a lot of territory. Averaging it would diffuse the “blob” referred to above…
Now the reason I ended the quote at that point is because your complete second sentence in that paragraph mixed and jumbled two topics. That is, you find the topics so confusing that you blended two different topics in one sentence. Here’s your paragraph in its entirety:
It covers a lot of territory. Averaging it would diffuse the “blob” referred to above, had Bob bothered to focus on the period in question – 2013-14 instead of excluding that period. Most of Bob’s charts were from January 1989 to December 2012. I don’t know what he was thinking. The authors were writing about the 2013-2014 California drought. Bob did include this chart:
The first topic was area. The second was time, which I’ll get to in a moment.
Using an area that was larger than the blob can reduce the long-term and short-term variations. So in that respect, you were right with your “Averaging it would diffuse the ‘blob’ referred to above…”
But you forgot to note that the sea surface temperatures in that region cooled, not warmed, from 1989 to 2012. Does that mean the larger area I used showed less cooling than the blob region? If I was one of your readers, I’d be asking that question. The other question I’d be asking was, why didn’t Miriam show us why it was bad to use the larger region?
The map in Figure 2 shows the average sea surface temperature anomalies from July 2013 to June 2014 for the region I presented in my earlier blog post. The blob stands out quite plainly in that map. Yup, it looks like my larger area would have damped the impact of the blob. So we’ll use the coordinates of 30N-55N, 160W-130W for the sea surface temperature data of the blob region.

Figure 2
Figure 3 compares the sea surface temperature anomalies and cooling rates of the eastern extratropical North Pacific (the region I presented in my earlier post) and the blob region. Again, I’m ending the data in this graph the year before the blob appeared. The sea surface temperature anomalies of the blob region show more monthly volatility and they also show a higher cooling rate from 1989 to 2012. The cooling rate of the blob region is more than twice that of the larger region I presented in my earlier post.

Figure 3
Hmm. I don’t believe we have to wonder why you elected not to show that, Miriam.
Let’s add the last year and a half of data…the time of the blob. The last year and a half doesn’t cause a warming trend. See Figure 4. All the blob did was stop the cooling in the blob region.

Figure 4
But what about the models that Swain et al. used for attribution? See Figure 5. The models show the sea surfaces of the blob region should have warmed about 0.7 deg C in the 24 years from 1989 to 2012. But, in the real world, the sea surface temperatures there cooled.

Figure 5
And you don’t find the disparity between the models and reality important, Miriam? Remarkable. Simply remarkable. If the models can’t explain the cooling, the models cannot be used to explain the warming. It’s that basic, Miriam.
EXAMPLE 7 OF WHY I FIND YOUR POSTS SILLY
Let’s continue with the paragraph that you appeared to jumble, Miriam. You wrote in continuation:
… had Bob bothered to focus on the period in question – 2013-14 instead of excluding that period. Most of Bob’s charts were from January 1989 to December 2012. I don’t know what he was thinking. The authors were writing about the 2013-2014 California drought.
It’s pretty obvious what I was thinking, Miriam. I was showing that there was no evidence of the impacts of manmade greenhouse gases on the surface temperatures of the eastern extratropical North Pacific, or on the North Pacific as a whole, for almost 2.5 decades leading up to the unusual warming. Yet Swain et al. found evidence of human-induced global warming in the virtual worlds of climate models…which blatantly have no relationship with the real world. I thought that was so obvious that I didn’t have to spell it out. Next time, I’ll spell it out for you, Miriam, so you can grasp the obvious point I was making.
I further explained what I was thinking in my earlier post, but apparently you missed it, Miriam. Here, let me repeat it for you:
It’s tough to employ climate models so you can claim that manmade greenhouse gases caused the California drought, when the models used by Swain et al. can’t simulate the lack of warming of one of the key metrics associated with it.
That key metric is sea surface temperature, Miriam. And as you now know, sea surface temperatures are coupled to the atmosphere…that is, the Triple-R is associated with the blob in sea surface temperatures and the blob is associated with the Triple-R.
EXAMPLE 8 OF WHY I FIND YOUR POSTS SILLY
You repeatedly stated that you didn’t think I even read Swain et al., Miriam. One of your headings read:
Bob Tisdale probably didn’t read the paper
And later in your post:
Reading Bob’s article I have to wonder if he even read the paper.
I obviously read Swain et al., Miriam. How do we know? I presented the outputs of the three climate models they employed. Also, in the comments on the thread at WattsUpWithThat, I asked if anyone had found a link to the supplementary materials referred to in Swain et al. And, Miriam, if I hadn’t read Swain et al., how would I have known to present the sea surface temperatures for the region of the North Pacific under the Ridiculously Resilient Ridge?
You simply fabricate stuff, and I really enjoy that. You have no qualms about making statements regardless of whether there’s any truth behind them.
EXAMPLE 9 OF WHY I FIND YOUR POSTS SILLY
As part of your “Disclaimer and further reading”, you wrote (my boldface):
I think I’ve got the gist of it but please point out if you think I’ve gone astray anywhere.
When I read that, I was immediately reminded of the harassment you gave a newcomer to your blog recently. After lurking there, that blogger tried to offer some corrections, noting where you had “gone astray” in another of your posts. He was so frustrated by your rude response to him that he archived that thread with his comments, thinking (correctly) that you’d delete his replies, and he posted a comment at my blog.
My post was Data Reveal Florida Keys Sea Surface Temperatures Haven’t Warmed in 80+ Years*. It was cross posted at WattsUpWithThat here. Your mistake-filled response, Miriam, was the post Perennially Puzzled Bob Tisdale surfs the surface at Florida Keys. The archived copy of your post is here. The blogger’s name was 7DaBrooklynKnight7. His questions and comments start at September 13, 2014 at 1:33 AM in the archived version. After you insulted that newcomer to your blog, his final comment on that thread was:
wow. i will happily go elsewhere, sou. there is no reason for a newcomer (like me) to ask questions of someone so rude (like you).
i tried nicely to show you where your article is wrong and you keep repeating skin temperature. hadisst is not skin temperature data; it is sea surface temperature data. the data from the paper (figures 2 and 3) you’ve shown above in your article is Sea Surface Temperature data. the y-axis in both figures reads SST. maybe it’s you who needs “remedial arithmetic services or personal tuition in climate science and oceanography for dummies”.
something else you’ve overlooked. are the data from the lighthouses and from the buoys included in the hadisst data?
i may not be a skeptic but i am now skeptical of what you call science, sou. i will happily go elsewhere. maybe tisdale will answer my questions. his series of posts about el nino this year were easy to understand and accurate. they were educational. i noticed you didn’t try to question those. he is building his credibility by helping people understand. you are not. you seem intent on hiding the truth and that destroys your credibility.
Do you remember that blogger, Miriam? Not too surprisingly, Miriam, you deleted his last comment. It no longer exists on that thread. It now reads:
This comment has been removed by a blog administrator.
And now you’d like visitors to your blog to, as you said, point out if they think you’ve gone astray? I almost spritzed coffee on my keyboard this morning when I read that. Thanks for the belly laugh, Miriam.
But that’s not the best.
EXAMPLE 10 OF WHY I FIND YOUR POSTS SILLY
As part of many of your posts, you’ll copy and post portions of the comments made by visiting bloggers on the threads at WattsupWithThat and you’ll criticize what the visitors wrote. Every now and then you’ll find a comment you agree with. As a preface, in the above, under the heading of EXAMPLE OF WHY I FIND YOU’RE FUNNY 2, I explained why I included sea surface temperature data in that post, Miriam, while Swain et al. dealt with geopotential height. The two metrics are interrelated—they’re coupled.
You copied a comment by blogger Barry on the thread at WattsUpWithThat. Barry wrote (my boldface):
Bob, if you read Chapters 3 and 4 of the BAMS report, they both indicate that the CA drought cannot be attributed to the long-term warming trend, which seems to align with your argument. The Swain et al. paper, though, does not make a case based on sea surface temperatures, but rather geopotential height and wind anomalies (the high pressure ridge).
What Barry overlooked was the fact that the sea surface temperatures in the eastern extratropical North Pacific hadn’t warmed in 24+ years, and cooled from 1989 to 2012, so the other two papers he referred to did not agree with my post if they were discussing a long-term warming trend. There was no warming in the North Pacific for 24+ years.
That aside, you wrote about Barry’s comment (your boldface):
Barry is the first person to point out that Bob got it all wrong:
That implies that you believe Barry is correct. But Barry wrote, “…if you read Chapters 3 and 4 of the BAMS report, they both indicate that the CA drought cannot be attributed to the long-term warming trend.” Barry’s comment undermines the basic premise of your post, Miriam. The title of your post is “Human influence on the Californian drought.”
Visitors to your blog have to wonder why they wasted their times reading a 3000-word post, with you yakking about this and that, making stuff up, admitting you didn’t know what you were talking about, when in the end you contradict yourself by implying Barry got it right. Thank goodness I had put down my coffee by that point.
CLOSING
Once again, thank you, Miriam, for admitting you had no understanding of the subject matter. Every time I stop by your blog to see what you’ve written about one of my posts, I discover once again that you have little grasp of the topics. I find that very entertaining. And, the fact that there are visitors to HotWhopper who agree you…that’s the icing on the cake.
If I could make a suggestion, you may want to consider changing the name of your blog to HotWhopperIsClueless. That would be a perfect fit for your blog.
I sent an email to another “fan” of yours, Miriam, and let that blogger know I was writing you an open letter. That blogger emailed back:
I would add something like “Miriam O’Brien is professional consultant for businesses and boards of directors in Australia, where the stakes of being wrong are very high. So it is puzzling that she doesn’t do the most basic homework on some of these issues before she launches attacks and vitriol. While she might score some tribal points for attacking people, it certainly does not enhance her professional credibility.”
Would you like to guess who wrote that Miriam? I’ll give you two guesses.
Sincerely,
Bob Tisdale
PS: One more comment, Miriam. You threw what you thought was a jab about my understandings of the long-term effects of ENSO. You wrote:
But then again, Bob thinks that global warming is caused by ENSO. We’re used to mistakes made by perennially puzzled Bob Tisdale.
You must be aware that I’ve been showing the flaws in your perennially puzzled post for more than half a decade, Miriam. Yet, in response to my data-filled posts, you simply repeated the flawed arguments. Basically, you’ve used the absurdly funny contradiction approach to argument, reminiscent of the Monty Python sketch. You really crack me up, Miriam. Thanks.
You must also be aware that data support my understanding of ENSO, Miriam. I’ve been presenting it for more than 5.5 years. Sea surface temperature data support it. Ocean heat content data support it. Sea level data, trade wind strength and direction data, precipitation data, cloud cover data, ocean current data, lower troposphere temperature data, sea level pressure data, warm water volume and depth-averaged temperature data for the equatorial Pacific, etc., all support my understandings of ENSO. I’ve animated many of those metrics to show their relationships with ENSO, Miriam, so people could watch and learn.
Last year, Dr. Kevin Trenberth of NCAR jumped on the bandwagon and began saying that ENSO contributes to long-term global warming. In addition to being a loyal advocate of the hypothesis of human-induced global warming, Dr. Trenberth is also a world-renowned expert on ENSO. And he now says that El Niño events cause global warming…not that they’re caused by global warming. Here’s the kicker, Miriam. Dr. Trenberth has also written in at least two peer-reviewed papers that El Niños are fueled by sunlight.
Just in case you missed it, I provided an overview of Dr. Trenberth’s new understandings of ENSO in my post The 2014/15 El Niño – Part 9 – Kevin Trenberth is Looking Forward to Another “Big Jump”.
# # #
UPDATE: It took about a day and some coaxing, but over at HotWhopper, Miriam O’Brien responded to my post, admitting again that she still had no idea what I was talking about…even though I spent a good amount of time explaining. Her “Huh?” and “Huh (again)” are classics.
See the archived version of Miriam’s consecutive comments at October 6, 2014 at 12:32 PM and 12:51PM here. She continued her rant on the next thread, replying to a skeptical blogger who made an appearance at HotWhopper. See Miriam’s October 6, 2014 at 10:34 PM comment here. (Thanks for coming to my defense blogger “LongIslandSound71”. Your comments to WebHubTelescope are spot on, too.)
How about HotWhopperIsNoBeef?
There’s a variation of an old saying I often use and it applies here to Miriam in spades.
You can lead (wo)men to knowledge but you can’t make them think.
“I May make you feel but I can’t make you think”
Jethro Tull, Thick as a brick.
Sums Miriam up very well.
Glad you didn’t quote the next line.,
Nice post, Bob. Since the climate debate isn’t only about climate science, and since the warmunists are using all the usuall political tactics of the far left ( the analogy was first drawn by former Czech President Vaclav Klaus in his 2007 book Blue Planet in Green Shackles), starting to fire back in a fair factual way is more than appropriate. You know more about the coupled Pacific than most of the so called professors.
Good grief, Bob! If seems to me you just put an obscure site I’d never heard of on the map, thereby rewarding an ignorant and insulting personal attack with a major boost in readership. If you just had to vent, a rebuttal of charges made by unnamed sources would have done the trick. Instead, great hoards of readers now have a woman’s name they’d be better off without burned into their consciousnesses.
You mean, like Madam Bathory?
The short-term consequence might be elevated readership, Claude, but what matters is the world’s estimation of the content of that blog, which is obviously abhorrent.
She gains nothing but notoriety. I hope it grows.
I have just been on her site for the first time…she is scarily obsessed with WUWT. Look out for the bunny boiler, Anthony
Right on!
I too just visited there for the first time as well.
Truly scary; may be on another continent but watch your backs Anthony & Bob.
Well, that was a tour de force, but what good will it do?
Forget it, Bob, it’s Warmistown.
Oh, Miriam, Madame Propagandarian,
Why listen to all your broadcastafarian?
==============================
“Letters are written, never meaning to send”
It is a cathartic effort, and very amusing for the rest of us (your writing style is very good).
I especially like your use of the word “silly”. As it is mild, yet very meaningful.
(For the quote impaired, the opening quote is from Nights in White Satin, Days of Future Passed, Moody Blues, 1967 – a very obscure song no doubt).
Phil, thank you for taking me back in time.
That recording, while obscure is beautiful.
For a quick link here it is on youtube. If one spends the time to get the live recording in concert it is worthwhile. It is a classic.
Been to three live concerts the first a long time ago (69) the last a few years ago it is a timeless piece of art every time!
A drift back in time took me to another all time classic. Maybe OT but “She’s buying a stairway to heaven”.
Here are the lyrics: http://www.azlyrics.com/lyrics/ledzeppelin/stairwaytoheaven.html
And here is the audio from Madison Square Garden. I hope it comes out as another quick link:
http://www.azlyrics.com/lyrics/ledzeppelin/stairwaytoheaven.html
I missed the copy of the link to youtube for “Stairway to heaven” above. This is it enjoy:
I have them all. I have been a fan of theirs since that first album came out and bought everyone I could get. I even managed to see them in concert – twice! But that was in the early 80s, after Pinder had left.
Minor correction. Should be “Letters I’ve written…”
One of my all-time fav songs.
Arrggg!
Thank you.
Bod Tisdale,
Thanks for your article on the trivialness of Miriam O’Brien. I rather enjoyed it. But you used an awfully big flyswatter on an intellectually non-biting / non-breeding midge.
Miriam O’Brien is an intellectual drone clone of Oreskes who is an intellectual drone clone of Al Gore who isn’t any kind of intellect.
John
Miriam is the Internet doofus of the alarmist side. She is a prime example of why misogyny exists. Bat shit crazy feminists like her can’t debate with the big boys who have larger IQs like Anthony, so she resorts to throwing temper tantrums and threatening lawsuits.
She is going to get a rude awakening of what the first amendment means in the United States.
Also she really should not use such weak passwords.
Miriam threatening lawsuits? Do you have proof of that? Christopher Monckton regularly threatens lawsuits and there sure is plenty of proof of that!
And please explain why you said she really should not use such weak passwords. Have you been hacking?
Bob Tisdale,
Thank you for the wonderful post. Your humor is top notch and the takedown exquisite! Perhaps now that Miriam “Sou” O’brien has been so thoroughly exposed as an intellectual lightweight, she may cower in the dark room of her making, forever fearful of typing another word that would further reveal her mental deficiency.
Ursa Felidae, unfortunately, I don’t believe Miriam will disappear…ever. If there was a revolt in the climate science community and they collectively admitted that the anthropogenic portion of global warming and climate had been grossly overblown, the Miriams of this world would still argue.
Cheers.
He he,
Good work Bob!
Now I put up with this Hotwhopper nonsense a lot at a very large Facebook Climate Change Discussion group,where a Judy Byatt post a lot of whoppers from Hotwhopper,that make me cringe at how low people descend when they read and accept misleading babbling warmist crap.
Here is the group for those who wants to wade in and fight for good science:
https://www.facebook.com/groups/climate.discussion/
So Hotwhopper blog is a recent entry in the warmist cult misdirection game?
I am Thomas Pearson (real name) there.
Nicely done, Bob. The more I read your posts, the more I come to appreciate your understanding of oceans and climate.
Feminism and climate alarmism go nicely together. They both share the same level of ignorance and failed approach of modelling reality to their agenda, and never reality. Just substitute key terms of one with another, and you’ll feel at home.Misogynists are deniers, CAGW is patriarchy … reasoning is pointless.
They also share gravy train mentality.
Bob it is always very tempting for a well educated person to try to correct the beliefs of an idiot but believe you me it is like banging your hea on a brick wall. The wall won’t budge but your head will sure as hell hurt.
After reading how CAGW proponents, usually, try to debunk science I’d say: “If to err is human… nobody can deny the astounding human level we have reached” (Quino, loosely translated)
Bob, send her a copy of “Who Turned On The Heat” for an early Christmas present. 🙂
Unfortunately your enlightening statements will be lost on her: way above her head… the poor thing.
I clicked on Hotwhopper and assumed from the obvious bollocks that it was an elaborate spoof. It seems I was wrong yet again. You can’t second-guess these [snip . . you know the rules and profanity doesn’t make your point any better . . mod]. They really are as mad as it says on the box.
Hi Bob-
Another posting full of information. It gets so deep that I don’t have the time to follow it all, but you are to be thanked for the amount of time that you devote to this cause.
Two minor corrections:
Near the end of the sentence
“Wang and Schubert (2014) find that the North Pacific SST warm anomalies during early 2013 created a “predilection” for dry conditions during the second half of the 2013-2013 “rainy season” in California, and Funk et al. (2014) also report that the observed Pacific SST anomalies during 2013-2014 contributed to the extremely low precipitation that was observed during 2013-2014.” is the bit “during the second half of the 2013-2013 “rainy season” in California”. Should the last “2013” be “2014”?
and
In “Example 5”, “your” is written “you’re”.
Thanks again for your many postings.
Ian
Thanks, Ian. I struck and corrected.
Cheers.
The Californian drought has been caused by the failure of the winter snows, not the summer heat or rains. Understanding that is the key.
The warmists focus on hear because the narrative says CO2 causes heat and THEN the heat causes bad things to happen. They mistake symptom for cause as they confuse correlation with causation.
Winter precipitation has not stopped because warmer, moister air is cooling but not releasing its moisture. The circulation pattern has changed.
The connection between CO2, a minor temp change of the Pacific and winter air movements though California is not visible. That is why models are needed. But the public is told a lie. Conjecture drives CAGW just as it did the reading of goat entrails for facts about the future for the ancient Romans.
One of the facts that I frequently deploy in discussions with wamanistas is tide gauges.
I always hold that one back, much like a trump ace, until they’ve spilled everything they’ve got.
Tide gauges are their worst enemy. Why? Because you can’t manipulate the data set. It can’t be adjusted because you think Grandpa Jones read the thermometer at a different time on some day in 1934, you can’t claim an adjustment is justified due to station move, or UHI, or anything else they typically regurgitate as a justification for data manipulation.
A tide gauge is what it is, period. And it even one single iota of what they spout is true, it would show up there, because their entire argument is all interconnected. If there is warming, there MUST be sea level rise.
There isn’t. Bang, done, and on to How ’bout those Red Sox?”
jimmaine,
Correctomundo. Tide gauges, when employed en masse, are just about impossible to argue with. One gauge might be affected by subsidence, and another by rising. But when all are averaged together, the result must be accurate, because movements of the crust must average out to zero.
You say the truth, jimmaine. I have looked all NOAA mean sea level plots and SL has been steady for 15-20 years and longer. That hard fact does not stop the fabrication of a SL rise, as at the U of Colorado and even NOAA (by using satellite altimetry plotted on a sloping base).
It is remarkable at the great array of labels that are invoked to counter any unwanted or inconvenient discussion: ‘concern trolls’, ‘tone trolls’… Some people live in a strange world.
It reminds me of the time my comment at Skeptical Science was deleted as a’Gish Gallop’, when it consisted of one directly related point with one supporting reference link.
Such people are completely indoctrinated and ruthless.
I wonder if it fries her circuits when Bob Tisdale is the only reason her blog traffic increases for brief periods. Must be sad to know that your regular readership pales in comparison to link through readers.
So far, there have not been that many jumps from WUWT to HotWhopper…only a few percent of the page views of this post. That’s typical of the traffic from here to my blog as well.
A few percent from WUWT in a half a day may be more than that blog receives in a year.
And this, in a nutshell, is the enormously serious problem. GCMs get so very many things just plain wrong!. They openly fail to simulate the temperature variation of most of the 20th and early 21st century in spite of using a 20-25 year stretch of it as a reference (training set) period. They utterly fail to correctly describe the lower troposphere — which is an absolutely enormous failure, given that the lower troposphere is basically where almost all of our weather happens. They fail to describe the behavior of the entire Pacific Ocean. They fail to predict the decadal time variations of rainfall, the violence or frequency of storms. It isn’t particularly clear what they do do a good job simulating, since the Earth’s climate system is strongly and nonlinearly coupled and making an error in any one of these major components of the Earth’s climate system would almost certainly force errors everywhere else.
The best that can be said of the models is that, when run, produce individual model, individual runs, that sort-of look like planetary weather. Until you look at them too closely and observe that they require continuous renormalization in order not to diverge on the hot or cold side because their time evolution is not, actually, conservative. They are integrated at an absurd spatiotemporal scale — one some 20 to 30 orders of magnitude larger than the scales that are likely to lead to a quantitatively relevant result. They have the wrong variance — seriously wrong, in most cases — the “weather” in these models, which require delicate and improbably precise tuning between the effect of the overdriven greenhouse gases and the overdamping aerosols to function at all, varies far more strongly than the actual weather does (hence, among other things, their assertion of more and more violent storms in those weather extremes and during the much more violent and extensive temperature changes). The variations have the wrong autocorrelation spectrum — which is, by the way, direct evidence that the models have the wrong physics internally, but who cares about a silly little thing like that? The thing is that they produce nifty graphs that really look like weather! I mean “climate”. As it changes. The weather, the climate, whatever. No two runs of any given model agree — they are not, in fact quantitatively or even qualitatively predictive. And not even the averages over many such runs — a meaningless quantity as far as the one actual trajectory of the one actual planetary climate is concerned — agree between truly independent models. Which, sadly, the models in CMIP5 are not — most of them share code, data, and many other things so that they really can’t even pretend to constitute some sort of statistical ensemble with predictive value in the mean, even though that is precisely how the IPCC uses them.
Finally, the models obviously cannot, and do not, quantitatively predict the large-scale decadal oscillations that equally obviously directly determine the efficiency of the planetary heat transport system. Let me explain just how big a problem that is. In far simpler systems — for example, a simple pan of water being uniformly warmed on the bottom and cooled at the top — as one increases the rate at which the bottom is being warmed, at various points in the warming the system smoothly conducts heat bottom to top, then convective turnover starts, typically signalled by the appearance of topologically stable convective rolls, then those rolls start to exhibit instabilities, and then the system successively self-reorganizes as the warming continues to increase into modes that are ever more efficient at moving the heat. Predicting even a qualitative response of the system in this highly nonlinear regime obviously requires a substantial quantitative knowledge of the particular convective structures involved, the topological quasiparticles of the nonlinear convective dynamics. A system with (say) two convective rolls is not going to respond the same way as a system with four, or fifty, or with rolls that are constantly breaking and reforming with ever changing numbers but with some sort of long term quasi-periodicity.
Do the models (say) correctly predict the PDO? The NAO? ENSO? Do they correctly predict the advent and strength of the monsoon in Asia, years in advance? Do they even predict variations in global patterns of atmospheric oscillation like this?
No. They do not. In fact, this is a major source of apologia. Why didn’t the models correctly predict “The Hiatus”? Because “The models couldn’t know that we would have several consecutive La Ninas” is an excuse I often hear. But think about what that means! It means that if something literally unpredictable by the models — that Ninas exceed Ninos for decadal timespans — occurs, the models are completely, unambiguously wrong, not even close! It means that Nino vs Nina matters (not that this isn’t obvious from the timeseries itself). It means that neglecting this when building the models means that even in the reference period, the models may “work” but they are still wrong as they neglect or underestimate the enormous impact of ENSO on the outcome and accomplish warming or cooling some other way (by means of overdriving opposed GHGs and aerosols, of course).
I’ve actually had a bit of experience in trying to balance out something far simpler than weather — just fitting nonlinear functions to data as a predictive model — when the nonlinear functions are large and have to be cancelled in order to produce a comparatively small total functional form. It is one of the most difficult of tasks, because even small errors in the training set data fit rapidly amplify outside of the domain where you forced them to work. A similar thing occurs in the theory of ODEs, where “stiff” ODEs are by definition ones where tiny errors amplify as one integrates.
The climate is far, far, beyond merely being stiff. It is chaotic. But like many other chaotic systems, that doesn’t mean that it isn’t structured, or that the structure isn’t important. It just means that unless you get the structure exactly right, you won’t even be able to make qualitative statements about what the chaotic system is likely to do, let alone what it actually does. In this sense, failing to be able to quantitatively predict the PDO, ENSO etc, let alone variations in the thermohaline circulation, let alone all local phenomena like blocking highs that again are named, commonly occurring quasiparticle structures that appear and persist for “important” lengths of time, that have a huge impact on the evolution of planetary temperatures and rainfall distributions and much more, and that the GCMs are utterly blind to, incapable of predicting even the right probability distribution of such phenomena, let alone the detailed evolution of a single one given their initial conditions at the limits of our ability to resolve them.
But none of this is likely to stop people from running the models and claiming that the results are relevant to the future, while avoiding any use of the word predict because predictions can be falsified where mere projections and prophecies never can be.
rgb
Thanks, rgb.
I agree with those comments. I would also like to point out that if the mainstream consensus is wrong then there will never be a decent model made by those who follow the consensus.
A fellow who calls himself “gallopingcamel” and posts at a site we are not supposed to link to but is run by a tall fellow and won best European blog last year, said he is an ex-colleague of yours. He was responding to a comment that said, “The thing that bothers me about the so called down-welling IR is that excited CO2 molecules collide with other atmospheric gases before they have a chance to emit that photon.” He responded that he had tried to get you to admit something explained at a link to some post about a “Robinson and Catling Model” that I did not read.
I figure that you and your ex-colleague both understand that we may have looked at this whole problem wrong. It may be that the magic molecule does darn little and that we are barking up the wrong tree altogether. (“we” as in the consensus of today’s science on climate)
All those words just to say, “models can be real hard, especially if you get the basic science wrong”.
~Mark
Yes, RapidCamel and I know each other pretty well;-). Yes, it is true that CO_2 molecules almost always collide with other molecules and transfer some or all of the energy they absorb before they have a chance to reradiate.
However, that does not make it correct to assert anything but that CO_2 remains in thermal equilibrium (or nearly so) with the surrounding atmosphere — indeed, it is one of the primary things that helps to warm it as the air otherwise is rather transparent to both visible and LWIR. But forget not the Laws of Kirchoff! You cannot have a system in detailed balance (that is to say, in dynamical thermal equilibrium) where absorption and emission are not symmetric. All that happens is that CO_2 absorbs LWIR and heats both itself and the surrounding air until the rate that it loses energy, both to the O_2 and N_2 surrounding it and to reradiation, matches the rate that it gains energy from the surrounding N_2 and O_2 and from radiation re- and otherwise.
That is, the CO_2 is not disequilibrated with its surroundings by absorbing LWIR, holding it a while at a much higher energy, and then releasing it as a sort of “elastic collision” or “elastic scattering” process. The interaction is inelastic and highly nonlinear. But it still has to be energy symmetric as long as the CO_2 is remaining at a roughly constant temperature — ins must equal outs.
Besides, it is pointless to argue about the theory of the GHE when one can just measure it. The merest glance at TOA and BOA spectrographs and you simply have to go “Yup, there’s the greenhouse effect all right, right there where it should be.”
rgb
Thank you, rgbatduke. Appreciate your posts.
Any model not showing La Ninas predominating during the cool phase (as has started) of the PDO is prima facie going to be as wrong as it can be. But then GCMs were hatched long before the PDO & AMO were even discovered.
Dr. Brown,
I feel this is an excellent summation of the numerous problems with climate modelling. In particular the complexities of Raleigh-Bernard circulation. This is a critical flaw in the models, they are not actually running CFD in the vertical dimension. Vertical non-radiative energy transport is parametrised. If you don’t increase the speed of vertical circulation for increased radiative subsidence, you model surface warming. Essentially the algorithms used for vertical parametrisation say that CO2 will cause significant warming, so that’s what the models show.
Dr Brown, I look forward to your most informative comments. I usually read them a couple of times as I don’t want to miss anything.