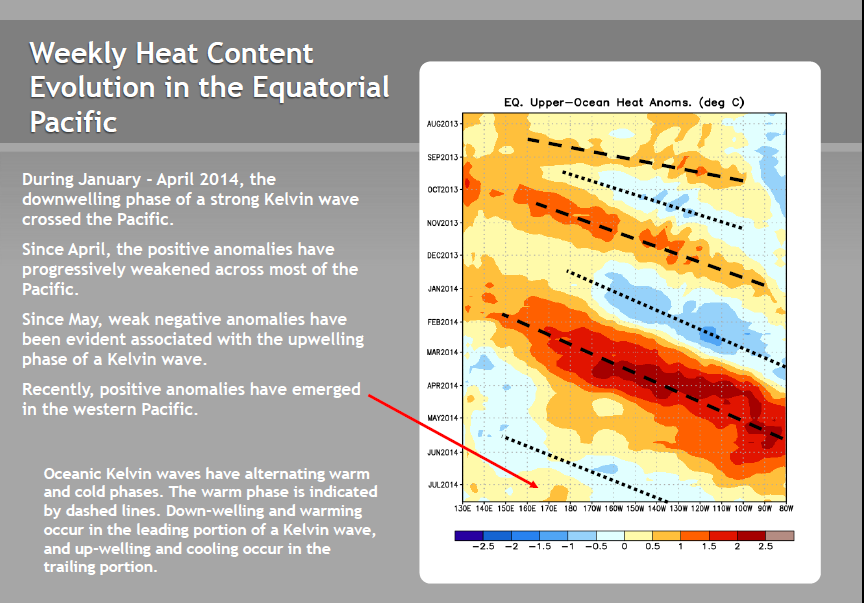
 There may still be a chance for an El Niño during the 2014/15 ENSO season. A new “pocket” of warm subsurface water has formed in the western equatorial Pacific. See the note in the page from the most-recent NOAA Weekly ENSO Update to the right. (Please click on illustration for full-sized image.) In their update, NOAA also makes note of that anomaly during their discussion of the Hovmoller on their page 15. That subsurface temperature anomaly appears to have been caused by the recirculation of warm water from the earlier downwelling (warm) Kevin wave, not by another westerly wind burst. Come along, I’ll show you.
We’ve illustrated and discussed in recent posts the quickly diminishing remnants of the strong downwelling Kelvin wave that had carried a large pulse of warm water from the western equatorial Pacific eastward as far as South America. See…
- Part 11 – Is the El Niño Dying?
- Part 12 – July 2104 Update – The Feedbacks Need to Kick in Soon and
- Part 13 – More Mixed Signals…
…of this series. And the bottom line of those posts was, if the trade winds along the equatorial Pacific did not start to provide the feedback necessary to support an El Niño, the 2014/15 El Niño was going to die an early death…basically, it would run out of warm water.
Now a warm subsurface temperature anomaly has appeared in the west-central equatorial Pacific. See Figure 1, which is the most recent (a 5-day average centered on July 22) equatorial cross section available from the NOAA GODAS website. That pocket of warm subsurface water has been there, growing stronger, for the past few weeks.
Figure 1 – Equatorial Cross Section
Yet, according to the equatorial wind stress data, there has not been a westerly wind burst in the western equatorial Pacific for a few months to nudge any warm water from the West Pacific Warm Pool. See Figure 2. So where’d the warm water come from?
Figure 2 – Wind Stress Hovmoller
For that, we’ll have to look at an animation of the temperature anomaly maps for the top 300 meters of the oceans. But before we do, let me first show you what you’ll be looking for. See Figure 3. There is a pocket of warm water off the equator near the dateline. That pocket of warm water will be isolated as the equator cools. It travels slightly west and then gets “drawn” to the equator again.
Figure 3
And in Animation 1 you can watch that transpire. The animation starts with the May 3rd pentad (5-day average) and runs through July 22nd.
Animation 1
For those interested in watching the off-equatorial pocket of warm water form, see the animation here of sea level anomaly maps and temperature anomaly maps for the top 300 meters of the oceans from July Update. The “T300” maps are on the right. That animation runs from the start of the year to July 2, 2014, so it does not capture the warm water returning to the equator. That’s only happened over the past few weeks.
Animation 2 includes the equatorial cross sections for the same time period. Yes, there are other positive subsurface anomalies west of the one nearer to the dateline, so without the T300 maps, it’s difficult to speculate about how the larger warm anomaly formed.
Animation 2
BOTTOM LINE
Regardless of where that warm anomaly originated, it’s there now. The equatorial undercurrent in the Pacific (a.k.a the Cromwell Current) should now carry that anomaly to the east, where it should become a more-positive anomaly (because the water in the east is normally cooler than in the west). And if that additional warm water just south of the equator in the western tropical Pacific should also feed into the equatorial undercurrent, then there will be even more warm water to possibly fuel an El Niño for this year. (Yeah, I know, there’s lots of “shoulds” in those sentences, leading up to a “possibly”.)
We’ll just have to watch and see what Mother Nature decides to do. She’s always in control…and she’s always full of surprises.
EARLIER POSTS IN THIS SERIES
- The 2014/15 El Niño – Part 1 – The Initial Processes of the El Niño.
- The 2014/15 El Niño – Part 2 – The Alarmist Misinformation (BS) Begins
- The 2014/15 El Niño – Part 3 – Early Evolution – Comparison with 1982/83 & 1997/98 El Niño Events
- The 2014/15 El Niño – Part 4 – Early Evolution – Comparison with Other Satellite-Era El Niños
- The 2014/15 El Niño – Part 5 – The Relationship Between the PDO and ENSO
- The 2014/15 El Niño – Part 6 – What’s All The Hubbub About?…
- The 2014/15 El Niño – Part 7 – May 2014 Update and What Should Happen Next
- The 2014/15 El Niño – Part 8 – The Southern Oscillation Indices
- The 2014/15 El Niño – Part 9 – Kevin Trenberth is Looking Forward to Another “Big Jump”
- The 2014/15 El Niño – Part 10 – June 2014 Update – Still Waiting for the Feedbacks
- The 2014/15 El Niño – Part 11 – Is the El Niño Dying?
- The 2014/15 El Niño – Part 12 – July 2014 Update – The Feedbacks Need to Kick in Soon
- The 2014/15 El Niño – Part 13 – More Mixed Signals
And for additional introductory discussions of El Niño processes see:
- An Illustrated Introduction to the Basic Processes that Drive El Niño and La Niña Events
- El Niño and La Niña Basics: Introduction to the Pacific Trade Winds
- La Niñas Do NOT Suck Heat from the Atmosphere
- ENSO Basics: Westerly Wind Bursts Initiate an El Niño
FURTHER READING
My ebook Who Turned on the Heat? goes into a tremendous amount of detail to explain El Niño and La Niña processes and the long-term aftereffects of strong El Niño events. Who Turned on the Heat? weighs in at a whopping 550+ pages, about 110,000+ words. It contains somewhere in the neighborhood of 380 color illustrations. In pdf form, it’s about 23MB. It includes links to more than a dozen animations, which allow the reader to view ENSO processes and the interactions between variables.
I’ve lowered the price of Who Turned on the Heat? from U.S.$8.00 to U.S.$5.00. A free preview in pdf format is here. The preview includes the Table of Contents, the Introduction, the first half of section 1 (which was provided complete in the post here), a discussion of the cover, and the Closing. Take a run through the Table of Contents. It is a very-detailed and well-illustrated book—using data from the real world, not models of a virtual world. Who Turned on the Heat? is only available in pdf format…and will only be available in that format. Click here to purchase a copy. Thanks. (I also am very happy to receive tips or donations.)
Theodore White and others, thank you for doing real science. That our world has but one source of energy, and it’s moods and perambulations control our climate and well being seems to be forgotten by many. Those that take the sun as a constant with minor variations that do not affect our climate, and blame mankind are barking mad.
Re Monckton of Brenchley query..
Seismic activity and perhaps associated volcanism might be able to generate big pools of warm water. There’s a lot of energy associated with large faults/earthquakes. Ask the residents of North Sumatra and coastal Thailand.
http://www.trunity.net/sam2/view/article/51cbf4007896bb431f6aeb04/
Theodore White says:
You will not gain any knowledge of El Nino or La Nina by treating the effects as ’causes’ which is the reason why 99% of those who try to forecast these climate events fail to do so.
http://oi58.tinypic.com/110gl8i.jpg
well, being a good ol’ boy, all i know is what i see in and around my yard:
it’s been cool most of the spring & summer, with June Gloom well into July, and still making an occasional appearance.even now. we’ve had a few warm/hot spells, but a good portion of those have been monsoonal, which is NOT normal (not unheard of either, just rare, like once every few years).
IOW, this summer is pretty much a replay of last summer here in The Valley, like totally, and if #Failifornia is going to get an El Nino this Christmas, Mother Nature is going a good j*b of hiding it.
I don’t see any reason why sub sea tectonics/vulcanism can’t have a role in ENSO, but I suspect we don’t know enough to gauge the extent of these effects. Here’s an interesting dissertation that summarizes some of these factors: http://www.met.rdg.ac.uk/mscdissertations/An%20Investigation%20into%20Possible%20Interactions%20between%20Volcanoes%20and%20El%20Nino.pdf
I speak for Californians when I say, I hope we get at least a mild El Niño. We could use some rain. (And it’s definitely been more humid than usual here in So Cal, so…we’ll see.)
What’s a “Kevin” wave? Is it just a mis-spelled “Kelvin” wave?
Ashby, the dissertation you linked to explains the role of aerosols from explosive volcanic activity in the equatorial band triggering an El Nino event. This has been modeled and the likely mechanism is known. It is why some areas of Earth are warmed by such an event but then grow cold in subsequent years as aerosols continue to spread and less warmed waters make there way through the global oceanic currents and circulation highway. The takeaway key is that the volcanic explosion has reach into the stratosphere and disrupt the Low West and High East pressure systems that kick the trade winds up a notch and in the normal range. When those dual West/East pressure systems are weakened which in turn disrupts the Walker cells, is when El Nino is triggered.
To further explain, the aerosol cloud gets over the top of the West Low Pressure system that normally sits over the Indonesian islands coast lines. It is a combination of the warm pool and solar heating there that forces warmed air to shoot up thus leaving low pressure below the building cloud tops. This low pressure beckons to the trade winds in the lower troposphere to fill that void, thus keeping the entire Pacific equatorial band in the normal or La Nina range. When the aerosols block the sun above the cloud tops, that low pressure is lessened because surface air is no longer being warmed by the sun. So the trade winds slacken and an El Nino is triggered.
Actually I mislabeled. The aerosol substance is called a “veil” not a cloud, “…the aerosol VEIL gets over the top of the…”
Goodness my grammar sucked in those comments. I just got back from rounding up a naughty herd of market lambs that got out of their enclosure and into timothy and alfalfa fields so my writing skills obviously took a time out for a while.
Bob Tisdale says:
July 26, 2014 at 2:29 pm
The hypothesis is still being actively investigated:
http://www.geography.hunter.cuny.edu/~hsalmun/pg130web/elnino.html
http://wattsupwiththat.com/2012/02/15/do-underwater-volcanoes-have-an-effect-on-enso/
For earlier studies, eg after El Chichon eruption:
http://volcano.oregonstate.edu/el-nino
milodonharlani says: “The hypothesis is still being actively investigated….”
Your first and third links are not about subsurface volcanos, which is the topic of discussion, and you second link is nothing more than speculation that overlooks the fact that the warm water for an El Nino comes from the west Pacific Warm Pool, not the eastern tropical Pacific.
Another discussion thread about ENSO with no mention of Peruvian upwelling. That is the best metric of what’s really happening in ENSO. Joe Bastardi and Joe D’Aleo are closest to the mark with their prediction of a reactive La Nina. The question here is whether this recent weak and abortive “el Nino” had the necessary strength to cause a reactive upwelling-driven La Nina.
As for the new small western subsurface warm pool. If it surfaces in the west it will only strengthen the trades. If it is borne eastwards subsurface it won’t revive el Nino but may prolong its death. This could have the effect of making the responsive La Nina stronger. If this La Nina starts about now then it will likely be weak or moderate, but if its onset is delayed till the end of the year then we could be looking at a strong upwelling-driven La Nina. This is because a nino-nina transition around Christmas-new year resonates with the phase locking of ENSO to the annual cycle.
A very nice touch, Bob, ‘Come along, I’ll show you’. You are attracting people who can understand you.
=============
phlogiston says: “Another discussion thread about ENSO with no mention of Peruvian upwelling. That is the best metric of what’s really happening in ENSO.”
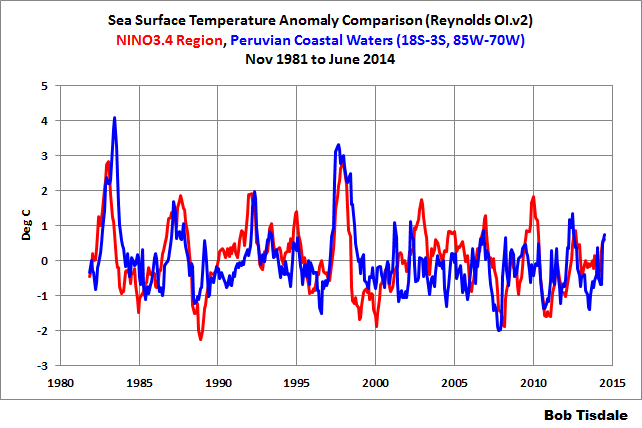
And there are reasons for that. If you were to plot the sea surface temperature data for the Peruvian coast and compare it to an ENSO index (NINO3.4 sea surface temperature anomalies for example) I believe you’ll find that sea surface temperatures off the Peruvian coast are a poor ENSO index, because they are influenced by the Peruvian upwelling. The sea surface temperatures off the Peruvian coast also fail to capture central Pacific El Nino events (El Nino Modoki). As a result, the correlation between NINO3.4 data and the data for the Peruvian coast is only 0.55. And as you’ll note in the following graph, sometimes the Peruvian coastal data leads the ENSO index, and sometimes it lags. Sometimes it’s out of phase with ENSO, and sometimes it’s in phase.
Therefore, there is no reason to include a discussion of the Peruvian coastal waters in an El Nino post.
Bob Tisdale says:
July 28, 2014 at 3:22 am
phlogiston says: “Another discussion thread about ENSO with no mention of Peruvian upwelling. That is the best metric of what’s really happening in ENSO.”
Therefore, there is no reason to include a discussion of the Peruvian coastal waters in an El Nino post.
I was criticizing more the thread discussion than your article.
Also I greatly appreciate the data you posted on Nina 3.4 and the Peruvian coastal waters.
Last time I checked, Peruvian upwelling was one half of the coin of the Bjerknes feedback (which I first learned about from you) the other side being the trade winds.
And as we all know, the Bjerknes feedback is the central engine of ENSO, to which everything else is secondary.
And yet – we have huge volumes of hot air in the discussion thread about the trade winds and silence about Peruvian upwelling. Why this strange asymmetry? That was what prompted my comment.
We even have significant time given to discussing if el Nino is sun-spot driven and happens regularly every 11 years – or if it is caused by oscillating volcanic activity. Or magnetism, or any other of the usual suspects. It seems anything goes – except of course the unmentionable Peruvian upwelling.
Did I miss the memo about Peruvian upwelling being the unmentionable taboo of ENSO?
Is it like mentioning the war to Germans, or the name “Jehovah” to certain Jews? Anyone?
What really confirmed that the recent incipient el Nino had finally died a death was when the anchovies returned to the Peruvian fishery, signaling the cold water upwelling had returned:
http://news.yahoo.com/peru-says-el-nino-threat-over-waters-cooling-232314417.html
I take your point about el Nino Modoki possibly not involving the far east Pacific upwelling however. That is interesting and something I will have to think about.
My take on ENSO – and I believe yours also – is that it is an intermittent nonlinear oscillator and as such is driven by the intermittent positive feedback regime known as the Bjerknes feedback.
Therefore an approach to ENSO focusing on cause rather than effect necessarily focuses on the components of the Bjerknes feedback, the eastern upwelling as well as the trade winds, and not only SST patterns.
The depth profiles of Pacific temperatures show that upwelling does not always correlate directly with overlying SST. Thus I don’t think that the significance to ENSO of Peruvian upwelling can be judged only by Nino1+2 – Nino 3.4 SST correlation.
Do we imagine that the supply of Peruvian deep upwelling – linked to THC – is constant and invariant? From what is known about turbulent fluid flow and mixing this assumption is certain to be false. Since there is thus variability in the upwelling supply, as an ocean current phenomenon separate from surface meteorology, this is another potential source of a timing input to ENSO that is currently being overlooked entirely.
so appreciate your rigorous, insightful work. While truth is relative, your continual effort to approach that asymptote is a star in the abyss of todays idiocracies everywhere. So my absurd curiosity asks – what’s with the month-long monsoon flow we feel in No Cali? Did someone surmise recently that that’s where all the EN heat is going? I want my ElNino back. Can’t we all please summon it back with shamanic focus?
Some of it may have recirculated. Some of it seems to have ended up here on the West Coast of the US. SSTs are above normal just now. I hope it lasts into the winter and gives us a better rainy season than the past 3.
Will be sucked aloft. Mr Blobby moving on, SOI starting to back off again, hoovers spinning up. See GFS/NCEP model look ahead via nullschool.
http://s2.postimg.org/qomy4eqvr/Troup_SOI.png
http://s2.postimg.org/417oy9bbr/Pressures.png
Despite all the talk, there will be no El Nino this year, as I have repeatedly said.
The next ENSO cycle will be a major La Nina, but that will not take place until 2020-2022, and will do so under the new climate regime of global cooling that will begin officially in mid-December 2017.
Although NOAA, which has never forecasted an ENSO cycle in advance, continues to dream on about the ‘super El Nino’ that has not materialized as they and other forecasted and spread widely throughout the media, it appears that there is backing off now by the Australians, who put out this statement on Tuesday, July 29, 2014:
“Despite the tropical Pacific Ocean being primed for an El Niño during much of the first half
of 2014, the atmosphere above has largely failed to respond, and hence the ocean and
atmosphere have not reinforced each other.
As a result, some cooling has now taken place in the central and eastern tropical Pacific Ocean, with most of the key NINO regions returning to neutral values.
While the chance of an El Niño in 2014 has clearly eased, warmer-than-average waters
persist in parts of the tropical Pacific, and the (slight) majority of climate models suggest
El Niño remains likely for spring. Hence the establishment of El Niño before year’s end
cannot be ruled out.
If an El Niño were to occur, it is increasingly unlikely to be a strong event.
Given the current observations and the climate model outlooks, the Bureau’s ENSO Tracker
has shifted to El Niño WATCH status.
This means the chance of El Niño developing in 2014 is approximately 50%, which remains significant at double the normal likelihood of an event.
[Translated, it means that they do not know.]
El Niño is often associated with wide scale below-average rainfall over southern and eastern
inland areas of Australia and above-average daytime temperatures over southern Australia.
Similar impacts prior to the event becoming fully established regularly occur.
The Indian Ocean Dipole (IOD) index has been below −0.4 °C (the negative IOD threshold)
since mid-June, but needs to remain negative into August to be considered an event. Model
outlooks suggest this negative IOD is likely to be short lived, and return to neutral by spring.
A negative IOD pattern typically brings wetter winter and spring conditions to inland and
southern Australia.”
All the astronomic indicators which I outlined earlier on this post do not show that a ‘super El Nino’ has been coming, which is why i continued to say that we will not see El Nino this year, or next either.
What is happening is that the world is trending toward global cooling, which is the reason for the extremes of weather we’ve been witnessing for years now as the globe cools down according to the lessening of sunspots and the Sun’s coming hibernation phase into solar cycle #25.
In my climate forecast, the next ENSO cycle is 7-8 years away and it will be of the cold oscillation phase of La Nina and a major one at that.
ENSO index plummeting – nearly zero.
Not sure if anyone is still looking at this thread…..but I found this today.
http://www.stockandland.com.au/news/agriculture/general/news/threat-of-el-nino-recedes/2707161.aspx?src=rss
The hypothesis is based upon the observed correlation between El Niños & seismic activity of all kinds, not just tremors, to include thermal inputs from volcanic eruptions:
http://www.trunity.net/sam2/view/article/51cbf4007896bb431f6aeb04/
There is also a correlation the other way, ie of ENSO on earthquakes. From PTotRS A, 2010:
http://rsta.royalsocietypublishing.org/content/368/1919/2481.full
Statistical analysis of the El Niño–Southern Oscillation and sea-floor seismicity in the eastern tropical Pacific
Guillas, et al
We present statistical evidence for a temporal link between variations in the El Niño–Southern Oscillation (ENSO) and the occurrence of earthquakes on the East Pacific Rise (EPR). We adopt a zero-inflated Poisson regression model to represent the relationship between the number of earthquakes in the Easter microplate on the EPR and ENSO (expressed using the southern oscillation index (SOI) for east Pacific sea-level pressure anomalies) from February 1973 to February 2009. We also examine the relationship between the numbers of earthquakes and sea levels, as retrieved by Topex/Poseidon from October 1992 to July 2002. We observe a significant (95% confidence level) positive influence of SOI on seismicity: positive SOI values trigger more earthquakes over the following 2 to 6 months than negative SOI values. There is a significant negative influence of absolute sea levels on seismicity (at 6 months lag). We propose that increased seismicity is associated with ENSO-driven sea-surface gradients (rising from east to west) in the equatorial Pacific, leading to a reduction in ocean-bottom pressure over the EPR by a few kilopascal. This relationship is opposite to reservoir-triggered seismicity and suggests that EPR fault activity may be triggered by plate flexure associated with the reduced pressure.
(Sorry about delayed response. Have been on honey moon.)