![480px-Antarctica_6400px_from_Blue_Marble[1]](http://wattsupwiththat.files.wordpress.com/2014/05/480px-antarctica_6400px_from_blue_marble1.jpg?quality=83) From Geophysical Research Letters and the University of Leeds:
From Geophysical Research Letters and the University of Leeds:
Three years of observations show that the Antarctic ice sheet is now losing 159 billion tonnes of ice each year — twice as much as when it was last surveyed. See below for some sanity check calculations on why 159 billion tonnes really isn’t much more than a flyspeck in the scheme of things.
===========================================
Antarctica’s ice losses on the rise
Three years of observations show that the Antarctic ice sheet is now losing 159 billion tonnes of ice each year – twice as much as when it was last surveyed.
A team of scientists from the UK Centre for Polar Observation and Modelling, led by researchers at the University of Leeds, have produced the first complete assessment of Antarctic ice sheet elevation change.
They used measurements collected by the European Space Agency’s CryoSat-2 satellite mission, which carries an altimeter specially designed for this task.
In sharp contrast to past altimeter missions, CryoSat-2 surveys virtually all the Antarctic continent, reaching to within 215 kilometres of the South Pole and leading to a fivefold increase in the sampling of coastal regions where today’s ice losses are concentrated.
Overall, the pattern of imbalance continues to be dominated by glaciers thinning in the Amundsen Sea sector of West Antarctica.
However, thanks to the improved capabilities of CryoSat-2, problem areas such as the rugged terrain of the Antarctic Peninsula can now also be surveyed.
On average West Antarctica lost 134 gigatonnes of ice, East Antarctica three gigatonnes, and the Antarctic Peninsula 23 gigatonnes in each year between 2010 and 2013 – a total loss of 159 gigatonnes each year.
The polar ice sheets are a major contributor to global sea level rise and, when combined, the Antarctic losses detected by CryoSat-2 are enough to raise global sea levels by 0.45 millimetres each year alone.
In West Antarctica, ice thinning has been detected in areas that were poorly surveyed by past satellite altimeter missions.
These newly-mapped areas contribute additional losses that bring altimeter observations closer to estimates based on other approaches.
But the average rate of ice thinning in West Antarctica has also increased, and this sector is now losing almost one third (31%) as much ice each year than it did during the five year period (2005-2010) prior to CryoSat-2’s launch.
Lead author Dr Malcolm McMillan from the University of Leeds said: “We find that ice losses continue to be most pronounced along the fast-flowing ice streams of the Amundsen Sea sector, with thinning rates of between 4 and 8 metres per year near to the grounding lines of the Pine Island, Thwaites and Smith Glaciers.”
This sector of Antarctica has long been identified as the most vulnerable to changes in climate and, according to recent assessments, its glaciers may have passed a point of irreversible retreat.
Launched in 2010, CryoSat carries a radar altimeter that can ‘see’ through clouds and in the dark, providing continuous measurements over areas like Antarctica that are prone to bad weather and long periods of darkness.
The radar can measure the surface height variation of ice in fine detail, allowing scientists to record changes in its volume with unprecedented accuracy.
Professor Andrew Shepherd, also of the University of Leeds, who led the study, said: “Thanks to its novel instrument design and to its near-polar orbit, CryoSat allows us to survey coastal and high-latitude regions of Antarctica that were beyond the capability of past altimeter missions, and it seems that these regions are crucial for determining the overall imbalance.”
“Although we are fortunate to now have, in CryoSat-2, a routine capability to monitor the polar ice sheets, the increased thinning we have detected in West Antarctica is a worrying development. It adds concrete evidence that dramatic changes are underway in this part of our planet, which has enough ice to raise global sea levels by more than a metre. The challenge is to use this evidence to test and improve the predictive skill of climate models.”
Professor David Vaughan of the British Antarctic Survey said: “The increasing contribution of Antarctica to sea-level rise is a global issue, and we need to use every technique available to understand where and how much ice is being lost. Through some very clever technical improvements, McMillan and his colleagues have produced the best maps of Antarctic ice-loss we have ever had. Prediction of the rate of future global sea-level rise must be begin with a thorough understanding of current changes in the ice sheets – this study puts us exactly where we need to be.”
Dr Ian Joughin at the University of Washington, author of a recent study simulating future Antarctic ice sheet losses added: “This study does a nice job of revealing the strong thinning along the Amundsen Coast, which is consistent with theory and models indicating this region is in the early stages of collapse.”
The findings from a team of UK researchers at the NERC Centre for Polar Observation and Modelling, are published in the journal Geophysical Research Letters. Professor Vaughan and Dr Joughin were not involved in the study.
Sanity Check:
From Climatesanity: Conversion factors for ice and water mass and volume
If one cubic kilometer of water (i.e., one gigatonne of water) is spread evenly over the entire 361 million square kilomters, the thickness of the new layer of water will be given by:
1 km³ / 361 x 106 km² = 2.78 x 10⁻⁶ meters = 2.78 microns.
Or, in terms of gigatonnes:
1 Gt x (1 km³/Gt) / 361 x 106 km² = 2.78 x 10⁻⁶ meters = 2.78 microns / Gt
That is, one cubic kilometer of water (i.e., one gigatonne of water) will add less than 3 millionths of a meter to the oceans!
From the press release, we are seeing about 159 billion tons/year of ice converted to meltwater (unless it sublimates), so the effect on sea level would be 159/1000 or 0.159 159 x 3 millionths of a meter, or 477 millionths of meter of sea level rise per year from this. (or in other words 0.47 mm which works out to 47mm/century or ~1.85 inches/century)
For another perspective, a gigatonne of water is approximately one cubic kilometer. Frozen as ice, it would be expanded slightly, but for the purposes of perspective lets just say that is negligible. So, the ice loss per year would be 0.159 cubic kilometers.
According to the British Antarctic Survey BEDMAP2 project:
The derived statistics for Bedmap2 show that the volume of ice contained in the Antarctic ice sheet [is] 27 million km3…
Source: http://www.antarctica.ac.uk/bas_research/our_research/az/bedmap2/index.php
And thanks to those helpful kidz at “Skeptical Science”, we have this graphic depicting a cubic kilometer of ice. John Cook writes in 2010:
A visual depiction of how much ice Greenland is losing
One gigatonne is one billion tonnes. To get a picture of how large this is, imagine a block of ice one kilometre high by one kilometer wide by one kilometre deep (okay, the edges are actually 1055 metres long as ice is slightly less dense than water but you get the idea). Borrowing from alien invasion movies, the scale is well illustrated by comparing a gigatonne block of ice to a famous, historical landmark like the Empire State Building:
![empire_state1[1]](http://wattsupwiththat.files.wordpress.com/2014/05/empire_state11.jpg?quality=83)
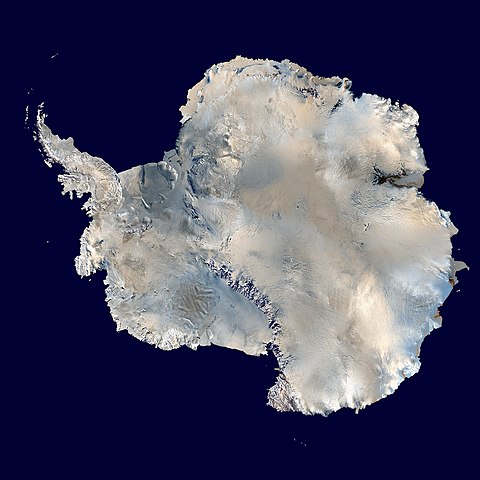
OK there are 14 million square kilometers of ice surface in Antarctica, not counting sea-ice. See if you can spot the tops of the 159 of these square kilometer ice blocks from this satellite view
Now imagine just 0.159 159 of those 1 cubic kilometer ice blocks missing each year. Scary, huh? Damian Carrington at the Guardian thinks so:

And so, the loss of 0.159 159 cubic kilometers of ice per year is apparently headline worthy, because at that rate of loss, it would take 169,811 years to lose all the 27 million cubic kilometers of Antarctic ice.
I’m pretty sure we’ll have gone through a few ice ages by then.
(Update: I made an error in the initial post with units, where I conflated kiloton/gigaton in one step, fixed)
“In West Antarctica, ice thinning has been detected in areas that were poorly surveyed by past satellite altimeter missions”.
Hmm! So they find ice is thinning in the very parts of Antarctica that they don’t know much about anyhow as it was poorly surveyed by past satellite missions.
Conclusion; We haven’t any real idea whether the ice is thinning or not because we haven’t much of an idea on what was there or what was happening to the ice there previously but it makes for a nice alarmist paper and keeps our funding going..
Urgent! Send more money!
Bullshit. The next ice age will put an end to that idea.
Are they furnishing the temperature data that is making this meltdown happen?
Is anyone asking for the temperature records at the melting sites for this period of time? Is this melting ice or ice breaking off from the expanding ice shelf? Some basic info would be appreciated.
Tom in Florida says:
May 20, 2014 at 1:21 pm
” Keep in mind that current precession has Southern Hemisphere summer solstice at perihelion”
Perihelion is approximately January 3rd/4th. This is 14 days after the solstice. Around the year 1250 the solstice and perihelion occurred at the same time.
http://www.observingstars.com/perihelion_aphelion.htm
chuck says:
May 20, 2014 at 4:01 pm
“Perihelion is approximately January 3rd/4th. This is 14 days after the solstice. Around the year 1250 the solstice and perihelion occurred at the same time. ”
Yes, I should have said “near” not “at”. Was just making the point that Earth is closest to the Sun during SH summer.
Half a mm per year and what is the error bar when measuring global sea level rise (I suspect that it is a lot higher than that?)
SIGINT EX says:
May 20, 2014 at 10:01 am
I see from your first link that DGFI likes to ‘further improve’ the ‘data’ with models!
To further improve the data, the use of external orbits (e.g. from ESOC) as well as the utilization of a hybrid sea state bias model (e.g. provided by Altimetrics) is recommended.
Sounds like climate science.
Relax alarmists, both East Antarctica and Greenland have accumulation rates that have increased over the past two decades….
http://hockeyschtick.blogspot.com/2014/05/new-paper-finds-e-antarctic-snow.html
http://hockeyschtick.blogspot.com/2014/05/new-paper-finds-greenland-ice.html
This guy says this:
Who’s right?
Forgot to add the 1Gt before “= the mass of 1 cubic kilometer of fresh water”
Jonathan Amos Science correspondent, BBC News article on this 19/5/2014 says “It has an area, called the Amundsen Sea Embayment, where six huge glaciers are currently undergoing a rapid retreat – all of them being eroded by the influx of warm ocean waters that scientists say are being drawn towards the continent by stronger winds whipped up by a changing climate.About 90% of the mass loss from the West Antarctic Ice Sheet is going from just these few ice streams.
At one of them – Smith Glacier – Crysosat sees the surface lowering by 9m per year.”
It says the Smith Glacier is having surface lowering of 9 meters a year!
not in the above article that I can see
now thats a lot of lowering or a might big blooper by the Cyrosat people. Or bad reporting.
any further comment on this weird claim , Anthony
It would seem to be quite different to “thinning rates of between 4 and 8 metres per year near to the grounding lines of the Pine Island, Thwaites and Smith Glaciers.””
“Overall, the pattern of imbalance continues to be dominated by glaciers thinning in the Amundsen Sea sector of West Antarctica.”
Is there any chance of Antarctica tipping over as Guam nearly did?
robroy says:
May 20, 2014 at 4:50 pm
“Relax alarmists, both East Antarctica and Greenland have accumulation rates that have increased over the past two decades”
…
However, “accumulation” without melt and calving rates does not give you net gain or loss numbers.
“””””…..Reef fish lose brain power as oceans acidify
Researchers at the Georgia Institute of Technology say reef fish are likely to suffer from cognitive decline as they adapt to higher levels of CO2 in the water over the next century……”””””
Just found this piece of climate science. It’s time to redesign all my flies, to target stupid fish, instead of the smart ones.
Maybe its tongue is retreating 9 meters a year.
I think the real reason why they hype up Global Warming is because there really is a threat but it’s exaggerated in order for peons like us to notice. If they just stated the facts of what the climate is doing it wouldn’t make headlines and nobody would even glance at it.
We have never had this many people on the planet before except before Noah. There are scientists that believe there was an *ice field* around our planet during Noah’s time that acted as a lens making a lot of the earth have the same average temps of 74F.
What happened was that eventually that ice field began to melt but since there was a lot of liquid it came as heavy rain all over.
Silver Falls State Park in Oregon has minerals and rocks that can only be found under the ocean despite being at an elevation of 1500 feet in the foothills of the Cascades surrounded by tall Evergreens which I believe was when the world wide flood happened.
In fact I believe Atlantis was destroyed by the very same flood as they grew too full of themselves with their advance mind technology and the government likely viewed themselves as Gods to rule over people using technology to control the population just like what is happening now with weather modification from the Star Wars weapons program Clinton signed.
There has been tropical plants found deep under Artic ice which shows at one time tropical flora grew at that latitude.
If we continue to fight for resources instead of sharing and exploring for more we will wipe ourselves from existence by destroying the atmosphere. In fact I believe that is what happened to the Mars ancient civilization which is why there appears to be hidden structures but NASA refuses to talk about it when questioned.
They likely had their own weather modification programs that sucked away the atmosphere allowing the solar winds to come tearing up the place thus destroying the N and S magnetic poles.
Could that be our future too?
47 mm/century sea rise may be an overestimate. Most of the melting land ice is submerged in Amundsen sea. Like sea ice, it will not contribute to sea level rise. It may even lower sea level because water has higher density (lower volume per mass) than ice. Imagine a glass made of ice with water in it. If the ice submerged in water melts, will the water level rise or fall?
@policycritic says:
May 20, 2014 at 5:57 pm
Hi,
There was a discussion (see comments at the top) how billion is defined. Sometimes the situation is quite messy. Old definition, new definition, EU, USA, England. American billion is equal to European milliard ad so on. So I added a link to original scientific article with international SI units, just to be convinced if author calculation is OK. It is.
Regarding your second question.
1 cube of water 1 m3 = 1000 kg = 1 t (tonne)
This is only approximative definition just to make quick calculations. Density of the water changes if it is warmed cooled or transformed into ice.
= the mass of 1 cubic kilometer of fresh water
= the mass of 1.091 cubic km of ice
This is right. This is why I wrote the second comment. I forgot that ice was changed to water. This is why ice floats.
Nevertheless,
in the original article units are clear.
Ice loss is:
−134 ± 27, −3 ± 36, and −23 ± 18 Gt yr−1
It is logical that in scientific article tone is used because mass of the water is constant and volume of it changes with temperature.
Uhhhh, AlGoreEffect, my friend — what the hell did you just say?
Oh, well, vive la difference, I guess. (In case the joke has simply gone over my head, let me just express my embarrassment in advance.)
“the Antarctic losses detected by CryoSat-2 are enough to raise global sea levels by 0.45 millimetres each year alone.”
We’re all going to drown! In… some tens of thousands of years!
I do realise that over the Antarctic land mass albedo from surface snow is anomalously higher than that from cloud, since the snow presents such a pure white surface. However this is probably not the case for sea ice whose surface is more irregular and cracked with patches of dark sea in between.
The trouble is that water vapor is literally a two-edged sword. As vapor, it is the strongest greenhouse gas in the atmosphere by (IIRC) around an order of magnitude, so increasing water vapor can and does measurably increase the GHE — a lot, when considering dry air versus saturated air. In arid deserts, temperatures skyrocket during the day and plummet at night because of the absence of a water vapor driven GHE — CO_2 alone isn’t nearly enough to keep upward facing surfaces from rapidly losing their heat due to radiation. In very humid tropical climates, the nights are consistently warm because of the GHE.
However, water vapor is also the mediating agent for two major cooling mechanisms. One is the bulk transport of latent heat — sunlight and LWIR hit the sea surface and cause rapid evaporation of surface molecules of water. Wind blows over the ocean surface, stripping off water molecules as it goes. This evaporated water has a huge heat content relative to liquid water — the latent heat of vaporization. As the warm water vapor is carried aloft by convection, it carries the heat along with it. It also cools as it rides the adiabatic lapse rate upward, and further cools by radiating its heat content away (some of which returns to the Earth as GHE back radiation). Eventually the partial pressure of water vapor in the moist air becomes saturated relative to the temperature and the dew point is reached, making it comparatively probable that the water vapor will recondense into water. In order to do so, though, several things have to be “just right”. The water vapor has to be able to lose the latent heat of vaporization that it picked up at the water surface when it evaporated. The future water droplets have to be able to nucleate — which is a lot more likely to occur when there are ionic aerosols in the atmosphere as water (a polar molecule) is attracted to bare charge of either sign.
Once a water droplet is nucleated and grows past a critical size (that depends weakly on humidity and temperature) its surface becomes large enough that growth due to increased surface deposition outweighs loss due to surface evaporation, and the droplet stabilizes as a single droplet of condensation in a cloud or continues to grow to fall as rain. Either way the water, now high in the troposphere and hence through most of the optically opaque greenhouse layer, releases heat that is “short circuited” through the greenhouse mechanism and lost to space via radiation.
The cloud, as you note, has a very high albedo. High albedo means that it strongly reflects short-wave (e.g. visible) radiation without ever absorbing it and being heated by it. During the day, clouds outside of the polar regions act as a cooling agent, reflecting sunlight before it has a chance to reach the ground and lower troposphere to warm either one. During the day and the night, however, the cloud also acts as a powerful greenhouse blanket, directly reflecting LWIR as well as visible back down towards the Earth’s surface. In the tropics, daytime reflection wins by a landslide — reducing the incident sunlight by a huge fraction for a large fraction of the day beats the comparatively small modulation of surface radiative losses both day and night. In the temperate zone (again, IIRC) albedo still wins, but by a smaller and smaller margin as one creeps north (and in ways that are increasingly dependent on seasonal weather patterns — in the winter clouds can easily be net warming where in the summer they can be net cooling).
However — and this is key and the reason I’m replying to you — in the polar regions clouds are generally net warming, at least most of the year. You’ve already indicated some of the reasons — the polar regions are already often or permanently ice covered, and the gain in daytime albedo from clouds vs ice is not so great. The real problem, however, is that nighttime warming from the enhanced GHE from clouds scales with the fraction of the day that it is nighttime, and of course inside the arctic circles that can be as long as 100% of it. High albedo doesn’t cool when there is no incident sunlight to reflect, and even in the arctic summer, the sun comes in at a substantial angle so that direct solar warming is weak (so that clouds can reflect only a proportionally smaller amount of heat). A lot of polar temperature is determined by heat transport, not direct heating, explaining the substantial difference in mean temperatures of the North and South poles. In the north, there is substantial heat transport and heat exchange via the ocean; in central Antarctica there is only the atmosphere to carry heat in from the warmer latitudes and it just can’t do the job half as well.
That’s why I hesitated to assign a sign to the net feedback from any sort of local modulation of e.g. ocean-air humidity or sea ice coverage. The processes are COMPLEX and can have either sign, and they are NON-LOCAL as adding humidity in one place can increase albedo someplace else thousands of miles away is it finally concentrates enough to form clouds. A large part of the rain that falls over North Carolina comes up from the Gulf of Mexico maybe 1000 miles away. Some of it comes all the way over from the Pacific, where some of that might have originated in e.g. the growing El Nino. Heat from the tropical Pacific can be transported all the way to NC before it finally releases its heat and falls as rain, before it finally creates clouds that cause NC to cool after helping to greenhouse warm much of the surface area it crossed in between.
This is the kind of thing that the models are supposedly trying to model, but they perforce replace all of the small-length scale detail of this description with presumptive averages over cells 100-300 km square (where weather phenomena such as thunderstorms are order of 1 to 10 km square, where the details of front structure and development are much finer than this). They are excruciatingly tuned to aerosol levels and albedo — they have to be to stabilize anywhere near the correct/observed temperatures and preserve the central tenet that CO_2 causes X amount of baseline warming that is on average augmented by additional water vapor.
This last assumption is finally dying a quiet and well deserved death. AFAIK, it is due to Hansen, who in his original papers predicting disaster assumed universally positive water vapor feedback (and for no particularly scientifically motivated reason that I can see, hypothesized truly absurd levels of water vapor feedback that doubled or tripled the CO_2-only warming of his then very simple models). Naturally, some of the GCMs out there have built into them parametric assumptions that preserve this much “climate sensitivity” — total ACO_2 warming plus feedback, usually at the expense of an overdriven response to e.g. volcanic aerosols necessary to explain periods of global cooling and to keep the model from having a runaway exponential instability (because one has to have a mechanism that keeps positive feedback water vapor from causing increase of water vapor without bound just from FLUCTUATIONS in water vapor content or global temperature — the climate cannot be a biased random walk where every time the temperature goes up a bit, average water vapor increases and hence resets the Earth’s average temperature a bit higher unless a competing process can completely erase the gain when the temperature fluctuates down a bit).
At the moment, estimates of climate sensitivity are struggling to retain any net positive feedback from water vapor in the face of data that already solidly excludes the kind of absurd feedback levels Hansen originally hypothesized. Even the question of net negative feedback from water vapor, long considered to be anathema in climate science (except for a few mavericks who managed to publish papers suggesting that clouds could easily lead to net negative feedback through the dual mechanism of latent heat transport and modulation of albedo) is no longer completely off of the table. I don’t know that people will start to take it too seriously unless/until the Earth actually cools (several tenths of a degree, sustained, not just vary up or down or weakly downward trend) but obviously if this happened it would truly be the only likely catastrophe associated with global warming to all of those that have invested their professional careers, hundreds of billions of dollars of global wealth, and their political and/or scientific reputation on shaky claims in poor agreement (so far) with observational data.
IF there is a super-ENSO, perhaps it will help their arguments survive a bit longer, or perhaps it will truly kick up the temperature to where the models become believable again. Perhaps not. ENSO is not the only factor in climate evolution, and while it has been dominant for the last half century or so in mediating positive jumps as documented by Bob Tisdale, its ability to do so could easily be predicated by the phases and states of the other decadal oscillations, the state of the Sun, the state of baseline vulcanism, the immediate past climate history, and the price of tea in China. A chaotic nonlinear system can be quasiperiodic and apparently causal for a while and then for no computable reason change to an entirely different mode of behavior where a significant quasiparticle/process becomes insignificant and some other process becomes the critical driver. We could still watch as the developing ENSO discharges all that heat in such a way that it never manages to raise global average temperatures by much because of some confounding wave that causes the heat to be efficiently transported up and quickly lost rather than persisting to spread out over the globe at high altitude, or by a mere modulation of the winds that causes albedo over the warm(ing) patch to be higher than expected so that the delivery of solar energy to the ocean is effectively interrupted. It’s not like we can properly predict ENSO (although we can do pretty well with forward projective hindsight once an ENSO process has started).
No matter what, I expect the next year to be highly informative. If we have a super El Nino that heats the planet by 0.3C very rapidly, that certainly makes GCMs more, not less, plausible on average as it kicks global average temperatures at least in the right direction for them not to be as egregiously wrong as they currently appear to be. If it only kicks the temperature up by 0 to 0.1 C, and that only transiently so that temperature in a year are again pretty much flat relative to 1998-2000, it is very bad news for the models. If it fizzles altogether — short-circuited, perhaps, by the downhill side of solar cycle 24 that maybe be beginning and which will proceed with poorly predictable speed and which may or may not have a competitive local effect on the climate and produces no gain at all and cycles immediately into a cooling La Nina that augments any solar cycle cooling to actually drop global average temperatures, that too will be very informative.
Personally, I won’t even place a bet. I don’t think the climate is computable, which means that I think one is basically betting on the output of a (possibly biased) random number generator. I’d rather play Mumbledy-peg for money.
rgb
Thanks rgbatduke, that is a great summation. Haven’t come across a ‘Mumbledy-peg reference in years. learned that and many other useful pastimes in that great reference volume ‘How to Do Nothing with Nobody All Alone by Yourself’. A fount of early ‘engineering’ projects.
TheAlGoreEffect says:
May 20, 2014 at 8:02 pm
So much so wrong, but so little time & space.
“We have never had this many people on the planet before except before Noah. There are scientists that believe there was an *ice field* around our planet during Noah’s time that acted as a lens making a lot of the earth have the same average temps of 74F.”
At the time of the mythical Noah, some 4500 years ago, there might have been 20 million people on earth. Please name these imaginary “scientists” who believe there was an ice field around our planet then. Thanks.
“Silver Falls State Park in Oregon has minerals and rocks that can only be found under the ocean despite being at an elevation of 1500 feet in the foothills of the Cascades surrounded by tall Evergreens which I believe was when the world wide flood happened.”
The base sandstone of Silver Creek Falls canyon was indeed formed under an Oligocene ocean, ie c. 26 million years ago, when western Oregon was covered by seawater. But the land was lifted up by tectonics & sea level fell further during the Miocene, followed about 15 million years ago, by the Columbia flood basalt flows. This volcanic rock covered the former seabed sandstone, which being softer eroded over time.
“There has been tropical plants found deep under Artic ice which shows at one time tropical flora grew at that latitude.”
Temperate & even tropical species have indeed lived at high latitudes in the past. This has nothing to do with biblical myths. Earth’s climate is constantly changing & for most of the past 600 million years has been practically free of large glaciers or ice sheets. During Hothouse intervals, the planet is not icy even at the poles. But during Icehouse phases, as now & for the past 35 million years, especially the last three million, it has featured not just glaciers but ice sheets. We are in an interglacial, so the ice sheets are less extensive now than during the longer-lasting glacial cycles, when not just Antarctica & Greenland feature ice sheets, but much of continental North America, Europe & Asia, plus more extensive glaciers on South America, Africa & Australia, with even lower sea level.
“If we continue to fight for resources instead of sharing and exploring for more we will wipe ourselves from existence by destroying the atmosphere. In fact I believe that is what happened to the Mars ancient civilization which is why there appears to be hidden structures but NASA refuses to talk about it when questioned.”
There is no evidence whatsoever for an ancient Martian civilization. Evidence of even the simplest life forms there at any time is currently tenuous at best.
TheAlGoreEffect says:
May 20, 2014 at 8:02 pm
I want some of what he smokes!
An alternate view: while we hear considerably about isostatic rebound, there is also isotatic adjustment to loading. The Antarctic has been seeing steady increases in sea-ice for several years. If those were matched by increasing accumulations on the in the interior ice sheets, how rapidly would isostatic adjustment to increasing ice load result in lowering altitudes? Also, even without considering isostatic changes in the underlying rock, what effects would increasing load have on the crystalline structure of ice itself. I do know that increasing ice flow is likely to be due to loading because ice melting is correlated to retreats. Since the ice around Antarctica is advancing, if we accept increasing sea ice, then alternate hypotheses might be in order, to explain the altimeter data.