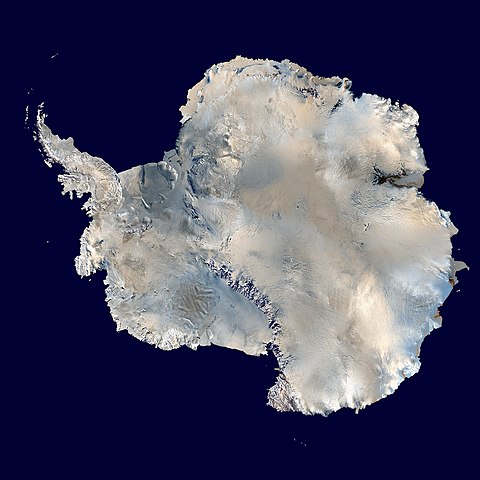
![480px-Antarctica_6400px_from_Blue_Marble[1]](http://wattsupwiththat.files.wordpress.com/2014/05/480px-antarctica_6400px_from_blue_marble1.jpg?quality=83) From Geophysical Research Letters and the University of Leeds:
From Geophysical Research Letters and the University of Leeds:
Three years of observations show that the Antarctic ice sheet is now losing 159 billion tonnes of ice each year — twice as much as when it was last surveyed. See below for some sanity check calculations on why 159 billion tonnes really isn’t much more than a flyspeck in the scheme of things.
===========================================
Antarctica’s ice losses on the rise
Three years of observations show that the Antarctic ice sheet is now losing 159 billion tonnes of ice each year – twice as much as when it was last surveyed.
A team of scientists from the UK Centre for Polar Observation and Modelling, led by researchers at the University of Leeds, have produced the first complete assessment of Antarctic ice sheet elevation change.
They used measurements collected by the European Space Agency’s CryoSat-2 satellite mission, which carries an altimeter specially designed for this task.
In sharp contrast to past altimeter missions, CryoSat-2 surveys virtually all the Antarctic continent, reaching to within 215 kilometres of the South Pole and leading to a fivefold increase in the sampling of coastal regions where today’s ice losses are concentrated.
Overall, the pattern of imbalance continues to be dominated by glaciers thinning in the Amundsen Sea sector of West Antarctica.
However, thanks to the improved capabilities of CryoSat-2, problem areas such as the rugged terrain of the Antarctic Peninsula can now also be surveyed.
On average West Antarctica lost 134 gigatonnes of ice, East Antarctica three gigatonnes, and the Antarctic Peninsula 23 gigatonnes in each year between 2010 and 2013 – a total loss of 159 gigatonnes each year.
The polar ice sheets are a major contributor to global sea level rise and, when combined, the Antarctic losses detected by CryoSat-2 are enough to raise global sea levels by 0.45 millimetres each year alone.
In West Antarctica, ice thinning has been detected in areas that were poorly surveyed by past satellite altimeter missions.
These newly-mapped areas contribute additional losses that bring altimeter observations closer to estimates based on other approaches.
But the average rate of ice thinning in West Antarctica has also increased, and this sector is now losing almost one third (31%) as much ice each year than it did during the five year period (2005-2010) prior to CryoSat-2’s launch.
Lead author Dr Malcolm McMillan from the University of Leeds said: “We find that ice losses continue to be most pronounced along the fast-flowing ice streams of the Amundsen Sea sector, with thinning rates of between 4 and 8 metres per year near to the grounding lines of the Pine Island, Thwaites and Smith Glaciers.”
This sector of Antarctica has long been identified as the most vulnerable to changes in climate and, according to recent assessments, its glaciers may have passed a point of irreversible retreat.
Launched in 2010, CryoSat carries a radar altimeter that can ‘see’ through clouds and in the dark, providing continuous measurements over areas like Antarctica that are prone to bad weather and long periods of darkness.
The radar can measure the surface height variation of ice in fine detail, allowing scientists to record changes in its volume with unprecedented accuracy.
Professor Andrew Shepherd, also of the University of Leeds, who led the study, said: “Thanks to its novel instrument design and to its near-polar orbit, CryoSat allows us to survey coastal and high-latitude regions of Antarctica that were beyond the capability of past altimeter missions, and it seems that these regions are crucial for determining the overall imbalance.”
“Although we are fortunate to now have, in CryoSat-2, a routine capability to monitor the polar ice sheets, the increased thinning we have detected in West Antarctica is a worrying development. It adds concrete evidence that dramatic changes are underway in this part of our planet, which has enough ice to raise global sea levels by more than a metre. The challenge is to use this evidence to test and improve the predictive skill of climate models.”
Professor David Vaughan of the British Antarctic Survey said: “The increasing contribution of Antarctica to sea-level rise is a global issue, and we need to use every technique available to understand where and how much ice is being lost. Through some very clever technical improvements, McMillan and his colleagues have produced the best maps of Antarctic ice-loss we have ever had. Prediction of the rate of future global sea-level rise must be begin with a thorough understanding of current changes in the ice sheets – this study puts us exactly where we need to be.”
Dr Ian Joughin at the University of Washington, author of a recent study simulating future Antarctic ice sheet losses added: “This study does a nice job of revealing the strong thinning along the Amundsen Coast, which is consistent with theory and models indicating this region is in the early stages of collapse.”
The findings from a team of UK researchers at the NERC Centre for Polar Observation and Modelling, are published in the journal Geophysical Research Letters. Professor Vaughan and Dr Joughin were not involved in the study.
Sanity Check:
From Climatesanity: Conversion factors for ice and water mass and volume
If one cubic kilometer of water (i.e., one gigatonne of water) is spread evenly over the entire 361 million square kilomters, the thickness of the new layer of water will be given by:
1 km³ / 361 x 106 km² = 2.78 x 10⁻⁶ meters = 2.78 microns.
Or, in terms of gigatonnes:
1 Gt x (1 km³/Gt) / 361 x 106 km² = 2.78 x 10⁻⁶ meters = 2.78 microns / Gt
That is, one cubic kilometer of water (i.e., one gigatonne of water) will add less than 3 millionths of a meter to the oceans!
From the press release, we are seeing about 159 billion tons/year of ice converted to meltwater (unless it sublimates), so the effect on sea level would be 159/1000 or 0.159 159 x 3 millionths of a meter, or 477 millionths of meter of sea level rise per year from this. (or in other words 0.47 mm which works out to 47mm/century or ~1.85 inches/century)
For another perspective, a gigatonne of water is approximately one cubic kilometer. Frozen as ice, it would be expanded slightly, but for the purposes of perspective lets just say that is negligible. So, the ice loss per year would be 0.159 cubic kilometers.
According to the British Antarctic Survey BEDMAP2 project:
The derived statistics for Bedmap2 show that the volume of ice contained in the Antarctic ice sheet [is] 27 million km3…
Source: http://www.antarctica.ac.uk/bas_research/our_research/az/bedmap2/index.php
And thanks to those helpful kidz at “Skeptical Science”, we have this graphic depicting a cubic kilometer of ice. John Cook writes in 2010:
A visual depiction of how much ice Greenland is losing
One gigatonne is one billion tonnes. To get a picture of how large this is, imagine a block of ice one kilometre high by one kilometer wide by one kilometre deep (okay, the edges are actually 1055 metres long as ice is slightly less dense than water but you get the idea). Borrowing from alien invasion movies, the scale is well illustrated by comparing a gigatonne block of ice to a famous, historical landmark like the Empire State Building:
![empire_state1[1]](http://wattsupwiththat.files.wordpress.com/2014/05/empire_state11.jpg?quality=83)
OK there are 14 million square kilometers of ice surface in Antarctica, not counting sea-ice. See if you can spot the tops of the 159 of these square kilometer ice blocks from this satellite view
Now imagine just 0.159 159 of those 1 cubic kilometer ice blocks missing each year. Scary, huh? Damian Carrington at the Guardian thinks so:

And so, the loss of 0.159 159 cubic kilometers of ice per year is apparently headline worthy, because at that rate of loss, it would take 169,811 years to lose all the 27 million cubic kilometers of Antarctic ice.
I’m pretty sure we’ll have gone through a few ice ages by then.
(Update: I made an error in the initial post with units, where I conflated kiloton/gigaton in one step, fixed)
1 Gt = one giga tonne = 1 000 000 000 t
1 km3 = 1000m * 1000m * 1000m = 1 000 000 000 m3
1 Gt = 1 km3 of ice
Author units in this WUWT article are OK.
PS
He even calculated difference in densities of water and ice. GOOD JOB
It is not “melting” it is moving!
Ice in large volumes is incapable of holding up its own weight and so “slumps” or spreads out under its own weight (at least at temperatures found on Planet Earth). This manifests itself in Greenland and Antarctica as glaciers moving downhill from the high interior to sea level at the fringes. This happens at sub-zero temperatures and does not require any “melting” of the interior ice.
Where the melting occurs is at the end of the “ice tongue” which extends from where the glacier hits the sea. Usually this results in “calving” of icebergs off the end of the glacier but sometimes whole sections of an ice tongue or larger area of land-fast floating ice to break off and drift away.
What matters is the balance of ice loss at the coasts vs ice gain from snow precipitation in the interior. This paper suggests they are out of balance, but I – like most here – am sceptical. With error bars like those shown in this paper and the lack of any clear comparison between the earlier data and this, it is next to impossible to judge. The only way we will find out is when they get the next 3 – 5 years of data of Cryosat-2.
What is the betting that we will see a “sudden and surprising reversal” of the ice losses from the glaciers in Antarctica just like we recently did for many of the glaciers in Greenland recently. As others here have said, if we really are suddenly getting 0.5mm more of sea level rise from Antarctica than we did in 2005 -2010 why is it not showing up in the figures already?
OK. Really dumb question. Ice loss here , ice loss there, … All very scary oooooo ahh… BUT. What is going on with Ice Gains? I figure glaciers recede with a good melting , and, glaciers advance (then calve) with a good freeze and abundant upstream snowfalls. Land ice. THEN there is what happens with sea ice. With sea ice reaching norms at the Arctic and sea ice extending into the ocean at record extents currently….SO what is going on, net ice loss? Ice Gain….?? Or , heaven forbid… stubborn equilibrium?
Record extents Antarctic…forgot a word
I like the assumption in that scaremongering that the loss is permanent.
That is, the ice which has fallen into the sea is not at all replaced. No,
never. Once in the ocean, that’s where it stays. It leaves the reader with
the image of an ever more naked, bare-rock, ice-free Antarctic. Oh woe!
Oh tragedy! The poor penguins! No more ice ramps to slide down! No
more ice shelves to provide escape from predators.
And the Antarctic peninsular, we are told, is losing ice even faster. Was
there any mention of those active volcanoes, discovered under the ice
cap earlier this year? Could they be contributing to this increased loss?
No mention is made of the year on year increasing sea-ice coverage, so I
won’t mention it either.
“The polar ice sheets are a major contributor to global sea level rise and, when combined, the Antarctic losses detected by CryoSat-2 are enough to raise global sea levels by 0.45 millimetres each year alone.”
This reminds me of a battle between the G’Gugvuntts and Vl’hurgs from the book “The Hitchhiker’s Guide to the Galaxy”
Two species which existed in the distant past, a very great distance from the Milky Way galaxy. The G’Gugvuntt were enemies of the Vl’hurgs, and these strange and warlike beings are on the brink of an interstellar war, because of an insult uttered by the G’Gugvuntt leader to the mother of the Vl’hurg leader. Resplendent in their black-jeweled battle shorts, they were meeting for the last time, and a dreadful silence filled the air as the Vl’hurg leader was challenging the G’Gugvuntt leader to retract the insult. At the precise moment, the phrase “I seem to be having tremendous difficulty with my lifestyle” (muttered by Arthur Dent to himself, which for some strange reason was carried by a freak wormhole in space back in time to the farthest regions of the universe where the G’Gugvuntts and the Vl’hurgs lived) filled the air over the conference table, which in the Vl’hurg tongue was the most dreadful insult imaginable. It left them no choice but to declare war on the G’Gugvuntts, which went on for a few thousand years and decimated their entire galaxy.
After millennia of battle the surviving G’Gugvuntt and Vl’hurg realised what had actually happened, and joined forces to attack the Milky Way in retaliation. They crossed vast reaches of space in a journey lasting thousands of years before reaching their target where they attacked the first planet they encountered, Earth. Due to a terrible miscalculation of scale the entire battle fleet was swallowed by a small dog.
Oh, good. i was just about to panic, but now I don’t need to bother. Win!
Good summary! (Though repetition is not always useful, you comments deserve the “recycling” of the added letters…)
A few corrections though:
1. The ice mass that it at the “end ” of the glacier tongue is what is left over AFTER many hundred years of movement FROM the very top of the glacier. That ice that WAS deposited many hundred years ago (time WILL vary based on each INDIVIDUAL glacier’s width, flowing ice length, flowing ice average and net speed over the ENTIRE time it has been moving, source region area.
Thus, what is melting now – assuming that what is now melting at the tip is not equal to what is being deposited at the head! – reflects a difference in precipitation between 2110 and ???? whenever it fell as snow and ice in the mountains (1650, 1700, 1800, 1810, 1820, 1830, … 1910, 1950, or 1970 ?)
2. Each “flowing” glacier will be moving, BUT not all of the “drainage basin” that the glacier is coming from is moving. Much of the drainage basin is bypassed by the flowing stream. and has only static ice. That ice will only start moving AFTER all of the flowing ice has gone past and is no longer able to “hold back” the solid ice on both sides of the entire ice mass.
Area and volume calculations of “how much is melting (tonnes per day or anything else)” vs “how much is being deposited” MUST ONLY be compared to the “area” and “precipitation per year per area” of what is falling on moving ice. What falls on static ice is NOT affecting sea level rise because that ice does not move to the sea. (It does sublimate into the air, but that value only affects total relative humidity and total ice thickness.
3. Much, much propaganda is made of the “grounding line” that is the location underwater of the flowing glacier into shallower water away from the coast itself. Conventional theory holds that this grounding line is the point where the glacier runs into dirt and rock far offshore underwater, which slows the otherwise-fast-flowing water-borne glacier coming from deeper water closer to shore, which builds up the glacier ice deeper in shallow water, and so allows deeper ice to build up on the sloping bedrock on-shore, which then allows deeper larger glaciers to be formed onshore.
If the ice at the bottom of the grounding line melts, this theory holds that the key “stuck ice” is unlocked, the flowing ice immediately moves to a new grounding line further offshore, or to the old grounding line, and which then cause all of the glacier ice on the land part of the bedrock to slide downhill and subsequently move to the ocean and subsequently melt.
4. Very little of the WAIS is on the Alpine glacier model of mountain source, downhill glacier, ice shelf above water, ice shelf held back at grounding line by offshore shallow water, and deep water between grounding line and mountainous source. (Only the Twaites Glacier and Pine Island Glacier actually fit the “generic description” everyone is assuming is correct for the entire icecap! )
steve mcdonald says:
May 20, 2014 at 10:29 am
“Does anyone know what’s happening with the earth’s tilt at the moment.”
Current obliquity is approx 23.5 degrees and reducing. The range is 21.5 degrees to 24.5 degrees with a periodicity of 41,000 years. It takes approx 6833 years to change 1 degree so in 4819 BCE Earth was at max obliquity. In 15680 CE Earth will be at min obliquity.
Keep in mind that current precession has Southern Hemisphere summer solstice at perihelion
————————————————————————————————————————-
From the text:
“this sector is now losing almost one third (31%) as much ice each year than it did during the five year period (2005-2010) prior to CryoSat-2′s launch.”
Now how do they know that?
Are they sure that the ice loss was about the same but they just couldn’t measure it accurately enough?
Because they say this:
“The radar can measure the surface height variation of ice in fine detail, allowing scientists to record changes in its volume with unprecedented accuracy.”
and this:
“Professor Andrew Shepherd, also of the University of Leeds, who led the study, said: “Thanks to its novel instrument design and to its near-polar orbit, CryoSat allows us to survey coastal and high-latitude regions of Antarctica that were beyond the capability of past altimeter missions.”
In spite of the average ‘ice loss’ in both poles the autumn and winter refreeze in both involves vast areas turning to ice. The Antarctica gains 13 million km2 each year which in recent years has increased on occasions to 14 million km2. Meanwhile the Arctic refreeze has increased from 8 million km2 to about 11 million km2 with 2013 showing a massive refreeze of nearly 12 million km2. As we are dealing with precision that is 14,000,000,000,000,000,000 mm2
Stephen Skinner says:
May 20, 2014 at 1:22 pm
….. nearly 12 million km2. As we are dealing with precision that is 14,000,000,000,000,000,000 mm2
And I’m not! I meant 12,000,000,000,000,000,000mm2,
@ur momisugly Robert H. says:
May 20, 2014 at 3:55 am
You ask the most important question: Is the 159GT’s a net loss or a dynamic loss?
It is not clear how much ice accumulating per annum while the 159Gt is allegeldy melting.
” …its glaciers may have passed a point of irreversible retreat.”
Really ? So how did it build up high enough to get higher than the point of no return in the first place then ?
Even the most optimistic pundits reckon the next glaciation will be with us in about 15,000 years, most pundits think it will be with us much sooner than that or that indeed, we have been slowly sliding into it for the last 2,000 years with a just a few short thousand years before we have to abandon parts of the Northern hemisphere.
So unfortunately for the warmists the Antarctic is melting about a hundred times too slowly.
The climate alarmists are quite happy to induce panicky headlines in the Guardian and other gullible media because then they can keep those multi million dollar research grants coming in.
The ice is melting! The ice is melting! Saunter for your lives, the ice is melting!
What is the problem?
GRL is sounding like this very minor fluctuation has meaning. It doesn’t.
This is just more wild eyed arm waving by people with an agenda to sell. Chicken Little [Chicken Licken – UK] ran around in circles, clucking that the sky was falling. But it was only an acorn.
Same-same.
Is this net loss?
meanwhile, sea levels have not risen since mid 2012
Some other observations.
Plus this
Plus near record Antarctic sea ice. More to follow.
Here is the IPCC.
Yet today we have some sort of confidence in “attributing the causes of the observed loss of mass from the Antarctic ice sheet over the past two decades. {4.3, 10.5}” GIGO. They don’t know what the hell is causing their observations. Or they do but will not tell the IPCC in time for AR5. This is BS.
Is there any CREDIBLE EVIDENCE for an acceleration in the rate of global mean sea level rise. I have seen many abstracts. Some say yes, some say no, some say a deceleration!!! What is going on? If the Climastrologists are right then there should be clear evidence of an acceleration. [Melting glaciers, thermal expansion, Antarctic terminal meltdown, Greenland grasslands now.]’
After all the hot and recent global warming the results are in. We are doomed to accelerdeceleration.
Where is the credible evidence for an acceleration of the rate of sea level rise? You can’t scream ‘MELT’ for 2 decades and cannot show me the evidence.
You have to slice each of the 159 blocks into 88,000 slices, in order for them to cover all 14000000 square kilometers of Antarctica. Thus each slice would be 11cm thick. They have detected an annual shrinkage of 11cm I guess.
Does Antarctic sea Ice increase when it gets colder? Surely not. When it get cold it’s actually warm and when it gets warm it’s warm. Get it?
Don K – Understood.