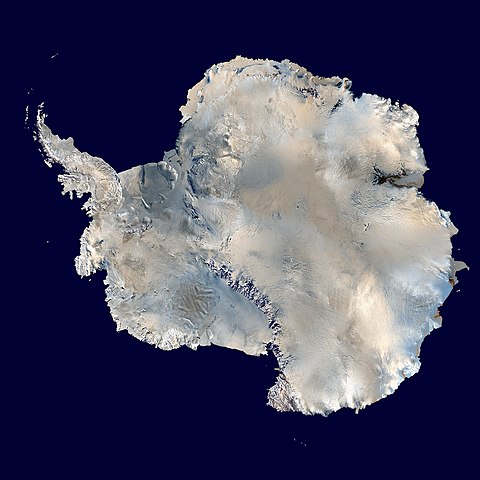
![480px-Antarctica_6400px_from_Blue_Marble[1]](http://wattsupwiththat.files.wordpress.com/2014/05/480px-antarctica_6400px_from_blue_marble1.jpg?quality=83) From Geophysical Research Letters and the University of Leeds:
From Geophysical Research Letters and the University of Leeds:
Three years of observations show that the Antarctic ice sheet is now losing 159 billion tonnes of ice each year — twice as much as when it was last surveyed. See below for some sanity check calculations on why 159 billion tonnes really isn’t much more than a flyspeck in the scheme of things.
===========================================
Antarctica’s ice losses on the rise
Three years of observations show that the Antarctic ice sheet is now losing 159 billion tonnes of ice each year – twice as much as when it was last surveyed.
A team of scientists from the UK Centre for Polar Observation and Modelling, led by researchers at the University of Leeds, have produced the first complete assessment of Antarctic ice sheet elevation change.
They used measurements collected by the European Space Agency’s CryoSat-2 satellite mission, which carries an altimeter specially designed for this task.
In sharp contrast to past altimeter missions, CryoSat-2 surveys virtually all the Antarctic continent, reaching to within 215 kilometres of the South Pole and leading to a fivefold increase in the sampling of coastal regions where today’s ice losses are concentrated.
Overall, the pattern of imbalance continues to be dominated by glaciers thinning in the Amundsen Sea sector of West Antarctica.
However, thanks to the improved capabilities of CryoSat-2, problem areas such as the rugged terrain of the Antarctic Peninsula can now also be surveyed.
On average West Antarctica lost 134 gigatonnes of ice, East Antarctica three gigatonnes, and the Antarctic Peninsula 23 gigatonnes in each year between 2010 and 2013 – a total loss of 159 gigatonnes each year.
The polar ice sheets are a major contributor to global sea level rise and, when combined, the Antarctic losses detected by CryoSat-2 are enough to raise global sea levels by 0.45 millimetres each year alone.
In West Antarctica, ice thinning has been detected in areas that were poorly surveyed by past satellite altimeter missions.
These newly-mapped areas contribute additional losses that bring altimeter observations closer to estimates based on other approaches.
But the average rate of ice thinning in West Antarctica has also increased, and this sector is now losing almost one third (31%) as much ice each year than it did during the five year period (2005-2010) prior to CryoSat-2’s launch.
Lead author Dr Malcolm McMillan from the University of Leeds said: “We find that ice losses continue to be most pronounced along the fast-flowing ice streams of the Amundsen Sea sector, with thinning rates of between 4 and 8 metres per year near to the grounding lines of the Pine Island, Thwaites and Smith Glaciers.”
This sector of Antarctica has long been identified as the most vulnerable to changes in climate and, according to recent assessments, its glaciers may have passed a point of irreversible retreat.
Launched in 2010, CryoSat carries a radar altimeter that can ‘see’ through clouds and in the dark, providing continuous measurements over areas like Antarctica that are prone to bad weather and long periods of darkness.
The radar can measure the surface height variation of ice in fine detail, allowing scientists to record changes in its volume with unprecedented accuracy.
Professor Andrew Shepherd, also of the University of Leeds, who led the study, said: “Thanks to its novel instrument design and to its near-polar orbit, CryoSat allows us to survey coastal and high-latitude regions of Antarctica that were beyond the capability of past altimeter missions, and it seems that these regions are crucial for determining the overall imbalance.”
“Although we are fortunate to now have, in CryoSat-2, a routine capability to monitor the polar ice sheets, the increased thinning we have detected in West Antarctica is a worrying development. It adds concrete evidence that dramatic changes are underway in this part of our planet, which has enough ice to raise global sea levels by more than a metre. The challenge is to use this evidence to test and improve the predictive skill of climate models.”
Professor David Vaughan of the British Antarctic Survey said: “The increasing contribution of Antarctica to sea-level rise is a global issue, and we need to use every technique available to understand where and how much ice is being lost. Through some very clever technical improvements, McMillan and his colleagues have produced the best maps of Antarctic ice-loss we have ever had. Prediction of the rate of future global sea-level rise must be begin with a thorough understanding of current changes in the ice sheets – this study puts us exactly where we need to be.”
Dr Ian Joughin at the University of Washington, author of a recent study simulating future Antarctic ice sheet losses added: “This study does a nice job of revealing the strong thinning along the Amundsen Coast, which is consistent with theory and models indicating this region is in the early stages of collapse.”
The findings from a team of UK researchers at the NERC Centre for Polar Observation and Modelling, are published in the journal Geophysical Research Letters. Professor Vaughan and Dr Joughin were not involved in the study.
Sanity Check:
From Climatesanity: Conversion factors for ice and water mass and volume
If one cubic kilometer of water (i.e., one gigatonne of water) is spread evenly over the entire 361 million square kilomters, the thickness of the new layer of water will be given by:
1 km³ / 361 x 106 km² = 2.78 x 10⁻⁶ meters = 2.78 microns.
Or, in terms of gigatonnes:
1 Gt x (1 km³/Gt) / 361 x 106 km² = 2.78 x 10⁻⁶ meters = 2.78 microns / Gt
That is, one cubic kilometer of water (i.e., one gigatonne of water) will add less than 3 millionths of a meter to the oceans!
From the press release, we are seeing about 159 billion tons/year of ice converted to meltwater (unless it sublimates), so the effect on sea level would be 159/1000 or 0.159 159 x 3 millionths of a meter, or 477 millionths of meter of sea level rise per year from this. (or in other words 0.47 mm which works out to 47mm/century or ~1.85 inches/century)
For another perspective, a gigatonne of water is approximately one cubic kilometer. Frozen as ice, it would be expanded slightly, but for the purposes of perspective lets just say that is negligible. So, the ice loss per year would be 0.159 cubic kilometers.
According to the British Antarctic Survey BEDMAP2 project:
The derived statistics for Bedmap2 show that the volume of ice contained in the Antarctic ice sheet [is] 27 million km3…
Source: http://www.antarctica.ac.uk/bas_research/our_research/az/bedmap2/index.php
And thanks to those helpful kidz at “Skeptical Science”, we have this graphic depicting a cubic kilometer of ice. John Cook writes in 2010:
A visual depiction of how much ice Greenland is losing
One gigatonne is one billion tonnes. To get a picture of how large this is, imagine a block of ice one kilometre high by one kilometer wide by one kilometre deep (okay, the edges are actually 1055 metres long as ice is slightly less dense than water but you get the idea). Borrowing from alien invasion movies, the scale is well illustrated by comparing a gigatonne block of ice to a famous, historical landmark like the Empire State Building:
![empire_state1[1]](http://wattsupwiththat.files.wordpress.com/2014/05/empire_state11.jpg?quality=83)
OK there are 14 million square kilometers of ice surface in Antarctica, not counting sea-ice. See if you can spot the tops of the 159 of these square kilometer ice blocks from this satellite view
Now imagine just 0.159 159 of those 1 cubic kilometer ice blocks missing each year. Scary, huh? Damian Carrington at the Guardian thinks so:

And so, the loss of 0.159 159 cubic kilometers of ice per year is apparently headline worthy, because at that rate of loss, it would take 169,811 years to lose all the 27 million cubic kilometers of Antarctic ice.
I’m pretty sure we’ll have gone through a few ice ages by then.
(Update: I made an error in the initial post with units, where I conflated kiloton/gigaton in one step, fixed)
Not accounting for sublimation effects makes any conclusions about sea level rise a bit pointless. A dryer antarctic climate in recent years would produce the same effect without any effect on sea level rise. Without some method of tracking precipitation changes along with the altitude data and combined with sublimation rates, this paper is leaving a lot of independent variables out.
Of course the double check on all this is the rate of sea level rise, which the raw data seems to show is slowing down, not accelerating.
“Three years of observations show that the Antarctic ice sheet is now losing 159 billion tonnes of ice each year – twice as much as when it was last surveyed” Is it possible to draw any strong conclusions about future trends based on 3 years of data? Also, the article says the satellite was launched in 2010. If there were no good measurements before then, do we know if the 159 billions tons per year represents a slowdown or speedup of ice loss?
Once the math is sorted to everyone’s satisfaction, might I ask that somebody take note of what Greg said earlier – these numbers are too big to have any meaning for the average man in the street (me). So for example, it might make more sense if the simplified math was along the lines of . . man worth £2.7 million is losing (say) £1.59 or £159 per year. Or perhaps, imagine a block of ice the size of a standard 6ft tall fridge freezer – then say it’s lost the equivalent of a couple of ice cubes. Would do it myself but as you can tell, I’d likely get it wrong!
Is this wrong? http://sealevel.info/conversion_factors.html
Thanks to satellites and computers we can now accurately measure the number of tress in the forest, in the past we had to use our fingers and observation. Has there less tress in the former than the latter this proves we are running out of trees.
Anyone spot the problem with that idea , while you cannot take a very accurate measurement from now and compare it with very inaccurate measurement form the past and claim it shows a trend . For you no idea at all what the numbers in the past would have been if you had the accurate measurement has opposed to the inaccurate one.
and that is before you get to if the reducation is actual meaningful.
Antarctica is a large body of water, albeit frozen. I would expect it to behave as any body of water does, which is to go through times when levels rise and times when levels fall. Is there a lake or pond in the world that is always at the same level?
Considering Antarctica is seemingly colder, it would likely be experiencing a period of drought. Ice continues to drain off via glaciers, just as a lake may continue to lose water through an outlet during a drought. Just as the level of the lake falls, the level of the ice falls.
The punchline of the report, however, is that the “rate of loss” is increasing. Please note the report does not say the glaciers are flowing faster. The glaciers may in fact be flowing slower, just as the outlet of a lake may flow slower in a drought, even as the level of the lake falls dramatically.
“Rate of loss” is a valuable tool to have, when you are measuring a city’s water supply during a drought, and need to know when to start being concerned about the water running short. However even while using the tool, one knows that a rainstorm could turn a “rate of loss” into a “rate of gain” in a matter of hours.
In terms of Antarctica, our weather records are scant and our history of what constitutes a “drought” and what constitutes a “wet period” are minimal. We do know the land is basically a desert, and the flow is strongly zonal, with very little of the loopy, meridianal flow seen up at the North Pole. I personally can recollect only one time that the Antarctic “polar vortex” split, however the simple fact it did split once suggests there could be times when snows increase. It would seem only logical that during such times the “rate of loss” would become a “rate of gain.”
The problem with some Alarmist thinking is that it takes the ups and downs of a cycle, and makes straight lines out of pieces of it.
However I do think it is very cool that we can now measure the amount of ice and the “rate of loss.”
It is a trivial rate of rise because it is a trivial increase in volume. http://apod.nasa.gov/apod/ap120515.html
The article is completely wrong. Antarctic ice is at record levels and there has been no global warming for 17 years, thus the antarctic can not be melting as the arctic is melting thus the antarctic ice must increase to balance it and account for the zero warming sum. Antarctic ice is not subject to the same oceanic oscillatory warm water intrusions that the arctic is exposed to. The system is complex and my simple ‘sum’ analysis is vastly insufficient but observation shows the Antarctic ice is at record levels.
Ice loss in one area of the Antarctic is counterbalanced by gain in another area, the warmists constantly cherry pick.
Not to nitpick, but two edits still need to be made:
1) Now that the figure for total Antarctic land-ice loss is 169,811 years instead of ~169 million years, the statement “I’m pretty sure we’ll have gone through a few ice ages by then.” should be changed. Perhaps to something like “I’m pretty sure we’ll have gone through an ice age by then.” ?
2) The strike-through in the statement “So, the ice loss per year would be 0.159 cubic kilometers.” includes all the digits. Strike only the zero & decimal point instead, leaving ‘159’.
Bill Illis says:
May 20, 2014 at 6:38 am
With reference to your link; funny how all that ice loss occurs along that chain of volcanos. I wonder if anyone has measured the heat flux through the crust in that area?
“If a chunk of ice the size of Manhattan breaks off of a glacier, the worldwide media wrings its collective hands. But if sea-ice coverage grows by the size of seven states plus 184 Manhattans, you hear nary a word”
Robert Felix.
Neither the press release nor the authors would like to discuss the +/- 2.6 cm radial error and the -58.6 cm bias.
http://www.dgfi.badw.de/index.php?id=379
In addition to other errors from surface roughness and slopes and those pesky discontinuities called crevasse and doppler positioning system DORIS and pointing errors and the Ku-band radar itself.
https://directory.eoportal.org/web/eoportal/satellite-missions/c-missions/cryosat
Oh well.
The US version of billions, trillions, etc replaced th old UK eqivalents decades ago, and they are now the same wherever they are referred to wordwide.
So when Pfizer bids £63 billion for Astrazeneca, the AZ board is not under the mistaken impression that they have been offered £63 trillion.
And everyone BLITHELY assumes the calibrations on the satellite are correct? No flaws, no errors? quality assurance anyone????
159 billion tons of ice. Is this not the amount that surrounded Chris Turney’s expedition last year. How ironic.
Oh, SIGINT EX…just noticed what you said, probably RIGHT ON THE MONEY here! Thanks for some important contribution.
Does anyone know what’s happening with the earth’s tilt at the moment.
For God’s Sake you Americans and English. It is high time you adopted SI measurements. They are based on universal constants, you know. Ill wait for the author to check what kind of unit is used.
An additional sanity check. A 1mm rise in sea level will create approximately a 4mm inland shift of the ocean, producing an increase in oceanic surface area of an order of magnitude when it comes to evaporation and redeposition of that moisture as snow.
The 159 Gt loss figure is the NET loss, the difference between the annual gain and the annual loss, both of which are around 2000 Gt/year. As gain and loss are totally different processes (snowfall vs melting) its hardly surprising that the relatively small difference fluctuates a lot.
It is typical of alarmists to take any trend, assume the underlying process is linear, extrapolate over a time, and then be shocked, shocked by their extreme predictions.
In fact climate changes (yes I am part of the 97% that thinks climate changes), and is most certainly not only non-linear, but at least partly chaotic, and also rife with complex feedbacks, both positive and negative.
As mentioned above, a drought over the continent could as easily explain the short term findings this study has made as could increased melt/sublimation related to warming (and what warming did they document, btw?).
Unless i have misunderstood things this paper’s first important conclusion is this:
‘WE HAVE ONLY BEEN ABLE TO MEASURE ICE MELT IN ANTARCTICA ACCURATELY FOR THE PAST 5 YEARS. BEFORE THAT, OUR SATELLITES WERE LIMITED IN WHAT THEY COULD DO IN THIS REGARD’.
So the first fundamental conculsion is simple: scientists do not yet have a baseline of continuous measurement to define what normal melt rates are over a significant period of time. They do not know whether current melt rates are average, normal, unprecedented, or rather less than at several times in the past.
To conclude from this that dangerous melting is taking place is rather analagous to saying that your toddler has doubled the rate at which they are learning new words, therefore they will get into Harvard aged 18.
I’m sure the Professors of Climate Science in Boston would agree that such logic is somewhat defective.
Perhaps they would also agree that collection of this satellite data until at least 2035 and quite possibly until 2100 may be necessary before useful understanding of long-term oscillations in antarctic ice melt/generation is possible?
SIGINT EX says:
May 20, 2014 at 10:01 am
Neither the press release nor the authors would like to discuss the +/- 2.6 cm radial error and the -58.6 cm bias.
http://www.dgfi.badw.de/index.php?id=379
“The Cryosat-2 data for the three different measurement modes (LRM, SAR, and SARin) are combined within one GDR product which is globally available. Nevertheless, up to now, there are still some known problems with the SAR and the SARin data part in the Level 2 product and actually, only L2 LRM data should be used. The global mean range bias of this data set has been computed to -0.586 m. A timing error of about 11 ms is still present in the data. With 2.6 cm RMS of the radial errors the data quality of Cryosat-2 is very promising but not yet comparable to Jason and Envisat missions.”
The Antarctic Ice Sheet is roughly 14,000,000 km2 in area. In order to detect 159km3 of ice loss, by my reckoning, you would need to be able to distinguish 159km3/14Mkm2 = .000011m or 11microns.
Once again we have a bunch of clever dicks given lovely pieces of high priced government sponsored technology to play with and descending into metrological delusions of grandeur.
It doesn’t take any high degree of technical knowledge to demonstrate to impossibility of these accuracy claims. We are dealing here with measurements of height. To measure a height, once or over time, you need a fixed reference frame, but over any time span of the last 40 yrs there is nothing in the entire system of the Earth, including especially all those lovely orbiting devices, whose positional (x,y,z) has been fixed and known for any time segment of that era.
For all of these number crunchers this stuff is their live’s work. They go in every day and diligently try to make chicken soup out of chicken shit. I think they should be forgiven for pretending to themselves that what they have accomplished is in fact meaningful, but the rest of us are under no obligation to support them in their delusions.
Here is link to original article.
http://onlinelibrary.wiley.com/doi/10.1002/2014GL060111/abstract
It can be clearly seen that unit used is Gt yr−1 and in SI system that is obligated to use in scientific literature 1 G or Giga means 1 000 000 000.
List of SI prefixes
http://en.wikipedia.org/wiki/Metric_prefix#List_of_SI_prefixes
Robert Brown says:
May 20, 2014 at 5:00 am
…
In the meantime, antarctic sea ice is at record levels of coverage, which actively increases the albedo of the southern pole and provides a form of negative feedback. I have no idea what (if any) effect it has on southern hemisphere cloudiness and hence further feedback both positive and negative.
I would have thought that increasing Antarctic sea ice leading to increased albedo would be a positive, not negative feedback, since increased albedo causes cooling, which would be expected to lead to more sea ice, etc. Note RACooke’s frequent posts on the subject of Antarctic albedo (more significant than Arctic due to lower latitude of sea ice thus more reflection).
I do realise that over the Antarctic land mass albedo from surface snow is anomalously higher than that from cloud, since the snow presents such a pure white surface. However this is probably not the case for sea ice whose surface is more irregular and cracked with patches of dark sea in between.