![480px-Antarctica_6400px_from_Blue_Marble[1]](http://wattsupwiththat.files.wordpress.com/2014/05/480px-antarctica_6400px_from_blue_marble1.jpg?quality=83) From Geophysical Research Letters and the University of Leeds:
From Geophysical Research Letters and the University of Leeds:
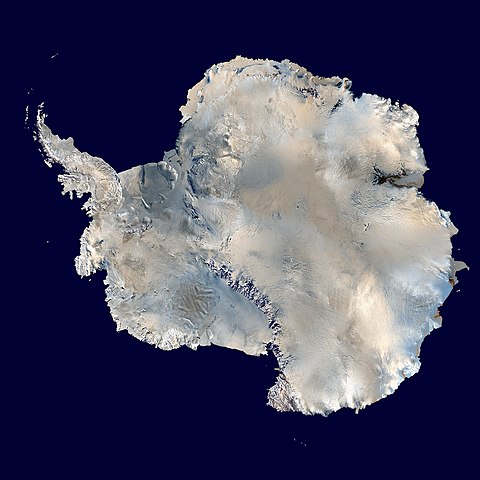
Three years of observations show that the Antarctic ice sheet is now losing 159 billion tonnes of ice each year — twice as much as when it was last surveyed. See below for some sanity check calculations on why 159 billion tonnes really isn’t much more than a flyspeck in the scheme of things.
===========================================
Antarctica’s ice losses on the rise
Three years of observations show that the Antarctic ice sheet is now losing 159 billion tonnes of ice each year – twice as much as when it was last surveyed.
A team of scientists from the UK Centre for Polar Observation and Modelling, led by researchers at the University of Leeds, have produced the first complete assessment of Antarctic ice sheet elevation change.
They used measurements collected by the European Space Agency’s CryoSat-2 satellite mission, which carries an altimeter specially designed for this task.
In sharp contrast to past altimeter missions, CryoSat-2 surveys virtually all the Antarctic continent, reaching to within 215 kilometres of the South Pole and leading to a fivefold increase in the sampling of coastal regions where today’s ice losses are concentrated.
Overall, the pattern of imbalance continues to be dominated by glaciers thinning in the Amundsen Sea sector of West Antarctica.
However, thanks to the improved capabilities of CryoSat-2, problem areas such as the rugged terrain of the Antarctic Peninsula can now also be surveyed.
On average West Antarctica lost 134 gigatonnes of ice, East Antarctica three gigatonnes, and the Antarctic Peninsula 23 gigatonnes in each year between 2010 and 2013 – a total loss of 159 gigatonnes each year.
The polar ice sheets are a major contributor to global sea level rise and, when combined, the Antarctic losses detected by CryoSat-2 are enough to raise global sea levels by 0.45 millimetres each year alone.
In West Antarctica, ice thinning has been detected in areas that were poorly surveyed by past satellite altimeter missions.
These newly-mapped areas contribute additional losses that bring altimeter observations closer to estimates based on other approaches.
But the average rate of ice thinning in West Antarctica has also increased, and this sector is now losing almost one third (31%) as much ice each year than it did during the five year period (2005-2010) prior to CryoSat-2’s launch.
Lead author Dr Malcolm McMillan from the University of Leeds said: “We find that ice losses continue to be most pronounced along the fast-flowing ice streams of the Amundsen Sea sector, with thinning rates of between 4 and 8 metres per year near to the grounding lines of the Pine Island, Thwaites and Smith Glaciers.”
This sector of Antarctica has long been identified as the most vulnerable to changes in climate and, according to recent assessments, its glaciers may have passed a point of irreversible retreat.
Launched in 2010, CryoSat carries a radar altimeter that can ‘see’ through clouds and in the dark, providing continuous measurements over areas like Antarctica that are prone to bad weather and long periods of darkness.
The radar can measure the surface height variation of ice in fine detail, allowing scientists to record changes in its volume with unprecedented accuracy.
Professor Andrew Shepherd, also of the University of Leeds, who led the study, said: “Thanks to its novel instrument design and to its near-polar orbit, CryoSat allows us to survey coastal and high-latitude regions of Antarctica that were beyond the capability of past altimeter missions, and it seems that these regions are crucial for determining the overall imbalance.”
“Although we are fortunate to now have, in CryoSat-2, a routine capability to monitor the polar ice sheets, the increased thinning we have detected in West Antarctica is a worrying development. It adds concrete evidence that dramatic changes are underway in this part of our planet, which has enough ice to raise global sea levels by more than a metre. The challenge is to use this evidence to test and improve the predictive skill of climate models.”
Professor David Vaughan of the British Antarctic Survey said: “The increasing contribution of Antarctica to sea-level rise is a global issue, and we need to use every technique available to understand where and how much ice is being lost. Through some very clever technical improvements, McMillan and his colleagues have produced the best maps of Antarctic ice-loss we have ever had. Prediction of the rate of future global sea-level rise must be begin with a thorough understanding of current changes in the ice sheets – this study puts us exactly where we need to be.”
Dr Ian Joughin at the University of Washington, author of a recent study simulating future Antarctic ice sheet losses added: “This study does a nice job of revealing the strong thinning along the Amundsen Coast, which is consistent with theory and models indicating this region is in the early stages of collapse.”
The findings from a team of UK researchers at the NERC Centre for Polar Observation and Modelling, are published in the journal Geophysical Research Letters. Professor Vaughan and Dr Joughin were not involved in the study.
Sanity Check:
From Climatesanity: Conversion factors for ice and water mass and volume
If one cubic kilometer of water (i.e., one gigatonne of water) is spread evenly over the entire 361 million square kilomters, the thickness of the new layer of water will be given by:
1 km³ / 361 x 106 km² = 2.78 x 10⁻⁶ meters = 2.78 microns.
Or, in terms of gigatonnes:
1 Gt x (1 km³/Gt) / 361 x 106 km² = 2.78 x 10⁻⁶ meters = 2.78 microns / Gt
That is, one cubic kilometer of water (i.e., one gigatonne of water) will add less than 3 millionths of a meter to the oceans!
From the press release, we are seeing about 159 billion tons/year of ice converted to meltwater (unless it sublimates), so the effect on sea level would be 159/1000 or 0.159 159 x 3 millionths of a meter, or 477 millionths of meter of sea level rise per year from this. (or in other words 0.47 mm which works out to 47mm/century or ~1.85 inches/century)
For another perspective, a gigatonne of water is approximately one cubic kilometer. Frozen as ice, it would be expanded slightly, but for the purposes of perspective lets just say that is negligible. So, the ice loss per year would be 0.159 cubic kilometers.
According to the British Antarctic Survey BEDMAP2 project:
The derived statistics for Bedmap2 show that the volume of ice contained in the Antarctic ice sheet [is] 27 million km3…
Source: http://www.antarctica.ac.uk/bas_research/our_research/az/bedmap2/index.php
And thanks to those helpful kidz at “Skeptical Science”, we have this graphic depicting a cubic kilometer of ice. John Cook writes in 2010:
A visual depiction of how much ice Greenland is losing
One gigatonne is one billion tonnes. To get a picture of how large this is, imagine a block of ice one kilometre high by one kilometer wide by one kilometre deep (okay, the edges are actually 1055 metres long as ice is slightly less dense than water but you get the idea). Borrowing from alien invasion movies, the scale is well illustrated by comparing a gigatonne block of ice to a famous, historical landmark like the Empire State Building:
![empire_state1[1]](http://wattsupwiththat.files.wordpress.com/2014/05/empire_state11.jpg?quality=83)
OK there are 14 million square kilometers of ice surface in Antarctica, not counting sea-ice. See if you can spot the tops of the 159 of these square kilometer ice blocks from this satellite view
Now imagine just 0.159 159 of those 1 cubic kilometer ice blocks missing each year. Scary, huh? Damian Carrington at the Guardian thinks so:

And so, the loss of 0.159 159 cubic kilometers of ice per year is apparently headline worthy, because at that rate of loss, it would take 169,811 years to lose all the 27 million cubic kilometers of Antarctic ice.
I’m pretty sure we’ll have gone through a few ice ages by then.
(Update: I made an error in the initial post with units, where I conflated kiloton/gigaton in one step, fixed)
The “US Billion” is not 10^12. That’s a Euro thing. And it clearly says gigatonne. It’s just a math error. 0.5mm/year. Not at all trivial. Still not scared.
If Antarctica really is losing that much ice, then someone is going to have to explain to me how that is posible when Antarctica is just flat out not warming at all. They just recorded the coldest temperature ever recorded on the surface of the planet in August of 2010 in Antarctica, which is when this survey started. So someone is going to have to tell me how during record cold, more ice can melt than ever before. Its not making sense. We’re constantly getting conflicting info.
160 Giga tonnes sounds like a lot, but not when you know that total accretion each year is around 1900 Gt (so total loss must have been around 2060 Gt). Since accretion and loss are totally different mechanisms i find it quite surprising that there is almost as much total gain as total loss.
http://www.waisworkshop.org/presentations/2011/Session4/Zwally.pdf
Its a standard trick of AGW propagandists to quote big scary numbers, and to fail to put them in a proper perspective.
“0.5mm/year. Not at all trivial.“. So what is trivial? Well, I reckon anything under, say, 1 foot per century is trivial. So how much is 0.5mm/year? It’s 2 inches per century.
Goldie says:
May 20, 2014 at 2:33 am
And they can measure that rate of loss – with no margin for error from satellite?
==================================================================
Good Question.
Answer: Maybe. The press release doesn’t really tell us what we’d need to know to answer that question — how much is the Antarctic ice surface level changing and how accurate, really, numerically, is the satellite? Cryosat-2 is purportedly able to measure changes to about 1.3cm. ( http://en.wikipedia.org/wiki/CryoSat-2 ) It’s not clear whether than includes errors due to uncertainty about satellite position which might be, based on the Topex/Poseiden satellites which also use DORIS for position determination most likely a couple of cm.
We’re told that 0.44mm of sea level rise are coming from Antarctic ice loss and that most of that is at the edges of the continent. According to wikipedia, the surface area of the seas is about 3.6×10^8 km^2 and of antarctica is 1.4×10^7 km^2. If we assume that the ice loss is from 10% of the continent’s area, the elevation change would be 0.44*3.6*10^8/(1.4*10^7)mm
= 0.44*2.6*10^2 mm = 114mm = 11.4cm/yr. So, yeah, given three years and if the force is with them, and assuming I haven’t lost a factor of 10 or 100 or made some other grevous error, it’s possible that they can measure the ice loss well enough to estimate ice loss with an error of 10-20% …. give or take.
“Sasha says:
May 20, 2014 at 3:52 am
Ocean volume is 1.37e9 cubic kilometers”
Can we use terms that (I do understand what you say) others might understand more readily? So ocean volume is (approx) ~1.37 BILLION CUBIC KILIOMETERS. 1.37e9 cubic kilometers means nothing to most people.
given most the population spend their school days taking selfies its easy to impress people with big sounding numbers and so make it scary.
MattN – I’m not saying they are right, but it is conceptually possible for an ultra-cold Antarctica to lose ice by transpiration with low precipitation not replacing it. Mt Kilimanjero has done this in the past.
“1.37 BILLION CUBIC KILIOMETERS. 1.37e9 cubic kilometers means nothing to most people.”
Neither does a “billion” apparently.
Patrick , perhaps you’d like that in Hiroshima bombs and Empire state buildings. Pop over to see Sturmbandfuehrer Cook.
Don K – you are out by a factor of 10 (10^8/10^7 is 10 not 10^2). So your final figure becomes 1.14cm/yr. But there is still the problem that 90% of the continent has been ignored in that calc, and a gain of just 1.2mm (less than measurable) over the rest of the continent wipes out the loss. So the final figure is statistically indistinguishable from zero.
“Greg Goodman says:
May 20, 2014 at 4:26 am”
No, not really. 1.37e9, of anything, means nothing to most people. That was my point.
Greg Goodman says:
May 20, 2014 at 4:26 am
…Empire state buildings.”
That was a B17 in fog…
[B25, not B17. Mod]
I don’t understand how ice loss can be increasing / “worse than we thought” while sea level rise fails to accelerate. Even before doing math, logic tells me that the increase must be false or negligible.
Fascinating that as summer fails to take hold in the Northern Hemisphere that the Warmist Alarmist machine turns to the vast, frozen and very remote continent of Antarctica as it’s major source of scare stories.
I’m beginning to think that we skeptics are the only people who take these pricks seriously any more.
Patrick says:
May 20, 2014 at 4:17 am
OK, Patrick. Sometimes I get a little carried away with myself and just assume everyone will know what these expressions mean. Anyway…let’s add some relevant facts…
Ocean volume is 1.37e9 – 1.37 billion – 1,370,000,000 – cubic kilometers
****
How many gigatonnes of land ice must melt to raise the oceans one millimeter (10-3 meters)?
1 mm / (2.78 microns / Gt) = 10-3 m / (2.78 x 10⁻⁶ m / Gt) = 360 Gt
[Similarly, 360 km³ of water will raise the oceans 1 mm.]
****
How many gigatonnes of land ice must melt to raise the oceans one inch?
1 inch = 25.4 mm = 2.54 x 10⁻² meters
1 inch x (2.54 x 10⁻² m / inch) / (2.78 x 10⁻⁶ m / Gt) = 9137 Gt
[Similarly, 9137 km³ of water will raise the oceans 1 inch.]
Mike Jonas says:
May 20, 2014 at 4:33 am
Don K – you are out by a factor of 10 (10^8/10^7 is 10 not 10^2). So your final figure becomes 1.14cm/yr. But there is still the problem that 90% of the continent has been ignored in that calc, and a gain of just 1.2mm (less than measurable) over the rest of the continent wipes out the loss. So the final figure is statistically indistinguishable from zero.
========
Mike, you’re correct that what I wrote is wrong, but that second 10^7 should be 10^6 (10% of 10^7), so I think the conclusion that the ice elevation change at the continent margins is really measurable is probably correct.
There are a whole bunch of factors not addressed. e.g. much of the ice around the edges of the continent is floating and thus doesn’t increase sea volume when it melts, and “recent” snow presumably compacts over a period of years (decades?) suggesting that elevation changes may not all be from ice melt. I’m not remotely qualified to address those issues. I was just curious whether the satellite could actually measure what it is claimed to have measured with any useful accuracy. Tentatively, I think it probably could.
yeah right………..
This is like claiming you can measure the worlds temperature in 1/100th of a degree…….
http://www.leeds.ac.uk/news/article/3531/antarcticas_ice_losses_on_the_rise
It would also be good have a link to the press release at the top , not just leeds.ac.uk , saves having to go digging.
This is more spin my press release. The caption on the headline photo reads :
“Three years of observations show that the Antarctic ice sheet is now losing 159 billion tonnes of ice each year – twice as much as when it was last surveyed. ”
Which gets reported by the Guardian as “Doubling of Antarctic ice loss revealed by European satellite”
NO , the GRL article actually reports: However, the average rate of ice thinning in West Antarctica has also continued to rise, and mass losses from this sector are now31% greater than over the period 2005–2011.
The also screw up the increased ice loss and report “losing almost one third (31%) as much ice “:
But the average rate of ice thinning in West Antarctica has also increased, and this sector is now losing almost one third (31%) as much ice each year than it did during the five year period (2005-2010) prior to CryoSat-2’s launch.
DUH.
Can I just be clear?
It is stated that twice as much ice is being lost than the last time it was surveyed.
But, the new survey is more detailed and therefore finding areas of loss not previously identified.
Therefore, is the doubling merely a result of better surveying techniques, or real?
Yes mods, could we just fix the top article? The line where he divides 159/1000 just needs to have the 159/1000 removed and that and all subsequent references to 0.159 converted to 159. It won’t do to publish egregious arithmetic errors on WUWT, especially when the error favors the skeptical argument. Especially where one doesn’t need the error to make the point.
Now, what is NOT known is how long this melt rate has been occurring — quite possibly it extends all the way back to the Dalton minimum, more likely it started somewhere in the 1930’s or 1940’s when temperatures peaked from the early 20th century (non-CO_2-linked) warming from 1910 to 1940, with some fluctuation over time. That is, we really do not know how much of the baseline SLR over the last 145 years of the tidal gauge record (useful or useless as it might be) is due to ice melt over that entire period vs the amount due to expansion. It is quite plausible that of the current 3 to 3.5 mm/year rise, 0.5 mm/year comes from melting ice — that’s the scale that would knock the rate back down much closer to the 145 year average. OTOH, some fraction of that 145 year average might have come from ice melt too. In ten or twenty years of observations, perhaps we’ll know.
In the meantime, antarctic sea ice is at record levels of coverage, which actively increases the albedo of the southern pole and provides a form of negative feedback. I have no idea what (if any) effect it has on southern hemisphere cloudiness and hence further feedback both positive and negative.
Finally, I do not think that this word “irreversible” means what you think it means…
rgb
If the readings are more accurate now by giving better resolution over area’s that were not previously accounted for, then are the previous records going to be adjusted much in the same way that happens to temperature records?….. Just sayin!
” Espen says: @ur momisugly May 20, 2014 at 1:20 am
One more thing conveniently omitted in the press release, but prominent in the abstract (http://onlinelibrary.wiley.com/doi/10.1002/2014GL060111/abstract): the error range for the east Antarctic ice loss of 3Gt/year is a whopping +/-36 Gt/year!”
Indeed, the errors are 50% of the estimated loss: ” Between 2010 and 2013, West Antarctica, East Antarctica, and the Antarctic Peninsula changed in mass by −134 ± 27, −3 ± 36, and −23 ± 18 Gt yr−1 “.
In any event, half of a very small number is still a very small number. Be it 159 KM**3 or .159.
Good to see the WUWT readers are on their toes from the very first response. Hopefully we will see a correction soon.
Robert Brown says:
May 20, 2014 at 5:00 am
“…In the meantime, antarctic sea ice is at record levels of coverage…”
__________________
Overnight May 14/15, reported global sea ice dropped (precipitously) somewhere between 3-4 KM2 and has exhibited a downward trend, since. NSIDC announced that beginning May 15, they had changed secondary access server for daily NISE.v4 data. No change to the actual data set was announced. Global sea ice extent before May15 had been running ~.9M Km2 daily, but is currently reported as less than .2M Km2. There have been no reported events, such as major ice- shelf break/calving events which might explain the sudden drop..
The article focuses on loss. Can anyone post the historic annual gains in new snow and ice?
In other words, is the thickness of the total ice in this area dropping, remaining the same or getting thicker? Should the continent be viewed as a “black box” problem where the input , output and the size of the box need to be evaluated to determine the impact of climate on the model? Or is the melt vs. gain the natural behavior of the system?
Thank you,