El Niños and La Niñas are parts of naturally occurring, sunlight-fueled processes—amazing processes—that produce warm water and redistribute it from the tropical Pacific. When I was first able to fathom the processes, when they finally clicked for me, I was in awe of Mother Nature’s handiwork. Cloud cover, sunlight, ocean heat content, sea surface temperatures, sea level, surface winds, ocean currents, etc., all interwoven, all interdependent, with the events occurring at massive scales. I’ve been sharing their complexity, magnitude and aftereffects ever since. Hopefully, this post will allow you to gain some insight–or spark your interest.
El Niño and La Niña events are extremely important parts of Earth’s climate. They are the dominant mode of natural climate variability on annual, multiyear and decadal timeframes. El Niño and La Niña events impact everything from drought and rainfall to surface temperatures around the globe. Consider this: El Niños and La Ninas occur in the tropical Pacific, but more than a decade ago it was determined that they rearranged sea ice in the Southern Ocean surrounding Antarctica. Recently, they were even linked to temperature of the water below the Antarctic sea ice, through changes in ocean wind patterns. See Dutrieux et al. (2014) Strong Sensitivity of Pine Island Ice-Shelf Melting to Climatic Variability and the corresponding ScienceDaily article here.
The following is Section 1 from my ebook Who Turned on the Heat? This presentation was created to fill the gap between overly scientific texts and the basic (but way too simple) descriptions of El Niño and La Niña processes that are available on the internet. As I noted above, hopefully, it will help you to understand those seemingly complex processes. Please ask questions.
Notes: I’ve struck through text from the book (strikethrough) where it refers to other sections of the book, and I deleted a short note that refers to a feature of Abobe readers (the book is in pdf format). This post contains 29 illustrations, so it may take a little while to load. If they don’t appear full-sized, just give them a click.
[START OF SECTION 1 OF WHO TURNED ON THE HEAT?]
1.1 Preliminary Discussion of the ENSO Annotated Illustrations
Most introductions to the El Niño-Southern Oscillation (ENSO) on the web include boiler-plate descriptions and three illustrations: one each for El Niño, La Niña and ENSO-neutral phases. The reader has to jockey back and forth, scrolling up and down, to read the text and compare it to the illustrations. Unfortunately, much of what’s discussed in the text of those ENSO introductions isn’t shown in the graphics. To overcome that, I’ve prepared a 29-cell series of annotated (cartoon-like) illustrations that first introduce readers to background information about the Pacific Ocean. There are also introductions to trade winds and ocean currents, both of which have important roles in ENSO. With multiple cartoon-like illustrations for each phase and the transitions between them, the reader is taken through a complete cycle of ENSO phases: ENSO neutral to El Niño, back to ENSO neutral, on to La Niña, and then back to ENSO neutral. At each phase, the interaction between sea surface temperatures across the tropical Pacific, trade winds, sea surface height, precipitation and subsurface ocean temperatures are illustrated and discussed. Also presented are the differences between El Niño and La Niña events and the reasons why global surface temperatures vary in response to ENSO events.
To reinforce and confirm what’s presented in this section, Section 3 includes more-detailed, data-reinforced descriptions and illustrations.
1.2 The ENSO Annotated Illustrations

# # # # #

# # # # #

# # # # #

# # # # #

# # # # #

# # # # #
# # # # #

# # # # #

# # # # #
# # # # #

# # # # #

# # # # #
Now’s a good time to take a quick break from the cartoon-like illustrations. We’ll go into more detail in Section 3 about the interrelated processes taking place before an El Niño, but it’s important now to reinforce what’s been discussed so far. I’ll reword the presentation a little with hope that it will help make things click for you.
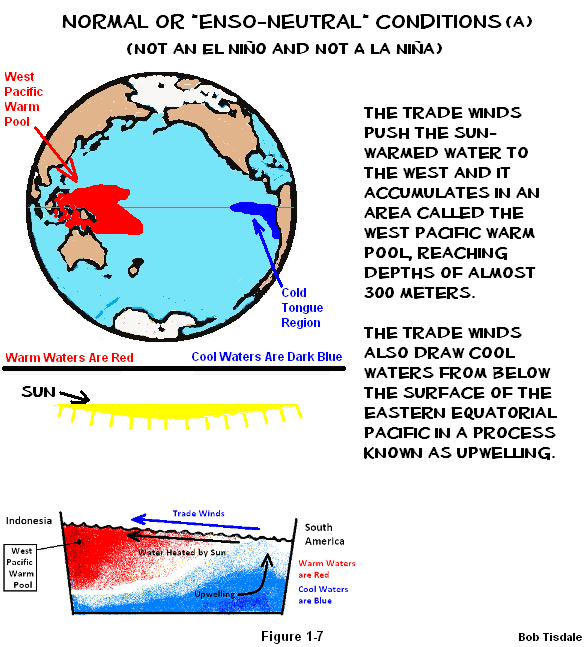
The trade winds are an important part of our discussion of ENSO-neutral, or “normal”, conditions in the tropical Pacific. They blow from east to west across the surface and cause the surface waters to also travel from east to west. That makes sense. If you blow on a liquid long and hard enough, the surface of the liquid will move it the direction you’re blowing.
The trade winds also blow clouds toward the west. That’s not hard to imagine, either. This allows that wonderfully strong tropical sun to beat down on the surface of the tropical Pacific and to reach into the subsurface waters to depths of 100 meters. Though most of that sunlight is absorbed nearer the surface, in the top 10 meters (roughly 33 feet) or so, it does reach farther. All of Mother Nature’s glorious sunlight warms the tropical Pacific waters as they travel west.
The trade winds push the waters up against the land masses of Indonesia and Australia. This causes the warm water to, in effect, pile up in the western tropical Pacific, in an area called the west Pacific Warm Pool. The trade winds driving the westward movement of surface waters also draw cool waters from below the surface of the eastern equatorial Pacific, in a process called upwelling. That upwelled water provides a continuous source of cool water at a relatively constant temperature that’s then warmed by the sun as it travels west. The water is, therefore, cooler in the eastern equatorial Pacific, in an area called the Cold Tongue Region, than it is in the west Pacific Warm Pool. Remember, the tropical Pacific stretches almost halfway around the globe, so that nice cool supply of water in the east travels a long way under the tropical sun before it reaches the warm pool in the west.
The trade winds cause the temperature difference between the east and west portions of the tropical Pacific. Now, here’s the interesting part. The temperature difference between the eastern and western tropical Pacific causes the trade winds to blow. That’s right. The temperature gradient of the tropical Pacific sea surface temperatures and the trade winds interact with one another in a positive feedback loop called Bjerknes feedback.
Why does that happen?
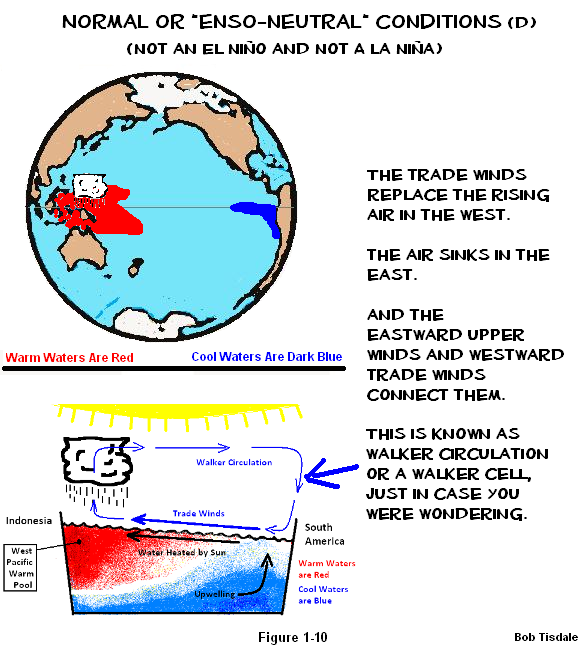
There nothing mysterious going on. The warmest water is in the western tropical Pacific. We’ve discussed that, and we’ll confirm it in Section 3. The warm water there heats the air above it, and that relatively hot air rises. All of that rising hot air has to be replaced by other air, and it’s the trade winds out of the east that supply the necessary make-up air. Because the tropical Pacific is cooler in the east, the air sinks there, and eastward-blowing upper winds complete the circuit. Overall, the warm air rises in the west; it cools as it’s carried east by the upper winds; then it sinks in the eastern tropical Pacific, where it heads back to the west as the trade winds. That circuit is called a Walker cell. The trade winds continuously push cool water from the east to the west, sunlight warms the water as it travels west, and when that warm water reaches the west Pacific Warm Pool, it supplies the heat necessary to maintain the updraft, which, in turn, causes to trade winds to blow. The briefest way to explain it: the trade winds and the sea surface temperatures are coupled, meaning they interact with one another.
With all of that warm water being piled up in the western tropical Pacific, and with all of the cool water being drawn from the eastern equatorial Pacific, the surface of the water—the sea level—in the west Pacific Warm Pool is about 0.5 meters (approximately 1.5 feet) higher in elevation than it is in Cold Tongue Region in the east.
Everything’s in tune, running in its normal state. The temperature difference between the east and west keeps the trade winds blowing—and—the trade winds maintain the temperature difference between east and west—and—the trade winds keep the warm water in the west Pacific Warm Pool at a higher elevation than it is in the eastern equatorial Pacific.
We can’t forget about gravity. It’s always there, our constant companion. Gravity would like the sea surface height in the west to equal the height in the east. It likes level playing fields. It’s working against the trade winds, and the trade winds are piling up the warm water against gravity. Still, everything is in relatively constant state of balance, with little gives and takes here and there.
Then some weather event—and that’s precisely what it is, a weather event or group of weather events—causes the trade winds to relax. That means the coupled ocean-atmosphere processes taking place in the tropical Pacific are no longer in balance. Sometimes, the weakened trade winds aren’t strong enough to hold the warm water in place in the west Pacific Warm Pool against gravity, so gravity takes over and all of that lovely warm water that was piled in the west Pacific Warm Pool suddenly sloshes to the east. That’s how an El Niño starts.
I’m now going discuss parts of the process that haven’t been shown in the illustrations yet.
The Pacific Ocean is awfully wide at the equator, so it takes a while, about 2 months, for the warm water to slosh to the east as far as the coast of South America.
Let’s put things into perspective. The west Pacific Warm Pool holds a massive amount of warm water. It varies in size. When it’s large, the west Pacific Warm Pool can cover a surface area of about 19 million square kilometers (7.3 million square miles) but it averages about 12 million square kilometers (4.6 million square miles). Numbers that large are hard to embrace, so, when the west Pacific Warm Pool is larger than normal, think of an area the size of Russia or a little less than twice the size of the United States. Refer to the Mehta and Mehta (2004) presentation Natural decadal-multidecadal variability of the Indo-Pacific Warm Pool and its impacts on global climate. Also imagine the warm water reaches depths of 300 meters (about 1000 feet). Sometimes, during a very strong El Niño, most of that water from the west Pacific Warm Pool will be transported east and much of it will spread across the surface of the central and eastern tropical Pacific. Now remember that the Pacific stretches almost halfway around the globe at the equator. An El Niño dwarfs all other weather-related events. How big are they? Sometimes it takes a pair of tropical cyclones just to trigger an El Niño. Yes, tropical cyclones as in hurricanes.
Let’s return to the ENSO-neutral phase for a second. A weather event—for example, a couple of tropical cyclones or a pair of them that straddle the equator—a weather event that’s teeny by comparison, has caused the Pacific trade winds to relax, which in turn has unleashed a monstrously large phenomenon that is capable of raising global temperatures 0.4 degrees C in less than a year. In turn, there are heat waves and cold spells. Floods will strike some parts of the globe. Drought conditions form in others. Snowfall will pile to record heights in some areas, and in others it will decrease. These effects were studied and documented decades ago, and they’re still being studied, for example, to account for differences between Central Pacific and the more powerful East Pacific El Niño events.
Of course, some publicity seeking climate scientists continue to (very unwisely) blame carbon dioxide for the heat waves and cold spells, flooding and drought, blizzards and low snowfall, creating further disbelief in climate science. They have only themselves to blame for their loss of credibility. I digress.
An El Niño is one of Mother Nature’s ways of reminding us who’s in charge.
Back to the cartoon-like illustrations.
# # # # #

# # # # #

# # # # #

# # # # #

# # # # #

# # # # #

# # # # #

# # # # #
# # # # #

# # # # #

# # # # #
# # # # #

# # # # #

# # # # #

# # # # #

# # # # #

# # # # #

# # # # #
1.3 Recap of Section 1
Trade winds cause the sea surface temperature and height in the western tropical Pacific to be greater than they are in the east. El Niño events are started by the weakening of the trade winds. The weaker trade winds can no longer hold the warm water in place in the west Pacific Warm Pool, and this allows gravity to carry the warm water east, raising sea surface temperatures in the central and eastern equatorial Pacific.
El Niño events are the abnormal phase of ENSO. The Equatorial Countercurrent strengthens and carries a large volume of warm water from west to east, and that increased volume from west to east opposes the normal east-to-west flow during ENSO-neutral and La Niña phases. The winds also change directions during an El Niño, with trade winds becoming westerlies in the western tropical Pacific. On the other hand, during ENSO-neutral and La Niña phases, the trade winds are blowing in their normal east-to-west direction.
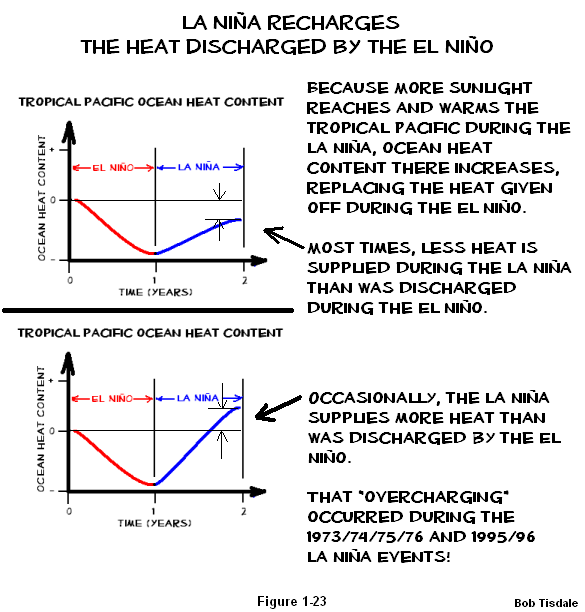
La Niña events are easy to describe. They are exaggerations on the ENSO neutral phase. However, La Niña events play the important role of replenishing the heat given off by the El Niño that precedes it, and sometimes a La Niña can create more warm water than was released by the El Niño.
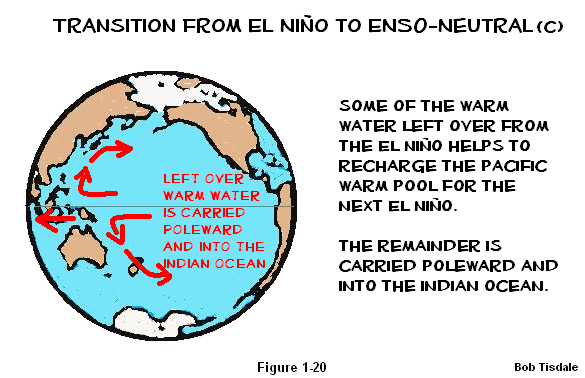
Warm water that has traveled east during the El Niño and that is not “exhausted” by the El Niño does not remain in the eastern tropical Pacific. It is returned to the West Pacific and Indian Oceans, where much of it remains on the surface. Before the El Niño, most of that warm water is below the surface of the west Pacific Warm Pool and excluded from the surface temperature record. Then, after the El Niño, part of what remains of that warm water is now on the surface of the West Pacific and East Indian Oceans. The opposite does not occur during the La Niña phase. The result: strong El Niño events can raise global sea surface temperatures for extended periods of time. This will be discussed in detail in Section 5.
[END OF SECTION 1 OF WHO TURNED ON THE HEAT?]
Again, if you have any questions, please ask.
Now that you’ve run through the processes, here’s a one sentence description of ENSO: ENSO acts as a chaotic, naturally occurring, sunlight-fueled, recharge-discharge oscillator, where the La Niña phase acts as the recharge phase and El Niño acts as the discharge phase.
As long as the climate science community continues to treat ENSO as noise, they will make little progress in understanding the natural contribution to global warming, and it’s a sizeable contribution. We’ve discussed for years that the climate science community has failed to account for the “leftovers”, the residual warm water, from strong El Niños.
I also used those cartoon-like illustrations in my two-part video series “The Natural Warming of the Global Oceans”, which first aired on the WUWT-TV special in September 2012. That series is available on YouTube. Part 1 is here, and Part 2 is here.
I went into much more detail to explain ENSO processes and the aftereffects of El Niño and La Niña events in my ebook Who Turned on the Heat? I’ve lowered the price of Who Turned on the Heat? from U.S.$8.00 to U.S.$5.00…for a month or so, with hope of increasing sales a little bit. A free preview in pdf format is here. The preview includes the Table of Contents, the Introduction, the first half of section 1 (which was provided complete in this post), a discussion of the cover, and the Closing. Take a run through the Table of Contents. It is a very-detailed and well-illustrated book—using data from the real world, not models of a virtual world.
Who Turned on the Heat? is only available in pdf format…and will only be available in that format. Click here to purchase a copy. Thanks. Unless I can find funding for my research, it will be book sales and tips/donations that allow me to return to blogging full-time.
Clay Marley says: “You show (in the book and videos) the East Indian-Western Pacific SST anomalies increase during El Nino events, then slowly decrease between events. This is leading to a stair-step increase in SSTs from the 70′s to current. But this increase in SSTs can’t go on forever. How do the temperatures return to lower levels? Have El Nino events occurred less frequently in the past, giving the ocean SSTs time to drop?”
Thanks for using the East Indian-West Pacific data. That’s the first subset I used to describe the upward shifts or ratchet-like effect.
From the early 1940s to the late 1980s, East Indian-West Pacific sea surface temperature anomalies showed a slight long-term cooling. It definitely shows no long-term warming. During that period, there were few strong El Niños (other than the 1982/83 El Niño which was opposed by the eruption of El Chichon). Then they shifted upwards in response to the 1986/87/88 and 1997/98 El Niños:
http://bobtisdale.files.wordpress.com/2014/01/figure-8-22.png
Prior to that, there also appears to have been an upward shift in response to the 1939/40/41/42 El Niño:
http://bobtisdale.files.wordpress.com/2014/01/figure-8-23.png
Before then, the data is more like science fiction.
Will we go another couple of decades before another strong El Niño causes another upward shift in the East Indian-West Pacific sea surface temperature data? We’ll have to watch and see.
Regards
PS: Those two graphs are discussed in Chapter 8.12 of “Who Turned on the Heat?” And thanks for buying a copy.
Joe Evans: You’ve asked a great many questions that no one can answer. There are no datasets with sufficient resolution or accuracy to calculate many of the things you’ve asked. Recall the Trenberth “travesty” email. Trenberth’s follow-up email on October 14, 2009 read:
“Where did the heat go? We know there is a build up of ocean heat prior to El Nino, and a discharge (and sfc T warming) during late stages of El Nino, but is the observing system sufficient to track it?”
Obviously, it’s not sufficient.
john robertson says: “Bob, what is the time constant? Thinking of a RC circuit, your recharge discharge oscillator. After the warm pool sloshes east, how much is the western warm pool depleted in volume and temperature? How long does it take to recharge?”
You’re assuming there are “constants” in chaotic weather processes. Sea level and ocean heat content (vertical average temperature) data could probably be used to get a rough order of magnitude for the reductions in volume and temperature. See Trenberth quote in my reply to Joe Evans above.
How long for a recharge? Based in the NODC Ocean Heat Content data for the tropical Pacific, the warm water for the 1997/98 El Niño was created in about 1 year during the 1995/96 La Niña, but the 1998-01 La Niña only recharged part (most) of it in 3 years.
http://bobtisdale.files.wordpress.com/2013/03/22-trop-pac-ohc-1995-96-la-nina-and-1997-98-el-nino.png
Thank you Bob for comments and references
Please don’t go Bob, you are a valuable asset.
The article clarified things for me greatly and now I have bought the book. Thanks man.
Bob!
Great Post
Have you looked at the strengths of the North and South Pacific gyros which are both driven by the Coriolis Effect and compared them with the variations of currents at the ENSO region?
In other words have you for example compared the southern equatorial current with the strength of the Humboldt Current and Northern equatorial current with the current outside California?
As you may know I’m looking into ENSO using an Artificial Neural Network.
I have been working recently to improve the ANN so that I can make better presentation and more reliable forecast for ENSO, LOD, NINO3.4 and SOI indexes.
My data show that the most important drivers of ENSO are changes in the strength of the Pacific gyros which are driven by a combination of changes in tidal forcing, solar driven changes in the magnetic field and changes in the solar wind.
In other words ENSO is driven by tidal forcing with a considerable influence from the Sun.
BTW My calculations point to La Niña condition next winter (Northern Hemisphere) which should further frustrate the AGW crowd.
Per Strandberg (@LittleIceAge), I’m looking forward to seeing what you come up with. ENSO as an modified aftereffect of solar variations always sounded plausible to me.
Regards
Bob
Thanks for this ENSO article with especially helpful images.
In some literature the step up in OHC associated with a strong el Nino and following La Nina is referred to as nonlinear dynamic heating (NDH) and it is associated with the observed asymmetry of ENSO, e.g. Al et al 2004:
http://lumahai.soest.hawaii.edu/MET/Faculty/jff/2004_02%20Nonlinearity%20and%20Asymmetry%20of%20ENSO.pdf
Here is an excerpt:
The strong warm events are accompanied by a strong warming tendency due to NDH. During the weak minor event, NDH is weaker (Fig. 3b). The cooling tendency due to NDH is much weaker than the warming tendency due to NDH (Fig. 3b) so the strong cold events are not expected. Consequently, this low-order nonlinear ENSO model suggests that the NDH concurs with the El Nin˜o (warm event) bursting, which also ultimately generates the strong El Nin˜o–La Nin˜a asymmetry.
…
The time evolutions of the SST tendency over the region of 58N–58S and 1708–1008W due to linear and nonlinear advective heating are shown in Fig. 6. For each time series, a 3-month running average has been applied. As shown in Fig. 6, the nonlinear heating is as strong as the linear advective heating throughout much of the ENSO episodes of 1982/83 and 1997/98. The amplitudes of these strong ENSO events were strongly skewed toward the warm event. On the contrary, during the modest and weak ENSO events such as 1986/87, the nonlinear advective heat was negligible and the warm and cold SST anomalies had similar amplitudes.
This suggests that the intensity and asymmetric behavior of strong ENSO events can be attributable to NDH.
Bob Tisdale says:
“Will we go another couple of decades before another strong El Niño causes another upward shift in the East Indian-West Pacific sea surface temperature data? We’ll have to watch and see.”
I think a warmist might say something like: “I agree the El Niño caused a step increase in SST but AGW prevents sufficient cooling between El Niño events to return the SST to the pre-El Niño values, resulting in a general upward trend in temperatures.”
The obvious response of course, is that AGW would require increasing SST in the Eastern Tropical Pacific, which we do not see.
But still, for this not to be caused by AGW, there must be some much longer cyclical pattern, probably a multi-century period, which keeps the SSTs within some normal range. IOW eventually one would expect the Indian Ocean/Western Pacific SST to return to pre-1918 levels. We just happen to be seeing a period of El Niños frequent enough and strong enough to result in an overall rising SST period. Is there any evidence of this kind of pattern? Do we have at least, El Niño dates that go back further? Or is data prior to ~1900 too sparse?
Bob:
As always, you provide an easy-to-understand, graphic description for the layman of the various phases of the highly irregular ENSO cycle. Unfortunately, it is also misleading in certain key aspects.
The kinematics of hydrostatic readjustment of water-level upon the cessation of wind-driven pile-up against coasts are physically well-established in the theory of seiching. There simply is no way that a half-meter pile-up in the West Pacific would result in “sloshing” water any appreciable distance across the ocean upon the slackening of trade-winds! Nor can Rossby waves (which transport mechanical energy far more than mass) account for the westward spreading of the “warm pool.”
Without getting into the dynamical intricacies of the Peru Coastal Current, what you miss entirely is the shallow, subsurface Cromwell Current, which flows west to east. Also neglected in your presentation is the reduction in evaporative surface cooling that accompanies the slckened trade-winds.
Correction: My comment on Rossby waves should read “account for the EASTWARD spreading…”
1sky1 says: “As always, you provide an easy-to-understand, graphic description for the layman of the various phases of the highly irregular ENSO cycle. Unfortunately, it is also misleading in certain key aspects.”
Based on the remainder of your comment, I believe you might be reading more into my simple presentation than is warranted. This was an introductory overview. Example: I never implied or suggested that Rossby waves “account for the eastward spreading of the ‘warm pool.'”
Regards
Bob,
Thanks for this post. I do appreciate the ‘picture book’ version as it truly makes much of this easier to understand. With the official exchange rate of a picture being worth a thousand words, that certainly reduces the required reading.
However, one thing just did not sit well with me, the proposition that the trade winds hold the warm pool up against the pull of gravity. Knowing that water expands with a rise in temperature (not counting extremes of the fluid range), I believe that alone is sufficient to explain the water level differential you indicated.
If I read elsewhere correctly, the volumetric expansion coefficient for water is 0.000214. That’s likely for fresh water, and seawater is probably different, but here goes anyway. A 300 meter water column at 21C would balance a 30C water column of 300.5778 meters. Exactly a half meter taller.
Although the total water column is in balance, east to west, the same can not be said of the warm/cold temperature/density boundary which is at the surface in the east and 300 meters deep in the west. I would posit that it is this thermocline’s ‘desire’ to level out in a westward direction which forces the overlying warm water to slosh back eastward when the trade winds drop off.
Your mileage may vary.
Found via Google:
http://www.engineeringtoolbox.com/volumetric-temperature-expansion-d_315.html
Thanks Bob for all your work in that article. Priceless.
“As long as the climate science community continues to treat ENSO as noise, they will make little progress in understanding the natural contribution to global warming, and it’s a sizeable contribution.”
I have several times asked a question, and gotten answers from both Judith Curry and commenters at Real Climate, that suggest that they do not see ENSO as merely noise, but that El Ninos do increase global average temperature, aka “contribute to global warming.”
The question was whether El Ninos, by releasing heat already in the oceans, cause a spurious rise in reported GAT (global average temperature), rather than actually increasing GAT, properly defined. All of the reported temp series show spikes in El Nino years. My question basically was, how did an El Nino add heat to the system, if it was simply moving heat around within it.
I understand how it contributes to an increase in reported surface temperatures. Your figure 1-25 explains it quite well. The release of heat from deeper ocean waters not included in GAT, increases the reported air surface and sea surface temperatures. But that still is a matter of just moving heat around within the climate system. It just shows that GAT is not really global.
Both Dr. Curry and the folks at Real Climate answered that El Ninos cause an increase in clouds, and that those clouds retained heat that would otherwise be released from the atmosphere by radiation. (I did not ask how they knew the net impact of the clouds would be positive, since incoming sunlight, would be reflected and thus not enter the system. I just wanted to know what their theory was for the mechanism by which El Ninos increased GAT.) So as I understand it, to them, the increases in reported temps were not noise, but were evidence of the increased heat in the system as a result of El Nino produced clouds.
My question for you is, what do you see as the mechanism for ENSO “contributing to global warming”? I think I understand your post here well enough, as it is written in a way that makes the concepts understandable to even a layman like myself. But I do not see how the system you described increases the energy or heat content of the global climate system.
I can see how an El Nino contributes to the release of heat, that might otherwise be retained in the deeper ocean; and how a La Nina could, for a time, cause more heat to be retained, until it is released by an El Nino. But how does the system as a whole operate as a “natural contribution to global warming”?
Bernard Felsche, you might find this of interest. It is the Indian Ocean Dipole linked to Enso.
http://www.bom.gov.au/climate/enso/history/ln-2010-12/IOD-what.shtml
Thanks Bob, excellent explanation. However, 19195/96 La Nina was pathetic. We moved from drought 13 inches per year to 15 inches in a 26 inch rainbelt.
Makes the IPCC’s bogeyman of the missing heat hiding in the deep ocean look more foolish than the dog ate my homework.
Why is not funding going strongly into this and related fields instead of the lunatic CO2 scares?
See Lockheed’s Skunkworks division has or is developing hot fusion.
These are worthwhile endeavors that advance mankind and the natural world, unlike funding conferences in Rio etc for gasbaggers.
GaryM says: “I can see how an El Nino contributes to the release of heat, that might otherwise be retained in the deeper ocean; and how a La Nina could, for a time, cause more heat to be retained, until it is released by an El Nino. But how does the system as a whole operate as a ‘natural contribution to global warming’?”
In addition to retain and release functions you’ve outlined, there is another function of ENSO. It also helps to redistribute heat from the tropical Pacific to adjacent ocean basins. During multidecadal periods when the strength, frequency and duration of El Niños exceed La Niñas, more heat than “normal” is released and redistributed from the tropical Pacific. Global surface temperatures have to warm during a period when El Niño events dominate. Maybe it’s easier to think of ENSO as an additional “source” of heat when it comes to surface temperatures. Conversely, when La Niñas are dominant, less heat than “normal” is released and redistributed from the tropical Pacific.
Also keep in mind that the recharge aspects of La Niñas vary widely per event. According to the ocean heat content data for the tropical Pacific, the warm water for the 1997/98 super El Niño was created by the 1995/96 La Niña, which lasted about a year and wasn’t especially strong in terms of the normal ENSO indices. Then after the 1997/98 El Niño, it took the 3-year 1998/99/00/01 La Niña to replace most of the warm water and it was a stronger event at times than the 1995/96 La Nina.
Additionally, during an El Niño, the warming of regions of the globe that are remote to the tropical Pacific is not caused by a direct exchange of heat. That warming is caused by changes in atmospheric circulation patterns–changes in trade wind strength and the jet streams. So during multidecadal periods when El Niño events dominate, the atmospheric circulation patterns would tend to be in “warm mode”, for lack of a better phrase, which would also contribute to long-term trends.
Jack says: “However, 19195/96 La Nina was pathetic.”
The 1995/96 La Nina wasn’t anything special in many respects, except that it created the warm water for the 1997/98 El Nino in a relatively short time period.
MikeW: There are a number of other explanations around the web that describe the trade winds “piling up” the warm water in the western tropical Pacific, including the NOAA FAQ webpage by Bill Kessler here:
http://faculty.washington.edu/kessler/occasionally-asked-questions.html
Bob, many thanks for an excellent tutorial on the El Nino/La Nina cycles . Is there any way of purchasing your book without going through PayPal ?
“fritz says:
January 10, 2014 at 11:21 am
@John L Kelly
Why does this happen every 10 years or so ; OK , the geothermal gradient assures the upward branch of the thermohaline circulation ; and possibly events like D-O events during glaciations ; but why would the oceanic crust release its heat with such a regular timing ?”
Who stated that it was regular? I certainly didn’t. My guess is that the same thing is going on with our planet, that causes the sun’s barycenter to dance around the exact center of the solar system: Gravity from other masses.
Bob Tisdale, responding to John Kelly, states the following: “There’s no problem, John. Everything I’ve presented is supported by data. You’ve presented speculation.”
John replies, “I feel honoured that you should include me in the ranks of such pioneers as Alfred Wegener(continental drift), and Eugene Shoemaker(lunar impact theory). Both were scoffed, but were proven correct over time. You just remember this when the science catches up on this issue, ok?
Anthony Keen says: “Is there any way of purchasing your book without going through PayPal ?”
Unfortunately, no. If you’re concerned that the PayPal webpage asks you open a PayPal account, simply scroll to where it advises you that you can purchase with a credit card, etc.
Regards
John Kelly says: “I feel honoured that you should include me in the ranks of such pioneers as Alfred Wegener(continental drift), and Eugene Shoemaker(lunar impact theory).”
I didn’t include you with them. You put yourself among Alfred Wegener and Eugene Shoemaker. Please don’t put words in my mouth.
John Kelly says: “Both were scoffed, but were proven correct over time.”
There was no scoffing or jeering or sneering or ridiculing on my part, John. I simply stated that everything I’ve presented in the post is supported by data and that you’ve presented speculation. Show me the data to support your speculation, John, so that you can prove your conjecture to be correct. That’s all. Simple.
Regards