El Niños and La Niñas are parts of naturally occurring, sunlight-fueled processes—amazing processes—that produce warm water and redistribute it from the tropical Pacific. When I was first able to fathom the processes, when they finally clicked for me, I was in awe of Mother Nature’s handiwork. Cloud cover, sunlight, ocean heat content, sea surface temperatures, sea level, surface winds, ocean currents, etc., all interwoven, all interdependent, with the events occurring at massive scales. I’ve been sharing their complexity, magnitude and aftereffects ever since. Hopefully, this post will allow you to gain some insight–or spark your interest.
El Niño and La Niña events are extremely important parts of Earth’s climate. They are the dominant mode of natural climate variability on annual, multiyear and decadal timeframes. El Niño and La Niña events impact everything from drought and rainfall to surface temperatures around the globe. Consider this: El Niños and La Ninas occur in the tropical Pacific, but more than a decade ago it was determined that they rearranged sea ice in the Southern Ocean surrounding Antarctica. Recently, they were even linked to temperature of the water below the Antarctic sea ice, through changes in ocean wind patterns. See Dutrieux et al. (2014) Strong Sensitivity of Pine Island Ice-Shelf Melting to Climatic Variability and the corresponding ScienceDaily article here.
The following is Section 1 from my ebook Who Turned on the Heat? This presentation was created to fill the gap between overly scientific texts and the basic (but way too simple) descriptions of El Niño and La Niña processes that are available on the internet. As I noted above, hopefully, it will help you to understand those seemingly complex processes. Please ask questions.
Notes: I’ve struck through text from the book (strikethrough) where it refers to other sections of the book, and I deleted a short note that refers to a feature of Abobe readers (the book is in pdf format). This post contains 29 illustrations, so it may take a little while to load. If they don’t appear full-sized, just give them a click.
[START OF SECTION 1 OF WHO TURNED ON THE HEAT?]
1.1 Preliminary Discussion of the ENSO Annotated Illustrations
Most introductions to the El Niño-Southern Oscillation (ENSO) on the web include boiler-plate descriptions and three illustrations: one each for El Niño, La Niña and ENSO-neutral phases. The reader has to jockey back and forth, scrolling up and down, to read the text and compare it to the illustrations. Unfortunately, much of what’s discussed in the text of those ENSO introductions isn’t shown in the graphics. To overcome that, I’ve prepared a 29-cell series of annotated (cartoon-like) illustrations that first introduce readers to background information about the Pacific Ocean. There are also introductions to trade winds and ocean currents, both of which have important roles in ENSO. With multiple cartoon-like illustrations for each phase and the transitions between them, the reader is taken through a complete cycle of ENSO phases: ENSO neutral to El Niño, back to ENSO neutral, on to La Niña, and then back to ENSO neutral. At each phase, the interaction between sea surface temperatures across the tropical Pacific, trade winds, sea surface height, precipitation and subsurface ocean temperatures are illustrated and discussed. Also presented are the differences between El Niño and La Niña events and the reasons why global surface temperatures vary in response to ENSO events.
To reinforce and confirm what’s presented in this section, Section 3 includes more-detailed, data-reinforced descriptions and illustrations.
1.2 The ENSO Annotated Illustrations

# # # # #

# # # # #

# # # # #

# # # # #

# # # # #

# # # # #
# # # # #

# # # # #

# # # # #
# # # # #

# # # # #

# # # # #
Now’s a good time to take a quick break from the cartoon-like illustrations. We’ll go into more detail in Section 3 about the interrelated processes taking place before an El Niño, but it’s important now to reinforce what’s been discussed so far. I’ll reword the presentation a little with hope that it will help make things click for you.
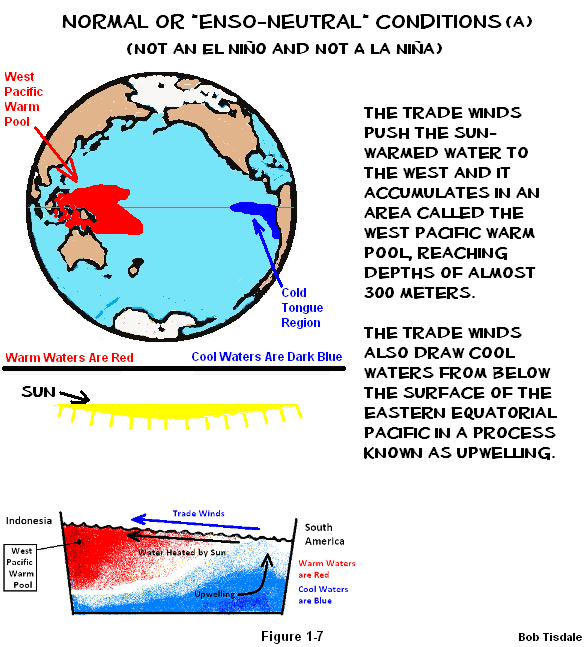
The trade winds are an important part of our discussion of ENSO-neutral, or “normal”, conditions in the tropical Pacific. They blow from east to west across the surface and cause the surface waters to also travel from east to west. That makes sense. If you blow on a liquid long and hard enough, the surface of the liquid will move it the direction you’re blowing.
The trade winds also blow clouds toward the west. That’s not hard to imagine, either. This allows that wonderfully strong tropical sun to beat down on the surface of the tropical Pacific and to reach into the subsurface waters to depths of 100 meters. Though most of that sunlight is absorbed nearer the surface, in the top 10 meters (roughly 33 feet) or so, it does reach farther. All of Mother Nature’s glorious sunlight warms the tropical Pacific waters as they travel west.
The trade winds push the waters up against the land masses of Indonesia and Australia. This causes the warm water to, in effect, pile up in the western tropical Pacific, in an area called the west Pacific Warm Pool. The trade winds driving the westward movement of surface waters also draw cool waters from below the surface of the eastern equatorial Pacific, in a process called upwelling. That upwelled water provides a continuous source of cool water at a relatively constant temperature that’s then warmed by the sun as it travels west. The water is, therefore, cooler in the eastern equatorial Pacific, in an area called the Cold Tongue Region, than it is in the west Pacific Warm Pool. Remember, the tropical Pacific stretches almost halfway around the globe, so that nice cool supply of water in the east travels a long way under the tropical sun before it reaches the warm pool in the west.
The trade winds cause the temperature difference between the east and west portions of the tropical Pacific. Now, here’s the interesting part. The temperature difference between the eastern and western tropical Pacific causes the trade winds to blow. That’s right. The temperature gradient of the tropical Pacific sea surface temperatures and the trade winds interact with one another in a positive feedback loop called Bjerknes feedback.
Why does that happen?
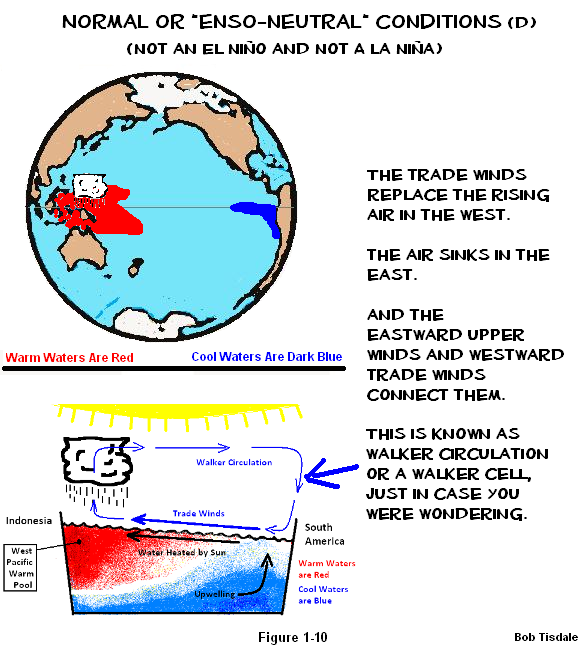
There nothing mysterious going on. The warmest water is in the western tropical Pacific. We’ve discussed that, and we’ll confirm it in Section 3. The warm water there heats the air above it, and that relatively hot air rises. All of that rising hot air has to be replaced by other air, and it’s the trade winds out of the east that supply the necessary make-up air. Because the tropical Pacific is cooler in the east, the air sinks there, and eastward-blowing upper winds complete the circuit. Overall, the warm air rises in the west; it cools as it’s carried east by the upper winds; then it sinks in the eastern tropical Pacific, where it heads back to the west as the trade winds. That circuit is called a Walker cell. The trade winds continuously push cool water from the east to the west, sunlight warms the water as it travels west, and when that warm water reaches the west Pacific Warm Pool, it supplies the heat necessary to maintain the updraft, which, in turn, causes to trade winds to blow. The briefest way to explain it: the trade winds and the sea surface temperatures are coupled, meaning they interact with one another.
With all of that warm water being piled up in the western tropical Pacific, and with all of the cool water being drawn from the eastern equatorial Pacific, the surface of the water—the sea level—in the west Pacific Warm Pool is about 0.5 meters (approximately 1.5 feet) higher in elevation than it is in Cold Tongue Region in the east.
Everything’s in tune, running in its normal state. The temperature difference between the east and west keeps the trade winds blowing—and—the trade winds maintain the temperature difference between east and west—and—the trade winds keep the warm water in the west Pacific Warm Pool at a higher elevation than it is in the eastern equatorial Pacific.
We can’t forget about gravity. It’s always there, our constant companion. Gravity would like the sea surface height in the west to equal the height in the east. It likes level playing fields. It’s working against the trade winds, and the trade winds are piling up the warm water against gravity. Still, everything is in relatively constant state of balance, with little gives and takes here and there.
Then some weather event—and that’s precisely what it is, a weather event or group of weather events—causes the trade winds to relax. That means the coupled ocean-atmosphere processes taking place in the tropical Pacific are no longer in balance. Sometimes, the weakened trade winds aren’t strong enough to hold the warm water in place in the west Pacific Warm Pool against gravity, so gravity takes over and all of that lovely warm water that was piled in the west Pacific Warm Pool suddenly sloshes to the east. That’s how an El Niño starts.
I’m now going discuss parts of the process that haven’t been shown in the illustrations yet.
The Pacific Ocean is awfully wide at the equator, so it takes a while, about 2 months, for the warm water to slosh to the east as far as the coast of South America.
Let’s put things into perspective. The west Pacific Warm Pool holds a massive amount of warm water. It varies in size. When it’s large, the west Pacific Warm Pool can cover a surface area of about 19 million square kilometers (7.3 million square miles) but it averages about 12 million square kilometers (4.6 million square miles). Numbers that large are hard to embrace, so, when the west Pacific Warm Pool is larger than normal, think of an area the size of Russia or a little less than twice the size of the United States. Refer to the Mehta and Mehta (2004) presentation Natural decadal-multidecadal variability of the Indo-Pacific Warm Pool and its impacts on global climate. Also imagine the warm water reaches depths of 300 meters (about 1000 feet). Sometimes, during a very strong El Niño, most of that water from the west Pacific Warm Pool will be transported east and much of it will spread across the surface of the central and eastern tropical Pacific. Now remember that the Pacific stretches almost halfway around the globe at the equator. An El Niño dwarfs all other weather-related events. How big are they? Sometimes it takes a pair of tropical cyclones just to trigger an El Niño. Yes, tropical cyclones as in hurricanes.
Let’s return to the ENSO-neutral phase for a second. A weather event—for example, a couple of tropical cyclones or a pair of them that straddle the equator—a weather event that’s teeny by comparison, has caused the Pacific trade winds to relax, which in turn has unleashed a monstrously large phenomenon that is capable of raising global temperatures 0.4 degrees C in less than a year. In turn, there are heat waves and cold spells. Floods will strike some parts of the globe. Drought conditions form in others. Snowfall will pile to record heights in some areas, and in others it will decrease. These effects were studied and documented decades ago, and they’re still being studied, for example, to account for differences between Central Pacific and the more powerful East Pacific El Niño events.
Of course, some publicity seeking climate scientists continue to (very unwisely) blame carbon dioxide for the heat waves and cold spells, flooding and drought, blizzards and low snowfall, creating further disbelief in climate science. They have only themselves to blame for their loss of credibility. I digress.
An El Niño is one of Mother Nature’s ways of reminding us who’s in charge.
Back to the cartoon-like illustrations.
# # # # #

# # # # #

# # # # #

# # # # #

# # # # #

# # # # #

# # # # #

# # # # #
# # # # #

# # # # #

# # # # #
# # # # #

# # # # #

# # # # #

# # # # #

# # # # #

# # # # #

# # # # #
1.3 Recap of Section 1
Trade winds cause the sea surface temperature and height in the western tropical Pacific to be greater than they are in the east. El Niño events are started by the weakening of the trade winds. The weaker trade winds can no longer hold the warm water in place in the west Pacific Warm Pool, and this allows gravity to carry the warm water east, raising sea surface temperatures in the central and eastern equatorial Pacific.
El Niño events are the abnormal phase of ENSO. The Equatorial Countercurrent strengthens and carries a large volume of warm water from west to east, and that increased volume from west to east opposes the normal east-to-west flow during ENSO-neutral and La Niña phases. The winds also change directions during an El Niño, with trade winds becoming westerlies in the western tropical Pacific. On the other hand, during ENSO-neutral and La Niña phases, the trade winds are blowing in their normal east-to-west direction.
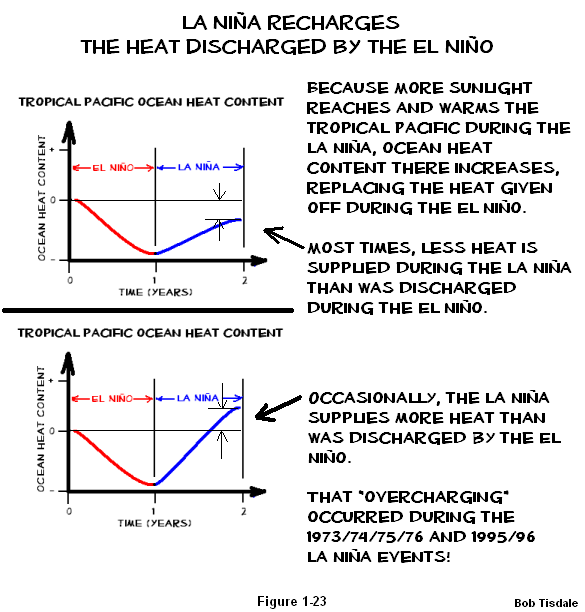
La Niña events are easy to describe. They are exaggerations on the ENSO neutral phase. However, La Niña events play the important role of replenishing the heat given off by the El Niño that precedes it, and sometimes a La Niña can create more warm water than was released by the El Niño.
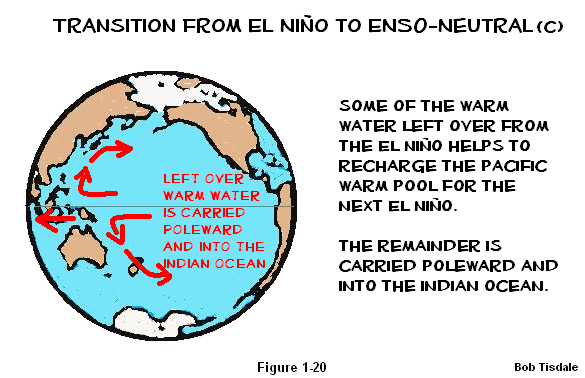
Warm water that has traveled east during the El Niño and that is not “exhausted” by the El Niño does not remain in the eastern tropical Pacific. It is returned to the West Pacific and Indian Oceans, where much of it remains on the surface. Before the El Niño, most of that warm water is below the surface of the west Pacific Warm Pool and excluded from the surface temperature record. Then, after the El Niño, part of what remains of that warm water is now on the surface of the West Pacific and East Indian Oceans. The opposite does not occur during the La Niña phase. The result: strong El Niño events can raise global sea surface temperatures for extended periods of time. This will be discussed in detail in Section 5.
[END OF SECTION 1 OF WHO TURNED ON THE HEAT?]
Again, if you have any questions, please ask.
Now that you’ve run through the processes, here’s a one sentence description of ENSO: ENSO acts as a chaotic, naturally occurring, sunlight-fueled, recharge-discharge oscillator, where the La Niña phase acts as the recharge phase and El Niño acts as the discharge phase.
As long as the climate science community continues to treat ENSO as noise, they will make little progress in understanding the natural contribution to global warming, and it’s a sizeable contribution. We’ve discussed for years that the climate science community has failed to account for the “leftovers”, the residual warm water, from strong El Niños.
I also used those cartoon-like illustrations in my two-part video series “The Natural Warming of the Global Oceans”, which first aired on the WUWT-TV special in September 2012. That series is available on YouTube. Part 1 is here, and Part 2 is here.
I went into much more detail to explain ENSO processes and the aftereffects of El Niño and La Niña events in my ebook Who Turned on the Heat? I’ve lowered the price of Who Turned on the Heat? from U.S.$8.00 to U.S.$5.00…for a month or so, with hope of increasing sales a little bit. A free preview in pdf format is here. The preview includes the Table of Contents, the Introduction, the first half of section 1 (which was provided complete in this post), a discussion of the cover, and the Closing. Take a run through the Table of Contents. It is a very-detailed and well-illustrated book—using data from the real world, not models of a virtual world.
Who Turned on the Heat? is only available in pdf format…and will only be available in that format. Click here to purchase a copy. Thanks. Unless I can find funding for my research, it will be book sales and tips/donations that allow me to return to blogging full-time.
fritz says: Perhaps I read to fast ; but what happens with the global sea level during these events ; I read that it increases during El Nino events because rain falls in the sea , while during La Nina , rain falls over Land ; that comparison is only true for what you call Central Pacific events ;
That relationship is also true for East Pacific El Niño events (refer to the 1997/98 El Niño):
http://bobtisdale.files.wordpress.com/2013/07/figure-54.png
The graph is from the following post:
http://bobtisdale.wordpress.com/2013/07/23/no-consensus-among-three-global-precipitation-datasets/
fritz says: “other question : the transfer of heat from the sea to the atmosphere should normally decrease its thermal expansion ; do you have made calculations about the impact of both factors to the global sea level heigth ?”
Sorry. No.
BTW, your English is fantastic.
Birdieshooter says: “Given the pushing of the water to the west, is this the reason some of those South Pacific islands are the focus of a lot of attention about sea level rise threatening their existence? How much variance in that rise would they experience over say a 20 or 30 year period? I had thought much of the concern might have been subsidence but it appears these cycles add to the levels as well.”
Sorry, Birdieshooter. There’s only satellite-based sea level data since the early 1990s, and I haven’t done any comparisons of east and west Pacific tidal gage data.
Ok, how many Hiroshima bombs per second does it take to pile up that .5m of water in the Pacific Warm Pool? Is that amount of gravitational potential energy being properly accounted for in the Global Warming energy budget?
W^3
Great article, should be part of a high school curriculum! The only thing that needs explaining for me is what weakens the trade winds, that then leads to the slosh back east. Is it when discharge is high or expanding cloud cover with less surface heating?
Excellent primer, only slightly soured by the sanctimonious little digression against climate scientists.
Eduard says: “The only thing that needs explaining for me is what weakens the trade winds, that then leads to the slosh back east.”
The weakening of the trade winds are caused by “Westerly Wind Bursts”. See the post here:
http://bobtisdale.wordpress.com/2013/10/22/enso-basics-westerly-wind-bursts-initiate-an-el-nino/
Regards
Several “aha” moments for me as I read your excellent post. Thank you.
D Ashcart says: “Excellent primer, only slightly soured by the sanctimonious little digression against climate scientists.”
I assume you’re referring to the following paragraph:
As long as the climate science community continues to treat ENSO as noise, they will make little progress in understanding the natural contribution to global warming, and it’s a sizeable contribution. We’ve discussed for years that the climate science community has failed to account for the “leftovers”, the residual warm water, from strong El Niños.
There’s nothing sanctimonious about it. It’s the truth. They’re only misleading themselves.
Hi Bob: Thanks for responding. I was referring to that para and the following:
“Of course, some publicity seeking climate scientists continue to (very unwisely) blame carbon dioxide for the heat waves and cold spells, flooding and drought, blizzards and low snowfall, creating further disbelief in climate science. They have only themselves to blame for their loss of credibility. I digress.”
Your article is professorial and nicely done. In my opinion, these jabs did not add value. So there you are. I think you’re a solid & thoughtful contributor to the field and I will continue to follow your work.
How very interesting. My undying gratitude for making it so simple.
In fact I really knew almost all of that, but had never even tried to put it together in such an understandable way, even for myself. No wonder I had trouble trying to explain it to someone else.
If only we had more people with this understanding, who could put things together for us.
Regarding eBooks and the PDF format. You mentioned that they require Adobe reader. Many people do not like installing Adobe Reader on their PCs because it’s a bloated and insecure product. There are several excellent free alternative like Foxit Reader and Sumatra PDF. Both products perfectly read all PDFs, but best of all, they are tiny programs that don’t slow your computer down like Adobe products, and they are immune to the security treats from Adobe products. Both can also be run as “portable” programs – you don’t even need to install them, your just run them as a single executable file that never installs itself.
At 86 responses already, I am just catching up. Well done presentation/questions/answers.
Thanks, Bob.
~~~~~~~~~
at John L. Kelley and “ring of fire”
JLK asks “. . . then why doesn’t this oceanic heating occur all over the planet? Why is this happening exclusively within the Ring Of Fire?
That is not what Bob T. wrote – he is writing mostly of the area about 1,500 miles on either side of the Equator. If he mentioned Ring of Fire, I missed it. For what it is worth, sunlight warms water any time it penetrates the surface. Seeing things underwater requires light and light is energy. If you look straight down on the ocean where the water is clear with the Sun directly above then the water will appear almost black. The light is absorbed – heat is entering the water. As mentioned in the post, that happens in the to 100 m. or so. Away from the normal-rays reflection increases. [Earth is called the Blue Planet because of the scattering of light as it passes through the atmosphere and producing a blue shell. It is also called the “water planet” but for a very different reason.]
and: the “heat from within”:
Maybe a real geologist could answer this but, anecdotally I have been down to about 8,500 feet below sea level in a mine where the internal heat cannot be missed. Upon return to the surface the ground temperature was determined by the air temperature – frozen in winter, warm in summer. A short distance underground, say in Mammoth Cave, the temperature is about 54 degrees Fahrenheit year round. This suggests to me the contribution to “Climate” of internal heat is small.
I really liked that you made the following frank statement, because we never stop hearing about “all the climate scientists” who agree with CO2 climate theory, and for every one like you who is willing to state his/her professional opinion on the matter, there are undoubtedly many more who agree with you who don’t stand publicly against the “consensus”:
“Of course, some publicity seeking climate scientists continue to (very unwisely) blame carbon dioxide for the heat waves and cold spells, flooding and drought, blizzards and low snowfall, creating further disbelief in climate science. They have only themselves to blame for their loss of credibility. I digress.”
Bob, great explanation! I asked you several years ago about keeping track of the energy balance for the world: [Energy Difference = Energy In – Energy Out] or [Sunlight In – Heat Radiated Out]. In a simple model of the world, a positive energy difference increases the temperature of the world while a negative difference lowers the temperature of the world. I asked you why the science community only uses temperature for its analysis and predictions instead of calculating the energy balance. You responded that you did not know why.
The simple model of energy balance is not useful because it does not take into account for the[Energy In] that is stored out of sight only to be released later. For instance, if 1% of the incoming sunlight is sometimes stored in the ocean instead of heating the atmosphere, the global atmospheric temperature may appear to drop even if the incoming radiation rate has not changed. Eventually that heat will find its way back into the atmosphere from the ocean. When it does find its way into the atmosphere is the factor that determines what happens. If the atmosphere is cooling, the extra release of heat may lessen or stop the cooling. If the atmosphere is heating up for some other reason, heat released from the ocean may cause it to increase faster. This “timing” is called the “phase” of the signal in the physics world and my world of engineering. One way to prevent phase effects from distorting a measurement, any measurement, is to measure over very long periods, periods that far exceed the cycle time for periodic mechanisms like ENSO.
I know that you understand this as do many of your readers but some of your readers may not. I wanted to give the introduction before asking my questions. You described in your explanation that El Ninas recharge the warm water pool. In other words, El Ninas store [Energy In]. If every El Nino released exactly as much energy as the preceding El Nina stored, then ENSO would have no long term effect on the earth’s temperature. However, you noted that some El Nino’s undercharge while others overcharge. Even if over the long term the energy stored minus that released averages to zero, the variance from one cycle to another will cause variations in the heat released to the atmosphere from the ocean and possibly affect global temperatures one way or another.
In particular, you pointed out that El Nina overcharged in the middle of the 70’s and again in the middle of the 90’s. If the heat release by El Nino has a 5 or 10 year phase delay, then might those two overcharging events have contributed to the present warm cycle that started in the 80’s? How much energy is involved in an overcharging event? Is it enough to account for the energy required to increase our atmospheric temperatures to the level peaked around 2000? With a phase delay of 10 years, might the overcharging event in ’95/’96 be delaying a cooling cycle that should have already started? Is there any understanding of the phase delay for El Nino releasing heat stored by El Nina? Are there cold cycles in the atmospheric temperature that appear related to undercharging El Ninas? To even out the cycles, how long do you think we must wait while collecting data before we can confidently ascertain the coupling between ENSO and the long temperature cycles (60 to 90 years) that seem to show up everywhere in historical data?
Lots of questions, I know, but thanks!
Bob, what is the time constant?
Thinking of a RC circuit, your recharge discharge oscillator.
After the warm pool sloshes east, how much is the western warm pool depleted in volume and temperature?
How long does it take to recharge?
How long from pulse to complete dissipation of its effects?
As in flow west, return east and then curve north and south as the gyres, how likely are the gyres to effect polar ice.
Caleb Shaw’s posting of WUWTJanuary 9th prompts these pieces of an idea, from a large El Nino, how long does it take for the western pool to grow ?
What happens to the gyre currents during the transition?(El Nino, neutral, El Nina)
Does the amount of water being moved change?
Do we have ocean temperature data of sufficient duration, to see one complete cycle?
Great explanation Mr. Tisdale. In fact I bought your ebook.
You show (in the book and videos) the East Indian-Western Pacific SST anomalies increase during El Nino events, then slowly decrease between events. This is leading to a stair-step increase in SSTs from the 70’s to current. But this increase in SSTs can’t go on forever. How do the temperatures return to lower levels? Have El Nino events occurred less frequently in the past, giving the ocean SSTs time to drop?
Michael Barnes says: “Since the water in the West Pacific Warm Pool is warmer than the water in the Cold Tongue Region, the water in the West is less dense than the water in the East. Is this explicitly accounted for? How much does it matter?”
Bob Tisdale says: I don’t believe I’ve ever seen your questions addressed anywhere.
I’ve not seen this addressed, either, so far, though it does seem to indirectly relate to your heat pump/Walker cell diagram. Another similar question never addressed is:
A. During La Nina conditions, as eastern Pacific temperatures drop, ocean surface tension, density and viscosity all increase (particularly viscosity). There are parallel changes in atmospheric conditions: rises in density and viscosity, a drop in humidity. All of these physical properties would present greater wind resistance in sea and sky. Is the magnitude of these changes sufficient to present a significant obstacle to the trade winds above or adjacent to the cold tongue?
Some new questions that might be of general interest:
B. Are there really trade winds? Or does the air stand still and the Earth move beneath it?
C. How stable is the cold tongue?
D. Could an apparently minor fluctuation in the cold tongue location initiate an eastern Pacific N-S oscillation in the trade winds? (Depending on your frame of reference, this could equate to westerly wind bursts. See B, above.)
Ich bin ein Slosher. Great post, Bob.
Great work. Yet another example of the “picture > 1000 words” principle. I now understand the Spanish children.
(But it really is CO2 doing it all, isn’t it?)
Thanks Bob. I always get El Nino & La Nina mixed up. Maybe I can get it straight now with your easy to understand illustrations. Very good post. (Get to work now – lol)
Bob –
If I come off as a contrarian here, it is not my intention, but your start of the El Niño here doesn’t agree with the El Niño formation in 1998 – as shown in your own YouTube video.
In your earlier post “La Niña is not the Opposite of El Niño”*** you point to this YouTube video:
In the video as the 12-month averages progress one month at a time, the first thing one sees is a warming above the East Pacific Rise (EPR) in the eastern Pacific without a commensurate anomaly lowering in the west (the west is still white). If the El Niño starts as a stoppage of the equatorial easterlies that are piling up warm water in the west, then the west Pacific warm Pool (WPWP) should cool down. Where is the cooling down?
We should see two things if the warm piled up water is moving east: We should see a warm anomaly starting east of the WPWP and a cooling IN the WPWP. And the warm anomaly should be continuing to move eastward and expanding – and leaving a remnant warm anomaly all along the way, AND the WPWP should continue to cool. After all, the warmth is leaving and traveling eastward.
But we don’t see that. Or anything close to it.
Look at 0:25: [Dec-Nov97] There is a warm bloom beginning over the EPR – IN THE EAST, off the coast of S America. The WPWP is white.
At 0:26: [Jan-Dec97] The EAST anomaly is growing. The WPWP? Still white. It should be cooling and turning bluer. I AM paying attention to the fact that these are anomalies, so I assume that the WPWP is as warm as it is normally during ENSO Neutral conditions.
At 0:27: [Feb-Jan98] WOW. The bloom over the EPR has grown and warmed considerably. Hottest over the Galapagos. The WPWP? Still white. Where is the cooling? If the El Niño is this massive warm pool moving east and CAUSING it all – bringing the heat eastward – where is the cooling that must come in the WPWP? That “piled up” warm water is moving east? Where is the evidence here?
At 0:27-28: [Mar-Feb98] MUCH bigger and warmer heat bloom over the EPR. It stretches to the S America coast and west as far as Seattle. Still nothing doing in the WPWP. The warmth moving east still hasn’t shown up as a cooling in Indonesia. There is some warmth moving eastward out of the Indian Ocean.
At 0:28: [Apr-Mar98] HUGE EPR bloom with PINK showing in the center, just west of the Galapagos. It extends from SA to as far west as the Bering Strait. In addition, a northern warm bloom has extended west of Central America all the way to about the longitude of Kamchatka. The WPWP? Finally some warmth, NOT COOLING, and it is that warmth from the Indian Ocean extending into Indonesia.
At 0:28: [May-Apr98] The warm bloom over the EPR has now turned PINK, and extends all the way from SA to as far west a Anchorage. The yellow is as far west as New Zealand. The WPWP? Still no cooling.
At 028:-0: [Jun-May98] The PINK has grown even more, wider and a bit longer to the west. The long warm tongue from the east has joined with the warm tongue out of the Indian Ocean. The WPWP is warmer than when the sequence started.
I could continue, but I am addressing the START of the El Niño, not the middle or end of it.
If your YT video is correct, there was NO piled up sloshing eastward to start the 1998 El Niño. The first and ONLY feature in the video is the heat bloom beginning and growing over the Eastern Pacific Rise and expanding and expanding until it reached all the way westward.
Bob, your two posts are 180° contradicting each other.
What gives with this?
It is patently clear that the 1998 El Niño began in the EAST, not the west. Unless your earlier video is based on bad data. In which case you would have taken it down.
Which is correct? The presentation here or the data-based video?
Note to Anthony: THIS video is exactly what my proposed post the other day is about. There is clearly a heat source on the Eastern Pacific Rise that started the 1998 El Niño. I propose that the heat source is the Eastern Pacific Rise itself. This Ridge is the fastest spreading mid-ocean ridge in the world, meaning more heat comes out of it than any other. At the Galapagos it joins the Galapagos Rift, which is where hydrothermal vents were found and have been found in abundance. There is every reason to think this region has the most terrestrial “heat flow” (technical term), coming out of the Earth from the mantle. The heat flow here has been measured at ten times the global average and more, so it is always a hot spot. Variations in this heat flow from below may well be the cause of El Niño. Bob’s YT video supports this premise. This post contradicts the video and this premise. There IS no heat bubble moving eastward. There is only a heat plume forming in the eastern Pacific, and the heat flows WEST from there.
And BTW, the heat flow averaged over this EPR region is – to the best I can get out of the data – from the International Heat Flow Committee – is that the heat flow here is approximately equal to all of the internal heat of the entire world.
The upshot of this is really this: The climate people may be missing an integral portion of heat in their balancing of the climate. And if the missing element has variations, then it could explain the oscillations in the ENSO, as well as their variability in time and duration. I do not KNOW that there are such variations, but Bob’s YouTube video shows a LOT of heat warming up the EPR region in 1998.
[Cross-posting this to my blog at http://www.feet2thefire.wordpress.com]
——-
***http://wattsupwiththat.com/2010/06/11/la-nina-is-not-the-opposite-of-el-nino-%E2%80%93-the-videos/
Misworded: “…the heat flow here is approximately equal to all of the internal heat of the entire world.” Should read “…the heat flow here is approximately equal to all of the terrestrial heat flow of the entire world, according to my rough calculation and the limited data available.”
Quite insightful i must say.http://highflyersarena.wordpress.com/2014/01/10/challenges-of-future-leaders-f-mod/
@Bob
Great post. There are all sorts of effects here that you have to guess are not modeled correctly at all. For example, what happens to the trade winds as they push up against the slope of the water – this must in some way affect the winds as it effectively causes the wind to push uphill, then as it rolls over in the north it’s back to going downhill.
@Monster
It’s the potential energy of the water massed up on one side which gets more or less totally used up pushing the water back to equilibrium, it will not get “released” in any significant way as heat.
None says: “There are all sorts of effects here that you have to guess are not modeled correctly at all.”
See Guilyardi et al (2009). One might conclude that there are only a few parts of ENSO processes that are simulated correctly and they’re only right in a few climate models:
http://www.knmi.nl/publications/fulltexts/guilyardi_al_bams09.pdf
BTW: the slope of the tropical Pacific sea level is only 0.5 meters over 16,000 km during ENSO neutral conditions.
Steve Garcia says: “If I come off as a contrarian here, it is not my intention, but your start of the El Niño here doesn’t agree with the El Niño formation in 1998 – as shown in your own YouTube video.”
Thanks for linking the video, but I’ll explain why there’s no conflict or contradiction.
Steve Garcia says: “In the video as the 12-month averages progress one month at a time, the first thing one sees is a warming above the East Pacific Rise (EPR) in the eastern Pacific without a commensurate anomaly lowering in the west (the west is still white). If the El Niño starts as a stoppage of the equatorial easterlies that are piling up warm water in the west, then the west Pacific warm Pool (WPWP) should cool down. Where is the cooling down?”
Good observation. You’re right; there is a relatively small drop in the sea surface temperatures of the West Pacific Warm Pool during the El Niño…compared to the rise in sea surface temperatures in the eastern tropical Pacific. That indicates the warm water that fuels the El Niño isn’t coming only from the surface of the West Pacific Warm Pool. So where’s it coming from? Below the surface.
The sea level drops in the West Pacific Warm Pool during the El Nino. See the following animation, with sea surface temperature anomalies in the top maps and the sea level anomalies in the bottom ones:
http://bobtisdale.files.wordpress.com/2012/02/with-sea-level.gif
It’s Animation 6-4 is from this post:
http://bobtisdale.wordpress.com/2012/09/03/animations-discussed-in-who-turned-on-the-heat/
Steve Garcia says: “It is patently clear that the 1998 El Niño began in the EAST, not the west. Unless your earlier video is based on bad data. In which case you would have taken it down.”
The 1997/98 El Niño began in the west. The warm water for the El Niño comes from the West Pacific Warm Pool. Here’s an animation from the JPL that starts with two (warm) downwelling Kelvin Waves streaking (over about 2 months) from west to east across the equatorial Pacific. The first (weaker) Kelvin wave started about Christmas in 1996. The second one began in March 1997.
http://bobtisdale.files.wordpress.com/2012/06/animation-4-2.gif
You’re assuming that an El Niño is only a surface phenomenon, when much is taking place below the surface and, therefore, does not appear in the sea surface temperature data.
There are no conflicts between my posts or videos.
Regards