While some model based claims say that CO2 residence times may be thousands of years, a global experiment in measurable CO2 residence time seems to have already been done for us.
By Christopher Monckton of Brenchley
Is the ~10-year airborne half-life of 14CO2 demonstrated by the bomb-test curve (Fig. 1, and see Professor Gösta Pettersson’s post) the same variable as the IPCC’s residence time of 50-200 years? If so, does its value make any difference over time to the atmospheric concentration of CO2 and hence to any consequent global warming?

Figure 1. The decay curve of atmospheric 14C following the ending of nuclear bomb tests in 1963, assembled from European records by Gösta Pettersson.
The program of nuclear bomb tests that ended in 1963 doubled the atmospheric concentration of 14CO2 compared with its cosmogenic baseline. However, when the tests stopped half the 14C left the atmosphere in ten years. Almost all had gone after 50 years. Why should not the other isotopes of CO2 disappear just as rapidly?
Mr. Born, in comments on my last posting, says the residence time of CO2 has no bearing on its atmospheric concentration: “It’s not an issue of which carbon isotopes we’re talking about. The issue is the difference between CO2 concentration and residence time in the atmosphere of a typical CO2 molecule, of whatever isotope. The bomb tests, which tagged some CO2 molecules, showed us the latter, and I have no reason to believe that the residence time of any other isotope would be much different.”
He goes on to assert that CO2 concentration is independent of the residence time, thus:
The total mass m of airborne CO2 equals the combined mass m12 of 12,13CO2 plus the mass m14 of 14CO2 (1):
(1) ![]() .
.
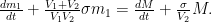
Let CO2 be emitted to the atmosphere from all sources at a rate e = e12 + e14 and removed by uptake at a rate u. Then the rate of change in CO2 mass over time is given by
(2)  ,
,
which says the total mass m of CO2, and thus its concentration, varies as the net emission, which is the difference between source e and sink u rates.
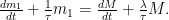
For example, if e = u, the total mass m remains unchanged even if few individual molecules remain airborne for long. Also, where e > u, m will rise unless and until u = e. Also, unless thereafter u > e, he thinks the mass m will remain elevated indefinitely. By contrast, he says, the rate of change in 14CO2 mass is given by
(3)  ,
,
which, he says, tells us that, even if e were to remain equal to u, so that total CO2 concentration remained constant, the excess 14CO2 concentration
(4) ![]() ,
,
which is the difference between the (initially elevated) 14CO2 concentration and the prior cosmogenic baseline 14CO2 concentration, would still decay with a time constant m/u, which, therefore, tells us nothing about how long total CO2 concentration would remain at some higher level to which previously-elevated emissions might have raised it. In this scenario, for example, the concentration remains elevated forever even though x decays. Mr. Born concludes that the decay rate of x tells us the turnover rate of CO2 in the air but does not tell us how fast the uptake rate u will adjust to increased emissions.
On the other hand, summarizing Professor Pettersson, reversible reactions tend towards an equilibrium defined by a constant k. Emission into a reservoir perturbs the equilibrium, whereupon relaxation drains the excess x from the reservoir, re-establishing equilibrium over time. Where µ is the rate-constant of decay, which is the reciprocal of the relaxation time, (5) gives the fraction ft of x that remains in the reservoir at any time t, where e, here uniquely, is exp(1):
(5) ![]() .
.
The IPCC’s current estimates (fig. 2) of the pre-industrial baseline contents of the carbon reservoirs are 600 PgC in the atmosphere, 2000 PgC in the biosphere, and 38,000 PgC in the hydrosphere. Accordingly the equilibrium constant k, equivalent to the baseline pre-industrial ratio of atmospheric to biosphere and hydrosphere carbon reservoirs, is 600 / (2000 + 38,000), or 0.015, so that 1.5% of any excess x that Man or Nature adds to the atmosphere will remain airborne indefinitely.
Empirically, Petterson finds the value of the rate-constant of decay µ to be ~0.07, giving a relaxation time µ–1 of ~14 years and yielding the red curve fitted to the data in Fig. 1. Annual values of the remaining airborne fraction ft of the excess x, determined by me by way of (5), are at Table 1.

Figure 2. The global carbon cycle. Numbers represent reservoir sizes in PgC, and carbon exchange fluxes in PgC yr–1. Dark blue numbers and arrows indicate estimated pre-industrial reservoir sizes and natural fluxes. Red arrows and numbers indicate fluxes averaged over 2000–2009 arising from CO2 emissions from fossil fuel combustion, cement production and land-use change. Red numbers in the reservoirs denote cumulative industrial-era changes from 1750–2011. Source: IPCC (2013), Fig. 6.1.
| t = 1 | .932 | .869 | .810 | .755 | .704 | .657 | .612 | .571 | .533 | .497 |
| 11 | .464 | .433 | .404 | .377 | .362 | .329 | .307 | .287 | .268 | .251 |
| 21 | .235 | .219 | .205 | .192 | .180 | .169 | .158 | .148 | .139 | .130 |
| 31 | .122 | .115 | .108 | .102 | .096 | .090 | .085 | .080 | .076 | .071 |
| 41 | .067 | .064 | .060 | .057 | .054 | .052 | .049 | .047 | .045 | .042 |
| 51 | .041 | .039 | .037 | .036 | .034 | .033 | .032 | .030 | .029 | .028 |
| 61 | .027 | .027 | .026 | .026 | .024 | .024 | .023 | .022 | .022 | .021 |
| 71 | .021 | .021 | .020 | .020 | .019 | .019 | .019 | .019 | .018 | .018 |
| 81 | .018 | .018 | .017 | .017 | .017 | .017 | .017 | .017 | .016 | .016 |
| 91 | .016 | .016 | .016 | .016 | .016 | .016 | .016 | .016 | .016 | .016 |
| 101 | .016 | .015 | .015 | .015 | .015 | .015 | .015 | .015 | .015 | .015 |
| 111 | .015 | .015 | .015 | .015 | .015 | .015 | .015 | .015 | .015 | .015 |
Table 1. Annual fractions ft of the excess x of 14CO2 remaining airborne in a given year t following the bomb-test curve determined via (5), showing the residential half-life of airborne 14C to be ~10 years. As expected, the annual fractions decay after 100 years to a minimum 1.5% above the pre-existing cosmogenic baseline.
Now, it is at once evident that Professor Pettersson’s analysis differs from that of the IPCC, and from that of Mr. Born, in several respects. Who is right?
Mr. Born offers an elegantly-expressed analogy:
“Consider a source emitting 1 L min–1 of a fluid F1 into a reservoir that already contains 15.53 L of F1, while a sink is simultaneously taking up 1 L min–1 of the reservoir’s contents. The contents remain at a steady 15.53 L.
“Now change the source to a different fluid F2, still supplied at 1 L min–1 and miscible ideally with F1 as well as sharing its density and flow characteristics. After 50 minutes, 96% of F1 will have left the reservoir, but the reservoir will still contain 15.53 L.
“Next, instantaneously inject an additional 1 L bolus of F2, raising the reservoir’s contents to 16.53 L. What does that 96% drop in 50 minutes that was previously observed reveal about how rapidly the volume of fluid in the reservoir will change thereafter from 16.53 L? I don’t think it tells us anything. It is the difference between source and sink rates that tells us how fast the volume of fluid in the reservoir will change. The rate, observed above, at which the contents turn over does not tell us that.
“The conceptual problem may arise from the fact that the 14C injection sounds as though it parallels the second operation above: it was, I guess, adding a slug of CO2 over and above pre-existing sources. But – correct me if I’m wrong – that added amount was essentially infinitesimal: it made no detectable change in the CO2 concentration, so in essence it merely changed the isotopic composition of that concentration, not the concentration itself. Therefore, the 14C injection parallels the first step above, while Man’s recent CO2 emissions parallel the second step.”
However, like all analogies, by definition this one breaks down at some point.

Figure 3. Comparison between the decay curves of the remaining airborne fraction ft of the excess x of CO2 across the interval t on [1, 100] years.
As Fig. 3 shows, the equilibrium constant k, the fraction of total excess concentration x that remains airborne indefinitely, has – if it is large enough – a major influence on the rate of decay. At the k = 0.15 determined by Professor Pettersson as the baseline pre-industrial ratio of the contents of the atmospheric to the combined biosphere and hydrosphere carbon reservoirs, the decay curve is close to a standard exponential-decay curve, such that, in (5), k = 0. However, at the 0.217 that is assumed in the Bern climate model, on which all other models rely, the course of the decay curve is markedly altered by the unjustifiably elevated equilibrium constant.
On this ground alone, one would expect CO2 to linger more briefly in the atmosphere than the Bern model and the models dependent upon it assume. To use Mr. Born’s own analogy, if any given quantum of fluid poured into a container remains there for less time than it otherwise would have done (in short, if it finds its way more quickly out of the container than the fixed rate of exit that his analogy implausibly assumes), then, ceteris paribus, there will be less fluid in the container.
Unlike the behavior of the contents of the reservoir described in Mr. Born’s analogy, the fraction of the excess remaining airborne at the end of the decay curve will be independent of the emission rate e and the uptake rate u.
Since the analogy breaks down at the end of the process and, therefore, to some degree throughout it, does it also break down on the question whether the rate of change in the contents of the reservoir is, as Mr. Born maintains in opposition to what Pettersson shows in (5), absolutely described by e – u?
Let us cite Skeptical Science as what the sociologists call a “negative reference group” – an outfit that is trustworthy only in that it is usually wrong about just about everything. The schoolboys at the University of Queensland, which ought really to be ashamed of them, feared Professor Murry Salby’s assertion that temperature change, not Man, is the prime determinant of CO2 concentration change.
They sought to dismiss his idea in their customarily malevolent fashion by sneering that the change in CO2 concentration was equal to the sum of anthropogenic and natural emissions and uptakes. Since there is no anthropogenic uptake to speak of, they contrived the following rinky-dink equationette:
(6) ![]()
![]() .
.
The kiddiwinks say CO2 concentration change is equal to the sum of anthropogenic and natural emissions less the natural uptake. They add that we can measure CO2 concentration growth (equal to net emission) each year, and we can reliably deduce the anthropogenic emission from the global annual fossil-fuel consumption inventories. Rearranging (6):
(7) ![]()
![]() .
.
They say that, since observed ea ≈ 2ΔCO2, the natural world on the left-hand side of (7) is perforce a net CO2 sink, not a net source as they thought Professor Salby had concluded. Yet his case, here as elsewhere, was subtler than they would comprehend.
Professor Salby, having shown by careful cross-correlations on all timescales, even short ones (Fig. 4, left), that CO2 concentration change lags temperature change, demonstrated that in the Mauna Loa record, if one examines it at a higher resolution than what is usually displayed (Fig. 4, right), there is a variation of up to 3 µatm from year to year in the annual CO2 concentration increment (which equals net emission).


Figure 4. Left: CO2 change lags and may be caused by temperature change. Right: The mean annual CO2 increment is 1.5 µatm, but the year-on-year variability is twice that.
The annual changes in anthropogenic CO2 emission are nothing like 3 µatm (Fig. 5, left). However, Professor Salby has detected – and, I think, may have been the first to observe – that the annual fluctuations in the CO2 concentration increment are very closely correlated with annual fluctuations in surface conditions (Fig. 5, right).


Figure 5. Left: global annual anthropogenic CO2 emissions rise near-monotonically and the annual differences are small. Right: an index of surface conditions (blue: 80% temperature change, 20% soil-moisture content) is closely correlated with fluctuations in CO2 concentration (green).
Annual fluctuations of anthropogenic CO2 emissions are small, but those of atmospheric CO2 concentration are very much larger, from which Professor Salby infers that their major cause is not Man but Nature, via changes in temperature. For instance, Henry’s Law holds that a cooler ocean can take up more CO2.
In that thought, perhaps, lies the reconciliation of the Born and Pettersson viewpoints. For the sources and sinks of CO2 are not static, as Mr. Born’s equations (1-4) and analogy assume, but dynamic. Increase the CO2 concentration and the biosphere responds with an observed global increase in net plant productivity. The planet gets greener as trees and plants gobble up the plant food we emit for them.
Similarly, if the weather gets a great deal warmer, as it briefly did during the Great el Niño of 1997/8, outgassing from the ocean will briefly double the annual net CO2 emission. But if it gets a great deal cooler, as it did in 1991/2 following the eruption of Pinatubo, net annual accumulation of CO2 in the atmosphere falls to little more than zero notwithstanding our emissions. It is possible, then, that as the world cools in response to the continuing decline in solar activity the ocean sink may take up more CO2 than we emit, even if we do not reduce our emissions.
Interestingly, several groups are working on demonstrating that, just as Professor Salby can explain recent fluctuations in Co2 concentration as a function of the time-integral of temperature change, in turn temperature change can be explained as a function of the time-integral of variations in solar activity. It’s the Sun, stupid!
It is trivially true that we are adding newly-liberated CO2 to the atmosphere every year, in contrast to the 14C pulse that ended in 1963 with the bomb tests. However, the bomb-test curve does show that just about all CO2 molecules conveniently marked with one or two extra neutrons in their nuclei will nearly all have come out of the atmosphere within 50 years.
To look at it another way, if we stopped adding CO2 to the atmosphere today, the excess remaining in the atmosphere after 100 years would be 1.5% of whatever we have added, and that is all. What is more, that value is not only theoretically derivable as the ratio of the contents of the atmospheric carbon reservoir to those of the combined active reservoirs of the hydrosphere and biosphere but also empirically consistent with the observed bomb-test curve (Fig. 1).
If the IPCC were right, though, the 50-200yr residence time of CO2 that it imagines would imply much-elevated concentrations for another century or two, for otherwise, it would not bother to make such an issue of the residence time. For the residence time of CO2 in the atmosphere does make a difference to future concentration levels.
To do a reductio ad absurdum in the opposite direction, suppose every molecule of CO2 we emitted persisted in the atmosphere only for a fraction of a second, then the influence of anthropogenic CO2 on global temperature would be negligible, and changes in CO2 concentration would be near-entirely dependent upon natural influences.
Atmospheric CO2 concentration is already accumulating in the atmosphere at less than half the rate at which we emit it. Half of all the CO2 we emit does indeed appear to vanish instantly from the atmosphere. This still-unexplained discrepancy, which the IPCC in its less dishonest days used to call the “missing sink”, is more or less exactly accounted for where, as Professor Pettersson suggests, CO2’s atmospheric residence time is indeed as short as the bomb-test curve suggests it is and not as long as the 50-200 years imagined by the IPCC.
And what does IPeCaC have to say about the bomb-test curve? Not a lot:
“Because fossil fuel CO2 is devoid of radiocarbon (14C), reconstructions of the 14C/C isotopic ratio of atmospheric CO2 from tree rings show a declining trend (Levin et al., 2010; Stuiver and Quay, 1981) prior to the massive addition of 14C in the atmosphere by nuclear weapon tests which has been offsetting that declining trend signal.”
And that is just about all They have to say about it.
Has Professor Pettersson provided the mechanism that explains why Professor Salby is right? If the work of these two seekers after truth proves meritorious, then that is the end of the global warming scare.
As Professor Lindzen commented when Professor Salby first told him of his results three years ago, since a given CO2 excess causes only a third of the warming the IPCC imagines, if not much more than half of that excess of CO2 is anthropogenic, and if it spends significantly less time in the atmosphere than the models imagine, there is nowhere for the climate extremists to go. Every component of their contrived theory will have been smashed.
It is because the consequences of this research are so potentially important that I have set out an account of the issue here at some length. It is not for a fumblesome layman such as me to say whether Professor Pettersson and Professor Salby (the latter supported by Professor Lindzen) are right. Or is Mr. Born right?
Quid vobis videtur?
Related articles
- Why and How the IPCC Demonized CO2 with Manufactured Information (wattsupwiththat.com)
Bart: “Why should k be constant? Plants grow, sediments accumulate. There is no theoretical constraint on this variable.”
Because it is in Professor Pettersson’s model. I can’t speak for him, but I assume he’d say he hasn’t tried to model every possible aspect of the universe, only enough to get some sense of what would happen if things were this simple. I’m no scientist, but my experience is they do that kind of thing all the time.
Also, k doesn’t keep the rate of uptake and natural emissions constant; it only helps determine whether their difference should be increasing or decreasing.
Is half-life really a valid concept to use in regard to atmospheric CO2? An increase in a trace gas like CO2 in the atmosphere should increase the rate of photosynthesis given sufficient sunlight and water, and appropriate temperatures. So the more CO2, the faster it should be changed to plant material. This effect is significant enough for professional greenhouses to raise CO2 levels and pay for it with increased plant growth. We are not expecting less atmospheric CO2, we are expecting more.
BTW, there is a great carbon cycle graph at the top of:
http://en.wikipedia.org/wiki/Carbon_cycle
And where is talk of putting excess carbon in the soil? The world is short on topsoil.
– – – – – – – –
Willis Eschenbach,
Wouldn’t Feynman expect you to “bend over backwards” to provide a few caveats, like all other things being equal? Wouldn’t he urge you to have a special kind of integrity to point out all possibility that there are a few exceptions, a few provisos, and a couple of quid pro quos?
Note: the above italicized line is from Genie in the movie ‘Aladdin’. : ) I always wanted to use it in a comment.
Willis, I think your statement is not sufficient without qualification. I think it is not necessary unless there is an exhaustive and comprehensively balanced increase in the knowledge of the carbon cycle undertaken first***.
Another thought => Do you suggest the existing Bern model is necessary and / or sufficient? Can any model categorically be necessary and / or sufficient; as a model per se?
*** mega funds available for carbon cycle research from hopefully curtailing failed CGM modeler’s activities.
John
John Whitman says:
November 25, 2013 at 2:08 pm
Despite your nasty and untrue implication about my integrity, and your attempt to hide your insult behind Richard Feynman, I stand by what I said. Mathematically, the straight simple exponential decay of the amount of CO2 injected into the atmosphere fits the historical atmospheric CO2 concentration record extremely well.
The “necessary” part of what I said refers to the fact that an explanation for the increase in CO2 is necesssary.
The “sufficient” part means that human emissions alone do an excellent job of explaining the historical record to date.
So yes, it is both necessary and sufficient.
Now, are there other things that might fill that need? Sure. So what?
Are there “provisos”? No, not other than we’re talking about the real world, with all that that means. I used the data from the historical emissions to estimate the historical atmospheric CO2 concentration … what provisos would you like me to add to that?
Did I bring up other evidence? Yes, I discussed the Vostok and theoretical change in CO2 as the ocean warms, and showed that it is not sufficient to explain the rise in CO2.
Sorry, that’s not clear. You think what is not necessary?
Sure. It fits the data at present as well as the simple model … although that nay not be true in the future, as one of the two will win out for accuracy. But at present, both are sufficient.
A “model” is just another name for an “explanation”. The difference is that the model generally includes the math.
So it’s not obvious what you are asking. It is the explanation which is necessary. Whether or not that explanation is sufficient depends on whether you need to make other assumptions or advance supporting ideas, or whether it fully explains the observations by itself.
What I’m putting forward is the explanation that an injected pulse of CO2 decays over time in an exponential manner. This idea of exponential decay not a novel idea, and it is certainly not my own idea. It is a common occurrence in the real world.
In addition, given the historical record of CO2 emissions, exponential decay fully explains the observations.
Now, as I said above, if you think the increase in CO2 has some other cause, or that it decays in some other fashion, then perhaps you can support your explanation by doing the math, as I have done for my explanation.
w.
PS—John, you opened by attacking my scientific integrity. As a result, your stock, and the weight I give your ideas and opinions, just fell precipitously, I had thought better of you than to make such a slimy accusation.
Willis Eschenbach says:
November 25, 2013 at 4:07 pm
“Mathematically, the straight simple exponential decay of the amount of CO2 injected into the atmosphere fits the historical atmospheric CO2 concentration record extremely well. “
Are you now talking about the bomb test curve? Or your superficial fit of accumulated emissions with atmospheric measurements?
“The “necessary” part of what I said refers to the fact that an explanation for the increase in CO2 is necesssary.
The “sufficient” part means that human emissions alone do an excellent job of explaining the historical record to date.
So yes, it is both necessary and sufficient.”
That is some just awful mutilation of terms with precise technical meaning, Willis. In a mathematical proof of an equation, we do not say something is “necessary” because it is necessary for someone to solve the equation. We say it is “necessary” if there is no other way it can be solved.
Your fit of some slightly quadratic time series by an affine mapping does not at all establish uniqueness of the solution.
“Yes, I discussed the Vostok and theoretical change in CO2 as the ocean warms, and showed that it is not sufficient to explain the rise in CO2.”
You haven’t even bothered to read up on my model, have you?
I’m now quite unconvinced by the exponential plot Fig 1. The first issue is that it is a hybrid of a number of results. But I’ve been trying to track its provenance.
Prof P refers to a paper by Svetlik. I couldn’t find the paper, but I did find this well presented poster. I looked at the corresponding figure, and it didn’t look very exponential. Then I tracked down this page by someone who seems to be a co-author. They did a closer study of the later section and said:
“As seen from FIG. 1, 1963, the activity of radiocarbon begins to decrease approximately exponentially. In the 80s of the last century decline is slowing and around the early 90s is now stable with approximately linear relationship (see Fig. 2). “
and they show regressions.
But the poster also noted other concerns. As I mentioned above, what Prof P has plotted is actually from a C14/C ratio. If it goes to zero, that means the ratio is back to where it was in 1950. But there are several reasons to not expect it to return:
1. the amount of C14 added was a lot. It doubled atmospheric. The sinks are finite. C14 will be permamently raised.
2. However, we’ve also been adding C free of C14. This increases the denominator in the ratio, by a larger amount. So the ratio will actually go to a lower value than 1950, except…
3. there’s a third effect that they call the Seuss effect. Like Beck, they are sampling in places where there is an excess of CO2 from nearby human activity, and also a daily fluctuation with photosynthesis. This again affects the ratio, and may be the biggest issue. And there’s no reason to expect that has remained stable since 1950. They plot short-term fluctuations at some of the sites. It’s large and you can see diurnal patterns etc.
I’m very dubious. If it isn’t exponential, there isn’t a single decay time. It depends on where you look. And if it doesn’t decay at all…
Svetlik’s poster is here.
Sorry, here.
Not doing well today. New editor, need to learn it better. Svetlik’s poster.
Bart says:
November 25, 2013 at 5:34 pm
Well, since I didn’t say “bomb test” anywhere, I’ll let you figure that out.
So in your world of snar, a successful fit is “superficial”?
You’re all mouth and no math, Bart. You’ve not shown any other fit to the historical data over the last hundred years. My fit is to a well established model, that of exponential decay. How on earth is exponential decay “superficial”? Many natural processes are well modeled using exponential decay … does your sneering apply to all of those other processes as well?
Put up the math for your more successful fit to the last hundred years of CO2 increase, Bart, before you start getting all snarky about my math …
w.
Willis Eschenbach says:
November 25, 2013 at 10:34 pm
“So in your world of snar, a successful fit is “superficial”? “
I’ve explained why it is superficial. Either you didn’t understand it, or you didn’t read it. Given the pronounced and often bizarre disconnect typical between what I write and you respond, I suspect the latter.
“My fit is to a well established model, that of exponential decay.”
The plot here is of exponential decay?
I think you mean it is a single lag smoothed accumulation of emissions. Big deal. You have two slightly quadratic time series. The odds of fitting them reasonably well with an affine mapping are essentially the odds of them having the same curvature – 50/50. A coiin toss.
But, the model of emissions driving atmospheric CO2 is diverging from its superficial similarity. In the last decade, the rate of change of atmospheric concentration has become effectively constant, while the rate of change of emissions has continued increasing. You can even see the incipient divergence in your plot, and you don’t even carry it out to the present day.
“So in your world of snar, a successful fit is “superficial”?
It’s a lousy fit. Bring it up to date, and try a numerical differention, and show me how well it fits then.
“You’ve not shown any other fit to the historical data over the last hundred years.”
Yes, I have. You’ve just studiously ignored it.
Look at what I have written and study it, and you will learn.
Or, plow your head back into the sand, and ignore anything you don’t find convivial. I don’t really give a rodent’s derriere. But, don’t expect me, at least, to take you seriously when you get up on your pompous soapbox and ignore anything anyone else tries to show you.
Willis Eschenbach says:
November 25, 2013 at 10:34 pm
Willis, I have had several rounds of discussion with Bart, still going strong each time again.
According to Bart (and Salby), the increase in the atmosphere is caused by a sustained increase in temperature above an arbitrary baseline. That is because the short term variability of T perfectly matches the short term variability of dCO2/dt. From that point, Bart and Salby integrates T with some offset and factor, which matches the increase of CO2 in the atmosphere.
But that gives a lot of problems:
– that means that for a small sustained increase in temperature, CO2 (from the oceans) continuous to be released at a near constant rate with a continuous increase in the atmosphere as result. Without any effect from the increase of CO2 levels in the atmosphere on the input and output fluxes.
– the continuous increase has no measurable effect on turnover time, isotopic composition (13C/12C and 14C/12C ratio’s).
– to dwarf the human emissions, the increased turnover (total sinks still ~4.5 GtC/yr larger than total sources) must mimic human emissions at exact the same timing and increase rate, thus increasing the turnover a threefold in the period 1960-2012, and thus reducing the residence time a threefold.
– that means an increase of ~150 GtC in/out over a year for natural releases/uptake in 1960 to ~450 GtC now, or if it comes from the deep oceans only a sevenfold increase in turnover for that reservoir, again without affecting isotopic composition of the atmosphere or residence time estimates.
– for each different period in time, you need a different offset and factor to match the T-dCO2/dt trend. The latter gets very low over glacial-interglacial transitions and virtuall zero over the glacial periods.
Salby therefore calculates a theoretical migration of CO2 in ice cores that isn’t measured at all to fit his theory…
Further, Bart’s graph of the current increase in uptake is a little misleading. If you plot the variables with the same units then you get this:
http://www.ferdinand-engelbeen.be/klimaat/klim_img/dco2_em4.jpg
where a fixed percentage of human emissions (the “airborne fraction”) is plotted and human emissions minus the decay function of CO2 based on the pressure difference observed – temperature controlled setpoint.
And if you look at the trends of Bart’s plot then you see that the trends don’t match, thus the integral of T gives a too high CO2 level. If you try to match the trends, then the amplitude of the variability is too low.
The problem is in the scale factor: the amplitude is not changed by integrating T or dT/dt, but it changes with the difference in slopes between T and dCO2/dt. Thus there is a fundamental error by combining the variability and the trend of T.
Regards,
Ferdinand
Bart, you’ve commented above on your model. I’d read it before, but this time at your urging I took a closer look. Here’s the problem that I see. You say:
Actually, you’ve postulated a curious system. Not only does an increase in temperatures produce an increase in CO2, as you say. The problem is that a constant temperature also produces an increase in CO2 …
In your formula above, let us assume that the temperature T is a constant, and that T > Teq. In that case, since both K and Teq are also constants, then dCO2/dt will also be constant, and will be greater than zero. In other words,
dCO2/dt = C
The problem is that if we integrate your equation for the situation of a constant temperature > Teq, we get
CO2 = C t
And that means that with a constant temperature, as time goes on and on the amount of CO2 in the atmosphere will increase without limit … which seems very doubtful.
What am I missing here?
w.
Bart says:
November 26, 2013 at 4:12 am
Here’s the plot again …

Indeed the plot shows exponential decay. There is no smoothing, nor is there any lag. The total amount present in the atmosphere at any instant is subject to simple exponential decay, as the CO2 is sequestered at the surface in a whole variety of ways. To that each year is added the new emissions. The result is the curve shown in black above. In other words, yes, the plot shows the very simplest, single-time-constant exponential decay.
w.
Mr. Eschenbach:
I’m not adept at accessing data sets, and I was wondering whether the the data you based that graph on are handy. (I did try a link in a previous post of yours, but it was broken.)
– – – – – – – –
Willis Eschenbach,
I intended an ironic paradox by contrasting the Feynman ideas with your necessary and sufficient categorization of attribution of modern CO2 increase. Your certainty seemed too much without any caveat, quid pro quo, proviso, or exception.
I see that I have seriously miscalculated my ‘ironic paradox’. I was insufficiently civil and unnecessarily insensitive. I apologize for that.
My intention was not to say you lacked integrity in any way in your comment (November 25, 2013 at 10:31 am). I was trying in a witty way to draw out your skeptical ‘caveats, quid pro quos, provisos, or exceptions’ of your necessary and sufficient. It was my misjudgment to try to do it the way I did.
{Note: To me ‘necessary and sufficient’ is the strongest epistemological evaluation a human can make with his capacity of reason.}
John
@ferdinand meeus Engelbeen and Ian W
Ian sez, “It should of course be noted that the surface area of the oceans is actually dwarfed by the surface area of cloud water droplets which are both cold and when they form CO2 free. By Henry’s law these droplets will take up a lot of CO2.”
Ian is correct.
Ferdinand sez, “Rain is fresh water, fresh water will contain very little CO2 at a pressure of 0.0004 bar, which mostly was released from the same warm oceans where water vapour was entering the atmosphere. ”
Ferdinand is correct in that fresh water would contain very little CO2 at a pressure of 0.0004 bar but the pressure is 1.0 bar. The chart presented at http://www.engineeringtoolbox.com/gases-solubility-water-d_1148.html again referenced.
So when water droplets form they remove CO2 (rapidly) from of the atmosphere. Rain that falls into the ocean or sinks into the ground maintains this concentration until it is either heated or frozen.
Ice particle clouds of course contain no CO2. In winter water freezes and expels all the CO2 into the atmosphere. I have not been able to find a figure for the mass of all the fresh water that freezes in the NH winter: however for each cubic metre of water frozen, 3 kg of CO2 is emitted. For sea ice it is the same because sea ice is frozen fresh water, not frozen salt water.
If the NH sea ice is 1 m thick on average and everything else north of 50 degrees freezes to the conservative average depth equivalent to 0.1 m of water (Siberia is 20x that), there would be:
(15m km^2 x1/1000 + 76m km^2 x 0.1/1000 x 3/1000 mass fraction that is CO2) = 68 gigatons of CO2 released from water into the atmosphere during NH winter.
It only takes 38 gigatons to change the atmospheric concentration of CO2 by 5 ppm (the seasonal variation) so the cooling oceans must be absorbing some of it. In summer the snow and ice melts, absorbing all 68 gigatons of CO2 again and the oceans give it back.
If CO2 has a strong net forcing, the only possible conclusion would be that Winter is a major cause of global warming and summer is a major cause of cooling.
To reduce the atmospheric concentration of CO2 to 350 ppm will require the melting of 130,000 cu km of ice – a small fraction of the ice on Greenland.
Crispin in Waterloo but really in Ulaanbaatar says:
November 26, 2013 at 4:31 pm
Ferdinand is correct in that fresh water would contain very little CO2 at a pressure of 0.0004 bar but the pressure is 1.0 bar
Crispin, the atmospheric pressure is 1 bar (or less at height), but the solubility of CO2 in water only applies to the partial pressure caused by CO2 itself (per Henry’s law), not to the other constituents of the atmosphere… Thus you have to multiply all your figures with 0.0004 bar for CO2, which makes that the total circulation still is huge (because of the huge mass of water circulating through the atmosphere), but the change in local levels is negligible.
I don´t know if anyone mentioned it, but there is a minor flaw in Pettersons calculations. One of the swedish alarmist blogs have spotted it, you an read about it here:
http://uppsalainitiativet.blogspot.se/2013/11/monckton-propagates-petterssons-bomb.html
@ferdinand meeus
Read Henry’s Law again. I see the slip you made and I was impressed at how clever it was but I for one and not fooled as this is my bread and butter.
I think your are quite intelligent enough to do this, meaning that I don’t think you are unaware that CO2 absorption in water is other than 3 g /litre as per the link you provided yourself! You are introducing a figure from the micro-atmosphere side (being the volumetric fraction of the atmosphere) and trying to pass that off as the ‘pressure’ to apply to the amount of CO2 that will be absorbed but water. The pressure at sea level is 1 bar, and yes, about 0.0004 of that is provided by the CO2 component of the atmosphere. The other 0.9996 is provided by other components and all of it acts on the CO2.
You will probably get traction on other channels with that sleight of hand but not WUWT. The mass of CO2 that is absorbed in a litre of fresh water at 5 Degrees C at a pressure of 1 bar is 3 g, or if you prefer, 1127 ppm(v). Deal with it.
There are two grand themes missing from the CAGW science: there is not nearly enough carbon based fuels to take the atmospheric concentration above about 540 ppm, and if Antarctica were to melt completely it would strip the entire atmosphere of CO2 and we would be begging the oceans to yield its treasure.
http://www.john-daly.com/co2-conc/ahl-co2.htm is pretty good, but still ignores the fact that it rains on this planet.
John Whitman says:
November 26, 2013 at 4:19 pm
As precipitously as your stock fell, it has risen again. You are indeed a gentleman, sir.
w.
Crispin in Waterloo but really in Ulaanbaatar says:
November 27, 2013 at 6:40 am
Read Henry’s Law again.
Well, here it is:
http://dictionary.sensagent.com/Henry's%20law/en-en/
At a constant temperature, the amount of a given gas that dissolves in a given type and volume of liquid is directly proportional to the partial pressure of that gas in equilibrium with that liquid.
The total pressure of the atmosphere is 1 bar.
The partial pressure of nitrogen is 0.79 bar
The partial pressure of oxygen is 0.21 bar
the partial pressure of CO2 is 0.0004 bar
The solubility of O2, N2 and CO2 each is for their own partial pressure in the atmosphere per Henry’s law…
Ferdinand,
What happened to Argon?
The partial pressure of argon is ≈.01 bar, no?
It appears that this page has not yet been abandoned, so I guess I should admit another error I made above. It doesn’t affect anything else, but I noticed last night that I had misstated the way in which the Pettersson system responds to a step increase in added emissions. (I think) I’ll correct that here, and I’ll show my sums so that no one will be tempted to take my word for the replacement relationship. exhibits in response to a step in emissions, we restate the relative-“concentration” relationship in terms of
  instead of
  , and we drop the assumption that no change is occurring in the variable
  , i.e., in the mass representing all the carbon-cycle carbon (but not the carbon held hors de combat in, e.g., petroleum or coal). That is, we state that the rate at which the first-reservoir-content’s mass
  changes equals the sum of (1) a quantity proportional to the difference
  between the reservoirs’ concentrations and (2) the rate
  at which mass is added to the system (representing the rate at which carbon previously imprisoned in coal or petroleum is added to the cycle of life):

 and a constant-stimulus-gain value
  :
:
 is given by:

 is the unit impulse, i.e., a function that equals zero for
  and whose integral over any interval that includes
  is unity.
 to
to  by convolving
  with that impulse response:

 caused by the human-emissions-rate unit step that occurs at time
  .
. corresponding to all the carbon currently participating in the carbon cycle we’ll take as our stimulus a function
  , i.e., a unit ramp. Plugging that as well as the above-determined function for the impulse response into the above convolution equation yields the following equation for the difference
  between what
  is and what it would have been in the absence of the emissions step:
![m'_1(t)=\int\limits_{0}^{t} \left[ \delta(\zeta-t)- (\lambda-1)e^{(\zeta-t)/\tau}\right]\zeta d\zeta=\lambda t+(1-\lambda)(\tau)(1-e^{-t/\tau}).](https://s0.wp.com/latex.php?latex=m%27_1%28t%29%3D%5Cint%5Climits_%7B0%7D%5E%7Bt%7D+%5Cleft%5B+%5Cdelta%28%5Czeta-t%29-+%28%5Clambda-1%29e%5E%7B%28%5Czeta-t%29%2F%5Ctau%7D%5Cright%5D%5Czeta+d%5Czeta%3D%5Clambda+t%2B%281-%5Clambda%29%28%5Ctau%29%281-e%5E%7B-t%2F%5Ctau%7D%29.&bg=ffffff&fg=000&s=0&c=20201002)
 ‘s response to an additional-emissions rate
  exhibits a slope that initially equals unity but decays to the constant-
 gain
gain  .
. requires a special accommodation for its Dirac delta function. Although the accommodation is trivial, that impulse response additionally suffers from a lack of intuitive appeal. More straightforward would be to convolve
  with the impulse response’s integral, i.e., with:

 I’m implying–incorrectly–that all anthropogenic emissions come from outside the existing carbon cycle. But I don’t think that matters much at this model’s level.)
 go directly into the first reservoir (and thus implicitly directing the remainder directly into the second).
To calculate the behavior that the atmospheric-carbon-mass-representing variable
Rearranging that equation gives us the following:
Into this equation we substitute a time-constant value
This defines a system whose impulse response
where
Now, we can obtain the response of
That tells us that the current response depends on the entire stimulus history since the beginning of time. But we’re interested only in the response component
So in place of the value
Contrary to what my last comment said, that is,
By the way, the reason I detected the error is that I returned to my above comment last night as I was thinking that if I find some numbers to use I may attempt a numerical solution. In that connection I’ll mention that numerically convolving the above impulse response with
(By calling that quantity
As another aside I’ll mention that if I use this version of Pettersson’s model I may modify it to reflect the “missing sinks” by making only a portion of the added