 (Perturbation Calculations of Ocean Surface Temperatures.)
Guest essay by Stan Robertson, Ph.D., P.E.
1. Introduction
It is generally conceded that the earth has warmed a bit over the last century, but it is not clear what has caused it, nor whether it will continue and become a problem for humanity. There is a possibility that some of the warming has been caused by anthropogenic greenhouse gases, but it is also likely that the sun has been partially responsible. The arguments that are advanced to say that humans caused it and that it will become a serious problem rely on models that have not been validated and positive feedback effects that have not been shown to exist, at least at the hypothesized levels of effectiveness. The apparent weakness in the argument that the sun has been a major contributor is that satellite measurements of Total Solar Irradiance (TSI) have not shown changes large enough to have directly produced the warming of the earth over the last half century. But what about indirect effects? Is it possible that the sun exerts control in some indirect way? In these notes I recapitulate the evidence that this is the case by showing that the variations of TSI cannot provide the energy that is necessary to account for the warming of the oceans during solar cycles.
TSI, as measured above the earth’s atmosphere varies by about 1.2 watt/m2 over a nominal eleven year solar cycle (h/t Leif Svaalgard) primarily at wavelengths shorter than 2 micron. The dominant harmonic variation of TSI would thus have an amplitude half this large, or about 0.6 watt/m2. About 70% of this enters the earth atmosphere. Averaged over latitudes and day/night cycles, about one fourth of this 70%, or ~0.11 watt/m2, on average, enters the upper atmosphere. Since only about 160 watt/m2 of 1365 watt/m2 of incoming solar radiation at wavelengths less than 2 micron reaches the earth surface, the amplitude of short wavelength TSI reaching the earth surface would be only (160/1365)x0.6 = 0.07 watt/m2. However, about half of the difference between 0.11 and 0.07 watt/m2 eventually reaches the earth surface as scattered thermal infrared radiation at wavelengths greater than 2 micron. Thus the average amplitude of TSI reaching the earth surface in all wavelengths would be about 0.09 watt/m2. So the question is, just how much sea surface temperature variation can this produce?
Several researchers, including Nir Shaviv (2008), Roy Spencer (see http://www.drroyspencer.com/2010/06/low-climate-sensitivity-estimated-from-the-11-year-cycle-in-total-solar-irradiance/) and Zhou & Tung (2010) have found that ocean surface temperatures oscillate with an amplitude of about 0.04 – 0.05 oC during a solar cycle. (In fact, all of the ideas that I am presenting here were covered in Shaviv’s work, but it has not gotten the attention that it deserves.) Using 150 years of sea surface temperature data, Zhou & Tung found 0.085 oC warming for each watt/m2 of increase of TSI over a solar cycle. Although not strictly sinusoidal, the temperature variations can be approximately described in terms of a dominant sinusoidal component of variation with an 11 year period. Thus the question to be answered at this point is, can 0.09 watt/m2 amplitude of variation of TSI entering the oceans produce temperature oscillations with an amplitude of 0.04 – 0.05 oC?
The answer to this question depends on the average thermal diffusivity of the upper oceans. That is an unknown, but not unknowable, quantity. Thermal diffusivity is the ratio of thermal conductivity to heat capacity. The upper 25 to 100 meters of oceans are well mixed by waves and shears. These are mixing zones with high thermal diffusivity and correspondingly small temperature gradients. Diffusivities are lower at greater depths. Bryan (1987) has found that thermal diffusivities ranging from 0.3 to 5 cm2/s are needed to account for the temperature profiles below the mixing zone. In my first trial calculations of the energy flux necessary to account for the temperature variations, I tried values of thermal diffusivity in the range 0.1 – 10 cm2/s and found that the TSI variations were generally inadequate to produce the sea temperature variations over a solar cycle. But there was wide variation of calculated energy flux. Larger values of thermal diffusivity required more heat because more was able to penetrate to the depths, but even for 0.1 cm2/s, the required input was double the TSI variations that reach the earth surface. Fortunately, there is a way to constrain both the value of the thermal diffusivity and the heat input. It consists of first matching the measured trends of surface temperatures and ocean heat content over time. Measurements of these were reported by Levitus et al. (2012) and are available from http://www.nodc.noaa.gov/OC5/3M_HEAT_CONTENT/ .
In the calculations described below, I have used the data from 1965 to 2012 for ocean depths to 700 meters. Sea surface temperatures and ocean heat content began to increase after 1965. Only about a third of the increase of heat content occurred at depths below 700 meter. Since little heat migrates below this depth over 11 year solar cycles, it is preferable to use the 0 – 700 m data for the purpose of calibrating the thermal diffusivity
2. Heat Transfer Perturbation Calculations
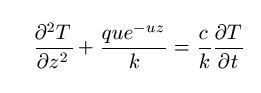
For the calculation of sea surface temperature and sea level changes, we can treat the variations of radiations entering and leaving atmosphere, lands and oceans as minor perturbations on an earth essentially in thermal equilibrium. Ocean mixing zones, thermoclines and other features of the temperature profiles remain largely as they were while small radiant disturbances produce minor variations of temperature starting from zero, and imposed at each depth. Thus the effects of these disturbances can be modeled as one-dimensional energy flows into a medium at uniform temperature. Such “perturbation calculations” are among the most powerful analysis techniques used by physicists and engineers and are widely used. The energy equation to be solved in this case is:
http://i1244.photobucket.com/albums/gg580/stanrobertson/equation_zpscea297ad.jpg

Where T is the temperature departure from equilibrium at depth , z, and time, t. q is a perturbing radiant flux entering the surface, u the absorption coefficient, c is absorber heat capacity and k its thermal conductivity. The rate of heat transfer by conduction processes is controlled by the thermal diffusivity, which is the ratio k/c.
As a one dimensional heat flow problem, it is straightforward undergraduate level physics or engineering to numerically solve the equation above for the expected changes of surface temperature as surface radiant flux varies. In my calculations, temperature changes were calculated for 1.0 meter increments of depth in the oceans. Two cases were considered. In one
case the surface radiation perturbation was assumed to increase linearly with time. This corresponds to the ocean conditions for the period 1965-2012. In the second case, it was assumed to vary as a cosine function of time with the 11 year period of the solar cycle. The cosine function provides both some positive and some negative variation in the first half cycle, which helps to minimize the transients of the first few years.
I treated q and thermal diffusivity, (k/c), as input parameters that were chosen to provide agreement with the observed sea surface temperature variations and ocean heat content measurements (https://www.ncdc.noaa.gov/ersst/ ). The absorption coefficient, u, was entered in piecewise fashion. Only the deep UV radiations penetrate to depths below 10 meter, but conduction takes energy to much greater depths. For the values of u chosen, only 44.5% of the surface energy flux goes deeper than 1 meter, 22.5% below 10 meter and 0.53% to 100 meter (h/t Leif Svalgaard). Thermal diffusivity of oceans was assumed to be 0.3 cm2/s below 300 m. This accords with Bryan’s estimates below the mixing zone, but little change of results occurred for values as low as 0.1 cm2/s. The required heat inputs are relativity insensitive to the thermal diffusivity below 300 meter. For the shallower depths, thermal diffusivity was varied until trends in accord with observed temperatures and heat content were produced.
It is necessary to maintain an energy balance at the sea surface in approximate equilibrium with the incoming solar radiation. As estimated by Trenberth, Fasullo and Kiehl (2009), about 160 watt/m2 enters the surface, on average. At a mean temperature of 288 oK, the sea surface will emit about 390 watt/m2 of surface thermal infrared radiation at wavelengths longer than about 2 micron, however, about 84% of that is returned as back scattered radiation. The rest of the energy balance is provided by evaporation and thermal convection, which remove about 59% of the heat from the surface. From the standpoint of merely wanting to know how much heat is required to change the ocean surface temperature, it is possible to maintain a proper energy balance without delving into the messy details of evaporation, convection and infrared absorption in the first few millimeters of water. The temperature variations at one meter depth will not be measurably different from those at the surface for the thermal diffusivities of interest here. If we merely want to know what net energy flux entering the surface is required to make the water temperature at one meter depth oscillate with an amplitude of 0.04 – 0.05 oC , then all we need to do is account for the outgoing surface infrared emission and let 41% (160 watt/m2 / 390 watt/m2 = 0.41) escape. At the present 288 oK, the earth radiates an additional 5.42 watt/m2 for each 1 oC increase of surface temperature. In the case of surface temperature being perturbed by 0.04 oC, an outgoing additional 0.22 watt/m2 would be generated and 0.09 watt/m2 was allowed to escape. This nicely balances the amplitude of TSI variations that reach the earth’s surface.
3. Linear heating:
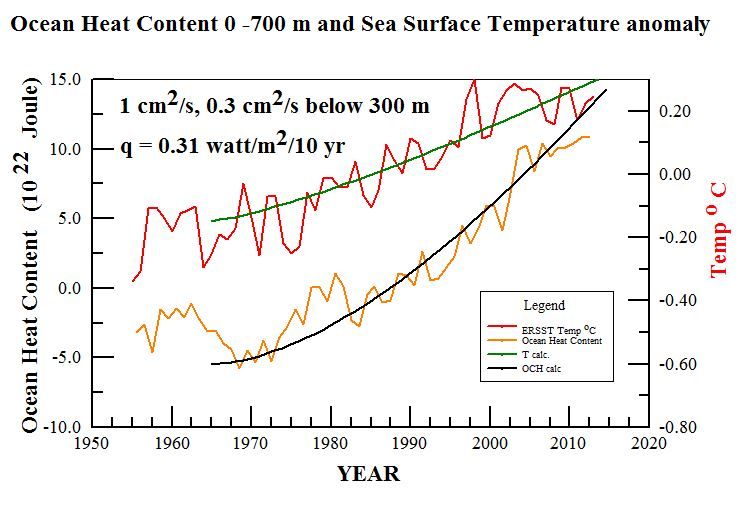
In these calculations, the aim was to find the heat input and thermal diffusivities necessary to account for the observed surface temperature increase (http://www.nodc.noaa.gov/OC5/3M_HEAT_CONTENT/ )Extended Reconstructed Sea Surface Temperature) and the increased ocean heat content (OHC 700) that have been reported by NOAA. Since surface temperatures had not been increasing in the early 1960s, but began to increase in the last half of that decade, I chose to start calculations with linearly increasing heating in 1965. I found that the ocean heat content to a depth of 700 meters was quite sensitive to the thermal diffusivity used. The best results that I have been able to obtain were for a thermal diffusivity of 1 cm2/s to 300 meter depth and surface heat input increasing at a rate of 0.31 watt/m2 per decade. These are shown on the graph below with calculated trends shown by the green and black lines. On a time scale of 50 years, most of the heat accumulates at relatively shallow depths. To better reflect a realistic thermal diffusivity for greater depths, I used a lower value of 0.3 cm2/s below 300 meter. That has little practical effect on a 50 year times scale, but would be necessary if one wanted to extend the calculations for several centuries while surface heating perturbations had time to penetrate to much greater depths.
http://i1244.photobucket.com/albums/gg580/stanrobertson/OHC700_zpsb9e34e91.jpg

Figure 1. Ocean heat content 0 – 700 meter and surface temperature trends according to NOAA. Blue and green lines show trends calculated for the parameters shown.
These calculations establish some parameters that do a good job of representing the thermal behavior of the upper oceans, however, if one looks closely at the data trends in the graph, it is apparent that both surface temperature and ocean heat content have considerably slowed their rates of increase in the last decade. This makes it unlikely that greenhouse gases are the cause of the rate of heating needed to explain the previous trends because their effects should have become enhanced rather than diminished. It might also be noted that a similar warming trend occurred in the first half of the previous century before anthropogenic greenhouse gases could have contributed significantly. Thus it is more likely that both warming periods had natural origins.
Obtaining simultaneous fits to the ocean heat content and sea surface temperature trends with only two free parameters, thermal diffusivity and surface heating rate, is quite confining. Acceptable, but noticeably worse, fits than shown above, were obtained with thermal diffusivities ranging from 0.8 to 1.2 cm2/s and heat inputs ranging from 0.29 to 0.33 watt/m2. Based on previous calculations for sea level data, I was initially inclined to think that larger thermal diffusivities would be necessary, but larger values let more heat penetrate to greater depths than the amounts of heat reported by Levitus et al. In addition, I was chagrined to learn that most of the variation of sea level that accompanies solar cycles is caused by evaporation rather than thermal expansion.
Solar Cycles:
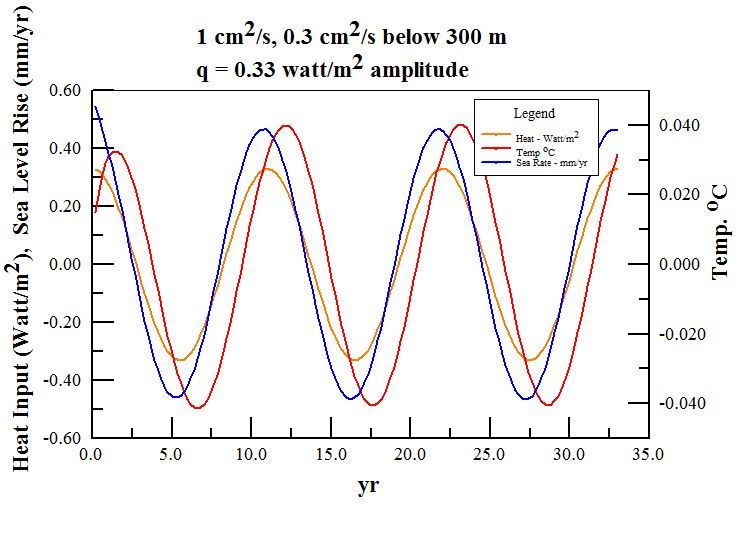
The process of choosing thermal diffusivity and surface heating rates to accord with observations provides a sound basis for calculating what to expect for the temperature variations during solar cycles. In this case we can use the thermal diffusivity of 1 cm2/s that is required of the ocean heat content results as an input parameter and choose the heat input that is required to produce temperature variations of 0.04 – 0.05 oC amplitude. Producing sea surface temperature variations with an amplitude of 0.04 oC requires a surface heat input of 0.33 watt/m2, as shown below:
http://i1244.photobucket.com/albums/gg580/stanrobertson/solarcycle10_zpsa3b8b0ee.jpg

Figure 2. Radiant flux, ocean temperature oscillations, and sea level variations for three solar cycles of eleven years each. The entering flux shown here is the value of q = 0.33 watt/m2 needed to drive the variations of surface temperature of 0.04 oC with ocean thermal diffusivity of 1.0 cm2/s to depth of 300 m. The amplitude of thermosteric rate of change of sea level was 0.47 mm/yr. Temperature lags the driving energy flux by 15 months. The thermal expansion coefficient of sea water used here was 2.4×10⁻⁴/ oC.
I believe that this settles the issue of what is required to produce sea surface temperature oscillations with an amplitude of 0.04 oC. The solar TSI variations that reach the earth’s surface are smaller than the 0.33 watt/m2 needed to account for sea surface temperature variations by a factor of 3.6 for this smallest estimate of sea surface temperature variability.
Although the estimated 0.33 watt/m2 that is required to explain the surface temperature variations is large compared to the amplitude of TSI variations that reach the surface, it is still only about two parts per thousand of the 160 watt/m2 of solar UV/VIS/NIR that reaches the earth surface. There are many possible ways in which the sun might modulate the surface energy flux to this extent. These include modulation of cloud cover and small spectral shifts in the energetic UV that might modulate ozone absorption or produce shifts of the effective sea surface albedo. It would seem to be a fairly direct radiative effect, rather than feedback, since it must vary in phase with the solar cycle.
In summary, my calculations based on energy conservation considerations imply that the sun modulates the ocean temperatures to a much greater extent than can be provided solely by its TSI variations. The great question that desperately needs an answer is how does it do it? It should be easily understood that solar effects would not necessarily be confined to cycles. More likely, the sun has been the driver of the large changes of temperatures of the Roman and Medieval warm period, the Little Ice Age, and the recent recovery from it without requiring large changes of its own irradiance. When we understand how the sun does this, we will have begun to understand the earthly climate.
###
Biographical note:
Stan Robertson, Ph.D, P.E, retired in 2004 after teaching physics at Southwestern Oklahoma State University for 14 years. In addition to teaching at three other universities over the years, he has maintained a consulting engineering practice for 30 years.
References:
Bryan, F., 1987: Parameter Sensitivity of Primitive Equation Ocean General Circulation Models. Journal of Physical Oceanography, 17, 970-985. (PDF available here http://journals.ametsoc.org/doi/abs/10.1175/1520-0485%281987%29017%3C0970%3APSOPEO%3E2.0.CO%3B2
Levitus, S. et al., 2012 World ocean heat content and thermosteric sea level change (0–2000 m), 1955–2010, Geophysical Research Letters, 39, L10603, doi:10.1029/2012GL051106, 2012 http://onlinelibrary.wiley.com/doi/10.1029/2012GL051106/abstract
Shaviv, Nir 2008, Using the oceans as a calorimeter to quantify the solar radiative forcing, Journal of Geophysical Research, 113, A11101 http://www.sciencebits.com/files/articles/CalorimeterFinal.pdf
Trenberth, K., Fasullo, J., Kiehl, J. 2009: Earth’s Global Energy Budget. Bull. Amer. Meteor. Soc., 90, 311–323. doi: http://dx.doi.org/10.1175/2008BAMS2634.1 www.cgd.ucar.edu/staff/trenbert/trenberth.papers/TFK_bams09.pdf , Fig. 1
Zhou, J. and Tung, K. ,2010 Solar Cycles in 150 Years of Global Sea Surface Temperature Data, Journal of Climate 23, 3234-3248 http://journals.ametsoc.org/doi/abs/10.1175/2010JCLI3232.1
John Day says:
October 11, 2013 at 7:21 am
The Earth’s magnetic field acts a shield to protect us from the ravages of solar wind. Else our atmosphere (and climate) would have been stripped away eons ago.
===========
yet we are told that the solar wind has very little energy. are we to thus conclude that something that can strip the atmosphere from a planet cannot alter the climate?
the earth’s magnetic field only partially shields us from the solar wind. the solar wind enters the earth’s atmosphere at the poles. like an ionizing air cleaner, the charged particles in the solar wind affect the composition of the atmosphere, changing the chemistry of the atmosphere, changing the weather and thus the changing the climate.
Dr. Isvalgaard,
I read the two papers you gave me. The Laken paper is very strange to me, it appears that it is written to specifically refute Svensmark 2012. The language appears to be more an essay than a scientific paper calling Svensmarks theory controversial and concluding:
“By virtue of a lack of strong evidence detected from the numerous satellite- and ground-based studies, it is clear that if a solar- cloud link exists the effects are likely to be low amplitude and could not have contributed appreciably to recent anthropo- genic climate changes.”
Laken et al partly base their conclusions based off temperature and small cosmic ray fluctuations having little correlation but seem to be far less critical of their own priori of an anthropogenic connection which has even less correlation over the same sattelite period. I am also unimpressed by evidence submitted that models do not show the cosmic ray effect.
The conclusion that I drew from that paper was that large fluctuations showed correlation but the correlation of smaller fluctuations is difficult to detect because of small sample sizes leading to statistical insignificance and satellite data could have problems at the poles and with line of sight detection. It seemed to me that more data would be needed to reject or confirm Svensmark’s hypothesis and I think dismissing it based on difficulties gathering cloud data is a strange conclusion.
Maybe I’m being to skeptical here but based on the actions of many in the climate community to accept papers like MBH98 uncritically and attack people who showed it was incorrect I am very cautious to take any paper at face value especially when it appears to be specifically written to support the “anthropogenic connection” which was not even discussed in the paper outside of the conclusions.
I don’t disagree with the second paper but I’m interested in seeing Svensmark’s theory on ionization effecting cloud feedbacks further investigated before I think you could calculate where, when and how much the effects may be.
@berple>something that can strip the atmosphere from a planet cannot alter the climate?
Without its magnetic field, Earth’s climate would be somewhat like Mars. But Earth has a magnetic field, so that’s a moot point. The solar wind seems to have no big impact on climate.
What about little impacts? Well, there was a paper presented on WUWT a day or so ago, that claimed that changes in the By component of the IMF (which is carried by the solar wind) produced some measurable climatic artifact. Let’s assume it’s true, how will that impact life on Earth?
I’m not denying that could be significant impact from phenomena like this, but what are they?
So you shouldn’t worry about until it has been observed, or someone has reliably predicted its consequences.
“John Day says:
October 11, 2013 at 8:00 am”
The Sun will, eventually, consume this rock, magnetic field or not!
shenanigans24 says:
October 11, 2013 at 7:39 am
Wonderful well thought out reply.
New paper published yesterday by Leif’s friend Judith Lean finds the difference in TSI measured during the 1990s by solar radiometers vs. with SORCE could alone account for 0.4C temperature change, without any amplification or consideration of 2nd order effects. But, no problem, all we have to do is change the cloud cover in our models to make it all balance out on a global basis… Hold on, that changes regional climate simulations…
The Impact of Different Absolute Solar Irradiance Values on Current Climate Model Simulations
http://journals.ametsoc.org/doi/abs/10.1175/JCLI-D-13-00136.1?af=R
Simulations of the pre-industrial and doubled CO2 climates are made with the GISS GCMAM using two different estimates of the absolute solar irradiance value, a higher value measured by solar radiometers in the 1990s and the lower value measured recently by SORCE. Each of the model simulations is adjusted to achieve global energy balance; without this adjustment the difference in irradiance produces a global temperature change of 0.4°C, comparable to the cooling estimated for the Maunder Minimum. The results indicate that by altering cloud cover the model properly compensates for the different absolute solar irradiance values on a global level when simulating both the pre-industrial and doubled CO2 climates. On a regional level, the pre-industrial climate simulations and the patterns of change with doubled CO2 concentrations are again remarkably similar, but there are some differences. Using a higher absolute solar irradiance value and the requisite cloud cover affects the model’s depictions of high latitude surface air temperature, sea level pressure, and stratospheric ozone, as well as tropical precipitation. In the climate change experiments it leads to an underestimation of North Atlantic warming, reduced precipitation in the tropical Western Pacific, and smaller total ozone growth at high northern latitudes. Although significant, these differences are typically modest compared with the magnitude of the regional changes expected for doubled greenhouse gas concentrations. Nevertheless, the model simulations demonstrate that achieving the highest possible fidelity when simulating regional climate change requires that climate models use as input the most accurate (lower) solar irradiance value.
Earth’s wobbles known as Milankovitch cycles, occur on time scales of between 20,000 and 100,000 years.
Neptune and Uranus affect solar activity in Solar Grand Minima as well as Solar Cycle Modulation.
Tectonic activity and variation in earth radius affects rotational velocity.
GCR volume affects cloud cover.
Variations in Circumpolar Vortex.
…and the sun.
John Day says:
October 11, 2013 at 7:21 am
I’m not sure if our atmosphere would have been totally stripped away without a magnetosphere generated from within the planet, or be as tenuous as Mars’.
Venus has an atmosphere an order of magnitude denser than ours, despite lack of an internal magnetosphere. The solar wind does induce one in the planet’s ionosphere, as it strips away the top of the atmosphere there:
http://www-ssc.igpp.ucla.edu/personnel/russell/papers/venus_mag/
Mars of course serves as a counter-example in support of your hypothesis. Its wispy atmosphere (an order of magnitude thinner than ours) would probably be thicker if the Red Planet had an internal magnetosphere.
I agree that Earth’s magnetosphere has been very important to conditions here, including the development of life, but wonder why Venus’ atmosphere remains so dense after four billion years. Earth has apparently lost about half its original N2 over the eons, but probably more from its incorporation into the crust rather than leakage or stripping away into space.
lsvalgaard says:
October 10, 2013 at 4:30 pm
Louis says:
October 10, 2013 at 4:20 pm
How good are we at measuring total TSI?
VERY good: We can measure variations in TSI with a precision of 0.007 W/m2 out of 1361 W/m2 or as 10 feet on the distance between San Francisco and Los Angeles.
————————-
Precision is not the same thing as accuracy. Precision means ‘Repeatability’ while Accuracy is a measure of closeness to the true value. So all results could be within 10 feet of each other but your error might be many miles. If you are claiming an accuracy of 0.007W in a measurement of 1361W then you are saying that the accuracy is 0.0005%. Now, maybe this is so but it means that your calibrating system has an accuracy of at least 3 times this (some people prefer 10 times), i.e. 0.00016%? Maybe this is possible, I don’t know the specs of the particular system but I can say that achieving and maintaining 0.005% accuracy (yes 0.005% not 0.0005%) in electronic equipment is quite challenging. How often is the equipment re-calibrated? Long term drift is a notorious issue in electronic equipment.
lsvalgaard says :
The article says that 1 W/m2 in gives you 3.6 W/m2 out [actually 0.09 and 0.33, but you should be able to figure that out on your own]. In nature you don’t permanently get something for nothing.
i do not think stan robertson,nor many others think that. but as temperature fluctuates over short and long periods of time,it is quite obvious that energy in/out imbalances exist.
lsvalgaard says:
“Up there the density is a billionth of sea-level density so there is almost no heat and hot air does not descend.”
It has a very large volume, it gets to very high temperatures, and it radiates.
How does someone write an article so little presenting what its very own sources point out? I know on the order of 99% of people don’t click on links and read, but, even so, this is disappointing.
“Shaviv, Nir 2008, Using the oceans as a calorimeter to quantify the solar radiative forcing, Journal of Geophysical Research, 113, A11101 http://www.sciencebits.com/files/articles/CalorimeterFinal.pdf”
Adding in a bit of quotation from such:
TSI variation over a typical 11 year solar cycle just corresponds to a “globally averaged irradiance variations of 0.17 W/m^2”
However, “solar cycle induced variations in low altitude cloud cover [Marsh and Svensmark, 2000b], presumably from CRF [cosmic ray flux] modulation over the oceans (where CCNs are most likely to be a bottleneck), give rise to a radiative imbalance which can be estimated [Marsh and Svensmark, 2000a; Shaviv, 2005] to be of order 1.1 ± 0.3 W/m^2 over the past two cycles.”
Notice the former, for TSI variation, is 0.17 W/m^2, but the latter is so much more.
As the author of the referenced paper, Dr. Shaviv, discusses further elsewhere, variation in near-constant TSI is less substantial than the several times larger effect of variation in cloud seeding by cosmic ray flux.
If someone spreads aluminum foil reflector over a window, its subsequent effect on heat (sunlight reflected over time afterwards) is not limited to the energy which was involved in unrolling it. Likewise, when ionizing radiation helps seed condensation nuclei, whether in a cloud chamber (invented in 1912 A.D., like http://www.lns.cornell.edu/~adf4/cloud.html ) or in the larger atmosphere, the energy of extra sunlight which can be reflected (by white clouds in the latter case) has almost nothing to do with the relatively tiny energy of the original radiation, able to differ by many orders of magnitude.
As Dr. Shaviv notes:
“One can actually quantify empirically the relation between cosmic ray flux variations and global temperature change, and estimate the solar contribution to the 20th century warming. This contribution comes out to be 0.5 +/- 0.2 C out of the observed 0.6 +/- 0.2 C global warming (Shaviv, 2005)”
http://www.sciencebits.com/CO2orSolar
Back to this WUWT article:
“Several researchers, including Nir Shaviv (2008), Roy Spencer (see http://www.drroyspencer.com/2010/06/low-climate-sensitivity-estimated-from-the-11-year-cycle-in-total-solar-irradiance/) and Zhou & Tung (2010) have found that ocean surface temperatures oscillate with an amplitude of about 0.04 – 0.05 oC during a solar cycle.
Of those three sources mentioned, at least two out of three have observed how the effect of TSI+GCR variation is several times more than TSI variation alone. The first, Dr. Shaviv, was just mentioned. The second, Dr. Spencer, did an analysis and observed, for a 2000-2010 example period:
“The cosmic ray (indirect) forcing is about 2.8 times that of the solar irradiance (direct) forcing.”
http://www.drroyspencer.com/2011/05/indirect-solar-forcing-of-climate-by-galactic-cosmic-rays-an-observational-estimate/
There’s a lot of propagandist spam and rewriting of historical data, as ironically the CAGW movement team is better at recognizing their Achilles’ Heel than most casual skeptics, due to having far more time and money given and spent. However, as illustrated in http://img176.imagevenue.com/img.php?image=81829_expanded_overview_122_424lo.jpg , there is not unexplainable mystery but rather superb explanation of the LIA, global cooling scare period, global warming period, and even the recent decline in global temperatures once properly studying real historical data (with some understanding of cosmoclimatology) rather than fudged hockey-stick type junk.
richardscourtney says:
October 10, 2013 at 4:48 pm
“external variations such as the Svensmaark Effect which may alter cloud cover (n.b. this possible effect is galactic and not solar).”
Variation in galactic cosmic ray flux received at Earth’s orbit is primarily solar modulated on timescales of years, decades, and centuries. Relative deflection (partial shielding by the inner solar system) varies in step with variation in the strength of the sun’s interplanetary magnetic field and solar wind. On longer timescales (such as millions of years), motion of the solar system around the galaxy becomes important. But, for instance, neutron count from galactic cosmic rays varies by several percent over even a few years (and up to tens of percent since the Little Ice Age), due to solar modulation.
To be blunt, that is one of the most basic aspects of understanding cosmic rays in the context of climate (and also well known for the effect on radiation hazards for space missions), so it is apparent that you are commenting without having ever read such as http://www.sciencebits.com/CosmicRaysClimate . Reading WUWT articles is no substitute for that (and not for looking at http://img176.imagevenue.com/img.php?image=81829_expanded_overview_122_424lo.jpg as well), as too much is left out, either never mentioned or mentioned haphazardly years apart in partial pieces which few would put together.
Back at the end of comments on http://wattsupwiththat.com/2013/09/04/black-carbon-soot-shrank-the-19th-century-glaciers/ , you were polite, but something which really stood out to me is that you spent time writing an entire reply apparently without even for a moment clicking on the one and only link in my post there. Nobody is obligated to read or look at anything if not having the time, but, if having the time to write comments…
“Recent variability of the solar spectral irradiance and its impact on
climate modelling”
http://www.atmos-chem-phys.net/13/3945/2013/acp-13-3945-2013.pdf
“The results of the CCM (Chemistry Climate Model) simulations, forced with the SSI (Solar spectral irradiance) solar cycle variations estimated from the NRLSSI model and from SORCE (Solar Radiation and Climate Experiment) measurements, show that the direct solar response in the stratosphere is larger for the SORCE than for the NRLSSI data. Correspondingly, larger UV forcing also leads to a larger surface response.”
“A new study very well worth reading by Ermolli et al. (2013) looks at the influence of the spectral variation of solar radiation (SSI), especially the ultraviolet spectrum: It is fluctuating much more strongly, by up to 10% between a quiet and an active sun. And at low solar activity, it generates precisely the pattern in the wintertime that we’ve been seeing since 2006: The North Atlantic Oscillation (NAO), which impacts the temperature in the Eurasian region especially in the wintertime, is controlled and effected by the UV radiation of the sun. When there is less solar activity, it gets colder in the region”
See more at: http://notrickszone.com/2013/10/07/current-sunspot-cycle-weakest-in-190-years-recent-model-temperature-deviation-due-to-solar-activity-experts-say/#sthash.gW1kXASO.dpuf
highflight56433 says:
October 11, 2013 at 9:14 am
Thanks for those studies.
Much as some here suspected, small changes in one spectral component of TSI can make a detectable difference in weather & maybe climate, if the papers be credible.
***
ferd berple says:
October 11, 2013 at 7:00 am
a catalyst does not involve positive feedback. look in the mirror and you will see nature using extremely complex catalysts to produce a result that would be impossible otherwise. these catalysts do not add energy to the reaction. they lower the energy at which the reaction can take place, and thus increase the reaction rate, without adding any energy to the reaction.
***
Climate is not governed significantly by chemical reactions — it’s a sun-powered, atmospheric-driven heat-engine.
“Climate is not governed significantly by chemical reactions — it’s a sun-powered, atmospheric-driven heat-engine.”
Really? So ions do not attract other molecules such as water to form clouds? Without clouds the climate would be the same as what?
wayne says:
October 11, 2013 at 12:14 am
Dr. Robertson, (are you ‘bones’?)
————————————–
Yes
wayne says:
October 11, 2013 at 12:39 am
Seems I left out a second question, could the albedo have decreased over the 1955 to present period? Say leaving some wiggle room and take 0.3% times six decades or about -0.005 in the albedo? Don’t know that either, have never looked into it.
—————————————-
Yes, but it has not been measured in any reliable way. The global average solar radiation that reaches the earth has not been measured reliably enough to say how much it has changed. There have been surface measurements for Antarctica (if I recall correctly) over a solar cycle that show ~ 1% variation; easily more than enough to cause the surface temperature variations.
It would probably cost no more than that of the ARGO buoy system to collect a representative sample of surface radiation measurements for the earth surface, but it would be difficult to keep the instrument surfaces suitably clean. In the meantime, the ARGO system provides for a more detailed calorimetry analysis and surface energy distribution than I have done here.
SteveP says:
October 11, 2013 at 8:53 am
Precision is not the same thing as accuracy. Precision means ‘Repeatability’ while Accuracy is a measure of closeness to the true value.
I guess you missed the point. SORCE measured TSI with an accuracy of 0.5 W/m2 but with a precision and stability of 0.007 W/m2. For variations of TSI it is the precision that is important. For stability it is important to measure the degradation of the instruments carefully.
Ulric Lyons says:
October 11, 2013 at 9:01 am
“Up there the density is a billionth of sea-level density so there is almost no heat and hot air does not descend.”
It has a very large volume, it gets to very high temperatures, and it radiates.
As there is almost no matter it matters not what the volume, temperature, and radiation are. If the volume were 1000 times larger and the temperature 10 times higher [both values much too high], the energy content would still be 100,000 times smaller than the lower atmosphere.
Hockey Schtick says:
October 10, 2013 at 3:16 pm
For a start, here’s 50 papers describing potential solar amplification mechanisms
lsvalgaard says: October 10, 2013 at 3:23 pm
None of those explain how 3.6 times more heat reach the surface than the variation of what the Sun puts out…Otherwise the climate system would be a nifty energy producer: you put 10 units in and you get 36 out. I want one of those 🙂
Allan Says:
Hello Leif, I hope you are well. Happy Canadian Thanksgiving!
This point has probably already been covered above.
As you correctly state the system is not producing energy ( “from thin air” :-] ).
The term “amplifier” is used loosely and is somewhat imprecise.
IF indeed the Sun is the primary controlling mechanism in the observed short-term (e.g. ~11 year Solar Cycles, ~80-90 year Gleissberg Cycles) warming and cooling periods that seem to correlate with minor solar variation according to many papers, then either:
1. There is some solar parameter that has a greater much variation than TSI.
AND/OR
2. There is a form of “amplifier” that enhances the solar variation.
AND/OR
3. Something else.
Let’s explore Option 2. [I know this is all obvious to you, but I just wanted to write this down so people can shoot at it.]
The climate system is not producing energy – let’s not start out by breaking the Laws of Thermodynamics.
But this is not necessary to explain the observed variation in ocean temperatures, etc.
The amplifier can work as a “double-negative”, for example per the Svensmark hypo, by increasing cloud cover and thus reducing TOTAL solar input to Earth. The energy is already in the system, and is being negatively modulated by increased clouds. [Greater solar activity > Less cosmic radiation > Less clouds > Warmer Earth]
So if you prefer a better term than “amplifier” (I don’t), then call it something else – such as “double-negative amplifier”.
OK – all elementary and you know it, but it refutes your above suggestion that the system has to create energy in order for such an “amplifier” to work.
I know we disagree on the following point – I think the Sun rules Earth’s climate (somehow – not sure about the dichotomy between the ~~90-year Gleissberg Cycle and the 60-year PDO) and you say climate just ‘goes up and down’.
I really hope you are right, because if I am right we are about due for some global cooling that may be severe, and increasingly, I hate the cold.
I bid you a wonderful day, and leave you with Chaucer’s take on solar influence (but did the word “obliquity” even exist then, or was the Earth still flat?):
WHAN that Aprille with his shoures soote
The droghte of Marche hath perced to the roote
Best personal regards, Allan 🙂
http://wattsupwiththat.com/2009/01/10/polar-sea-ice-changes-are-having-a-net-cooling-effect-on-the-climate/#comment-74024
Allan M R MacRae (19:49:11) “Climate change is natural and cyclical.”
Leif Svalgaard (19:57:40) “I would not disagree with that, except for downplaying the ‘cyclic’ bit. I don’t think there is strict cyclicity, just that it ‘goes up and down’.”
It has always impressed me that the role of biology is relegated to some insignificant background in climatology.
The Earth’s atmosphere is what it is today because of biological action driven by biologically available energy from the crust and the Sun. Biological action on the atmosphere did not stop some time in the past just as evolution did not. Evolution of the atmosphere and biology are just as active as they have been in the past. The total radiation energy available from the sun may be fairly constant, but where in the spectrum the energy is delivered to the surface of the Earth, I am quite sure, has very measurable effects on our crust and atmosphere and should not be neglected. The biological signature can be clearly seen in the Mauna Loa CO2 spectra. The fossil hydrocarbons we are using were put there by biological activity.
There are probably thousands of feed foreward and feed back loops, some big some small, that affect our climate on many levels, by ignoring biological action we are probably ignoring some very significant ones.
Allan MacRae says:
October 11, 2013 at 9:54 am
IF indeed the Sun is the primary controlling mechanism in the observed short-term (e.g. ~11 year Solar Cycles, ~80-90 year Gleissberg Cycles) warming and cooling periods that seem to correlate with minor solar variation according to many papers
This is precisely the sticking point. There are many claims. I probably know most of them put forward the last 350 years starting with Riccioli. I have yet to see one that is convincing. You could pick the one that is most convincing to you and we can discuss that one in detail.
Allan MacRae says:
October 11, 2013 at 9:54 am
Chaucer knew the earth is a sphere, as did every other learned person in the 14th century & for a millennium previously in the Western world. Also many unlearned people, such as sailors, or even those who looked at the pictures in the stained glass windows of their churches.
http://en.wikipedia.org/wiki/Treatise_on_the_Astrolabe
otsar says:
October 11, 2013 at 9:58 am
Cloud condensation nuclei can be of biological origin:
http://en.wikipedia.org/wiki/CLAW_hypothesis
If the sun thru primary effects and secondary effects does not exert a major influence on the climate how does one reconcile the correlation between solar active periodsand warmer temperatures versus solar minimum periods and lower temperatures? A very simple question but true.
I have never seen a low solar quiet period correlate to a rise in tmeperatures, or a high active solar period correspond to a drop in temperatures. Never.