 (Perturbation Calculations of Ocean Surface Temperatures.)
Guest essay by Stan Robertson, Ph.D., P.E.
1. Introduction
It is generally conceded that the earth has warmed a bit over the last century, but it is not clear what has caused it, nor whether it will continue and become a problem for humanity. There is a possibility that some of the warming has been caused by anthropogenic greenhouse gases, but it is also likely that the sun has been partially responsible. The arguments that are advanced to say that humans caused it and that it will become a serious problem rely on models that have not been validated and positive feedback effects that have not been shown to exist, at least at the hypothesized levels of effectiveness. The apparent weakness in the argument that the sun has been a major contributor is that satellite measurements of Total Solar Irradiance (TSI) have not shown changes large enough to have directly produced the warming of the earth over the last half century. But what about indirect effects? Is it possible that the sun exerts control in some indirect way? In these notes I recapitulate the evidence that this is the case by showing that the variations of TSI cannot provide the energy that is necessary to account for the warming of the oceans during solar cycles.
TSI, as measured above the earth’s atmosphere varies by about 1.2 watt/m2 over a nominal eleven year solar cycle (h/t Leif Svaalgard) primarily at wavelengths shorter than 2 micron. The dominant harmonic variation of TSI would thus have an amplitude half this large, or about 0.6 watt/m2. About 70% of this enters the earth atmosphere. Averaged over latitudes and day/night cycles, about one fourth of this 70%, or ~0.11 watt/m2, on average, enters the upper atmosphere. Since only about 160 watt/m2 of 1365 watt/m2 of incoming solar radiation at wavelengths less than 2 micron reaches the earth surface, the amplitude of short wavelength TSI reaching the earth surface would be only (160/1365)x0.6 = 0.07 watt/m2. However, about half of the difference between 0.11 and 0.07 watt/m2 eventually reaches the earth surface as scattered thermal infrared radiation at wavelengths greater than 2 micron. Thus the average amplitude of TSI reaching the earth surface in all wavelengths would be about 0.09 watt/m2. So the question is, just how much sea surface temperature variation can this produce?
Several researchers, including Nir Shaviv (2008), Roy Spencer (see http://www.drroyspencer.com/2010/06/low-climate-sensitivity-estimated-from-the-11-year-cycle-in-total-solar-irradiance/) and Zhou & Tung (2010) have found that ocean surface temperatures oscillate with an amplitude of about 0.04 – 0.05 oC during a solar cycle. (In fact, all of the ideas that I am presenting here were covered in Shaviv’s work, but it has not gotten the attention that it deserves.) Using 150 years of sea surface temperature data, Zhou & Tung found 0.085 oC warming for each watt/m2 of increase of TSI over a solar cycle. Although not strictly sinusoidal, the temperature variations can be approximately described in terms of a dominant sinusoidal component of variation with an 11 year period. Thus the question to be answered at this point is, can 0.09 watt/m2 amplitude of variation of TSI entering the oceans produce temperature oscillations with an amplitude of 0.04 – 0.05 oC?
The answer to this question depends on the average thermal diffusivity of the upper oceans. That is an unknown, but not unknowable, quantity. Thermal diffusivity is the ratio of thermal conductivity to heat capacity. The upper 25 to 100 meters of oceans are well mixed by waves and shears. These are mixing zones with high thermal diffusivity and correspondingly small temperature gradients. Diffusivities are lower at greater depths. Bryan (1987) has found that thermal diffusivities ranging from 0.3 to 5 cm2/s are needed to account for the temperature profiles below the mixing zone. In my first trial calculations of the energy flux necessary to account for the temperature variations, I tried values of thermal diffusivity in the range 0.1 – 10 cm2/s and found that the TSI variations were generally inadequate to produce the sea temperature variations over a solar cycle. But there was wide variation of calculated energy flux. Larger values of thermal diffusivity required more heat because more was able to penetrate to the depths, but even for 0.1 cm2/s, the required input was double the TSI variations that reach the earth surface. Fortunately, there is a way to constrain both the value of the thermal diffusivity and the heat input. It consists of first matching the measured trends of surface temperatures and ocean heat content over time. Measurements of these were reported by Levitus et al. (2012) and are available from http://www.nodc.noaa.gov/OC5/3M_HEAT_CONTENT/ .
In the calculations described below, I have used the data from 1965 to 2012 for ocean depths to 700 meters. Sea surface temperatures and ocean heat content began to increase after 1965. Only about a third of the increase of heat content occurred at depths below 700 meter. Since little heat migrates below this depth over 11 year solar cycles, it is preferable to use the 0 – 700 m data for the purpose of calibrating the thermal diffusivity
2. Heat Transfer Perturbation Calculations
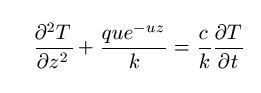
For the calculation of sea surface temperature and sea level changes, we can treat the variations of radiations entering and leaving atmosphere, lands and oceans as minor perturbations on an earth essentially in thermal equilibrium. Ocean mixing zones, thermoclines and other features of the temperature profiles remain largely as they were while small radiant disturbances produce minor variations of temperature starting from zero, and imposed at each depth. Thus the effects of these disturbances can be modeled as one-dimensional energy flows into a medium at uniform temperature. Such “perturbation calculations” are among the most powerful analysis techniques used by physicists and engineers and are widely used. The energy equation to be solved in this case is:
http://i1244.photobucket.com/albums/gg580/stanrobertson/equation_zpscea297ad.jpg

Where T is the temperature departure from equilibrium at depth , z, and time, t. q is a perturbing radiant flux entering the surface, u the absorption coefficient, c is absorber heat capacity and k its thermal conductivity. The rate of heat transfer by conduction processes is controlled by the thermal diffusivity, which is the ratio k/c.
As a one dimensional heat flow problem, it is straightforward undergraduate level physics or engineering to numerically solve the equation above for the expected changes of surface temperature as surface radiant flux varies. In my calculations, temperature changes were calculated for 1.0 meter increments of depth in the oceans. Two cases were considered. In one
case the surface radiation perturbation was assumed to increase linearly with time. This corresponds to the ocean conditions for the period 1965-2012. In the second case, it was assumed to vary as a cosine function of time with the 11 year period of the solar cycle. The cosine function provides both some positive and some negative variation in the first half cycle, which helps to minimize the transients of the first few years.
I treated q and thermal diffusivity, (k/c), as input parameters that were chosen to provide agreement with the observed sea surface temperature variations and ocean heat content measurements (https://www.ncdc.noaa.gov/ersst/ ). The absorption coefficient, u, was entered in piecewise fashion. Only the deep UV radiations penetrate to depths below 10 meter, but conduction takes energy to much greater depths. For the values of u chosen, only 44.5% of the surface energy flux goes deeper than 1 meter, 22.5% below 10 meter and 0.53% to 100 meter (h/t Leif Svalgaard). Thermal diffusivity of oceans was assumed to be 0.3 cm2/s below 300 m. This accords with Bryan’s estimates below the mixing zone, but little change of results occurred for values as low as 0.1 cm2/s. The required heat inputs are relativity insensitive to the thermal diffusivity below 300 meter. For the shallower depths, thermal diffusivity was varied until trends in accord with observed temperatures and heat content were produced.
It is necessary to maintain an energy balance at the sea surface in approximate equilibrium with the incoming solar radiation. As estimated by Trenberth, Fasullo and Kiehl (2009), about 160 watt/m2 enters the surface, on average. At a mean temperature of 288 oK, the sea surface will emit about 390 watt/m2 of surface thermal infrared radiation at wavelengths longer than about 2 micron, however, about 84% of that is returned as back scattered radiation. The rest of the energy balance is provided by evaporation and thermal convection, which remove about 59% of the heat from the surface. From the standpoint of merely wanting to know how much heat is required to change the ocean surface temperature, it is possible to maintain a proper energy balance without delving into the messy details of evaporation, convection and infrared absorption in the first few millimeters of water. The temperature variations at one meter depth will not be measurably different from those at the surface for the thermal diffusivities of interest here. If we merely want to know what net energy flux entering the surface is required to make the water temperature at one meter depth oscillate with an amplitude of 0.04 – 0.05 oC , then all we need to do is account for the outgoing surface infrared emission and let 41% (160 watt/m2 / 390 watt/m2 = 0.41) escape. At the present 288 oK, the earth radiates an additional 5.42 watt/m2 for each 1 oC increase of surface temperature. In the case of surface temperature being perturbed by 0.04 oC, an outgoing additional 0.22 watt/m2 would be generated and 0.09 watt/m2 was allowed to escape. This nicely balances the amplitude of TSI variations that reach the earth’s surface.
3. Linear heating:
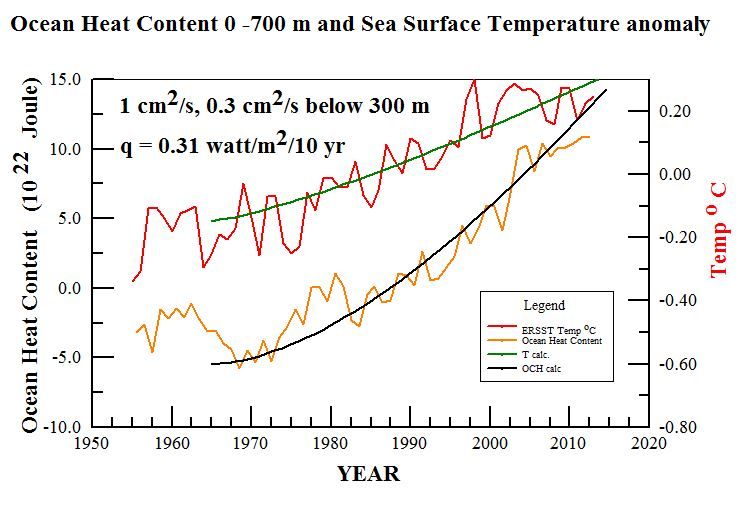
In these calculations, the aim was to find the heat input and thermal diffusivities necessary to account for the observed surface temperature increase (http://www.nodc.noaa.gov/OC5/3M_HEAT_CONTENT/ )Extended Reconstructed Sea Surface Temperature) and the increased ocean heat content (OHC 700) that have been reported by NOAA. Since surface temperatures had not been increasing in the early 1960s, but began to increase in the last half of that decade, I chose to start calculations with linearly increasing heating in 1965. I found that the ocean heat content to a depth of 700 meters was quite sensitive to the thermal diffusivity used. The best results that I have been able to obtain were for a thermal diffusivity of 1 cm2/s to 300 meter depth and surface heat input increasing at a rate of 0.31 watt/m2 per decade. These are shown on the graph below with calculated trends shown by the green and black lines. On a time scale of 50 years, most of the heat accumulates at relatively shallow depths. To better reflect a realistic thermal diffusivity for greater depths, I used a lower value of 0.3 cm2/s below 300 meter. That has little practical effect on a 50 year times scale, but would be necessary if one wanted to extend the calculations for several centuries while surface heating perturbations had time to penetrate to much greater depths.
http://i1244.photobucket.com/albums/gg580/stanrobertson/OHC700_zpsb9e34e91.jpg

Figure 1. Ocean heat content 0 – 700 meter and surface temperature trends according to NOAA. Blue and green lines show trends calculated for the parameters shown.
These calculations establish some parameters that do a good job of representing the thermal behavior of the upper oceans, however, if one looks closely at the data trends in the graph, it is apparent that both surface temperature and ocean heat content have considerably slowed their rates of increase in the last decade. This makes it unlikely that greenhouse gases are the cause of the rate of heating needed to explain the previous trends because their effects should have become enhanced rather than diminished. It might also be noted that a similar warming trend occurred in the first half of the previous century before anthropogenic greenhouse gases could have contributed significantly. Thus it is more likely that both warming periods had natural origins.
Obtaining simultaneous fits to the ocean heat content and sea surface temperature trends with only two free parameters, thermal diffusivity and surface heating rate, is quite confining. Acceptable, but noticeably worse, fits than shown above, were obtained with thermal diffusivities ranging from 0.8 to 1.2 cm2/s and heat inputs ranging from 0.29 to 0.33 watt/m2. Based on previous calculations for sea level data, I was initially inclined to think that larger thermal diffusivities would be necessary, but larger values let more heat penetrate to greater depths than the amounts of heat reported by Levitus et al. In addition, I was chagrined to learn that most of the variation of sea level that accompanies solar cycles is caused by evaporation rather than thermal expansion.
Solar Cycles:
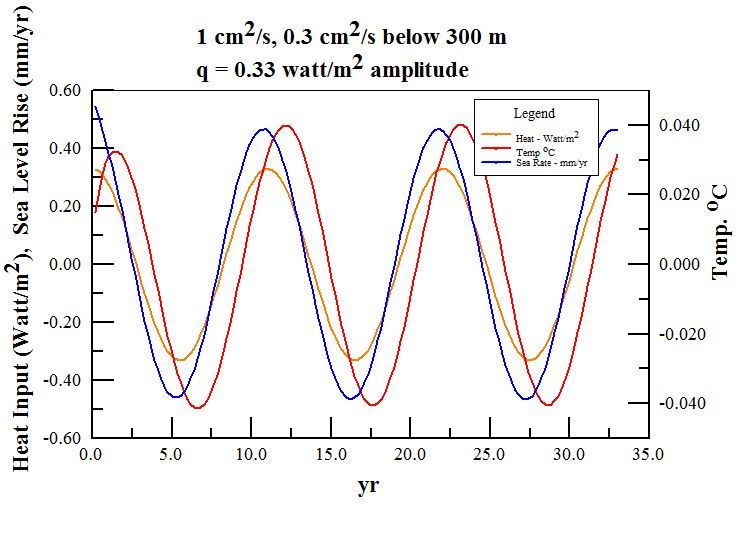
The process of choosing thermal diffusivity and surface heating rates to accord with observations provides a sound basis for calculating what to expect for the temperature variations during solar cycles. In this case we can use the thermal diffusivity of 1 cm2/s that is required of the ocean heat content results as an input parameter and choose the heat input that is required to produce temperature variations of 0.04 – 0.05 oC amplitude. Producing sea surface temperature variations with an amplitude of 0.04 oC requires a surface heat input of 0.33 watt/m2, as shown below:
http://i1244.photobucket.com/albums/gg580/stanrobertson/solarcycle10_zpsa3b8b0ee.jpg

Figure 2. Radiant flux, ocean temperature oscillations, and sea level variations for three solar cycles of eleven years each. The entering flux shown here is the value of q = 0.33 watt/m2 needed to drive the variations of surface temperature of 0.04 oC with ocean thermal diffusivity of 1.0 cm2/s to depth of 300 m. The amplitude of thermosteric rate of change of sea level was 0.47 mm/yr. Temperature lags the driving energy flux by 15 months. The thermal expansion coefficient of sea water used here was 2.4×10⁻⁴/ oC.
I believe that this settles the issue of what is required to produce sea surface temperature oscillations with an amplitude of 0.04 oC. The solar TSI variations that reach the earth’s surface are smaller than the 0.33 watt/m2 needed to account for sea surface temperature variations by a factor of 3.6 for this smallest estimate of sea surface temperature variability.
Although the estimated 0.33 watt/m2 that is required to explain the surface temperature variations is large compared to the amplitude of TSI variations that reach the surface, it is still only about two parts per thousand of the 160 watt/m2 of solar UV/VIS/NIR that reaches the earth surface. There are many possible ways in which the sun might modulate the surface energy flux to this extent. These include modulation of cloud cover and small spectral shifts in the energetic UV that might modulate ozone absorption or produce shifts of the effective sea surface albedo. It would seem to be a fairly direct radiative effect, rather than feedback, since it must vary in phase with the solar cycle.
In summary, my calculations based on energy conservation considerations imply that the sun modulates the ocean temperatures to a much greater extent than can be provided solely by its TSI variations. The great question that desperately needs an answer is how does it do it? It should be easily understood that solar effects would not necessarily be confined to cycles. More likely, the sun has been the driver of the large changes of temperatures of the Roman and Medieval warm period, the Little Ice Age, and the recent recovery from it without requiring large changes of its own irradiance. When we understand how the sun does this, we will have begun to understand the earthly climate.
###
Biographical note:
Stan Robertson, Ph.D, P.E, retired in 2004 after teaching physics at Southwestern Oklahoma State University for 14 years. In addition to teaching at three other universities over the years, he has maintained a consulting engineering practice for 30 years.
References:
Bryan, F., 1987: Parameter Sensitivity of Primitive Equation Ocean General Circulation Models. Journal of Physical Oceanography, 17, 970-985. (PDF available here http://journals.ametsoc.org/doi/abs/10.1175/1520-0485%281987%29017%3C0970%3APSOPEO%3E2.0.CO%3B2
Levitus, S. et al., 2012 World ocean heat content and thermosteric sea level change (0–2000 m), 1955–2010, Geophysical Research Letters, 39, L10603, doi:10.1029/2012GL051106, 2012 http://onlinelibrary.wiley.com/doi/10.1029/2012GL051106/abstract
Shaviv, Nir 2008, Using the oceans as a calorimeter to quantify the solar radiative forcing, Journal of Geophysical Research, 113, A11101 http://www.sciencebits.com/files/articles/CalorimeterFinal.pdf
Trenberth, K., Fasullo, J., Kiehl, J. 2009: Earth’s Global Energy Budget. Bull. Amer. Meteor. Soc., 90, 311–323. doi: http://dx.doi.org/10.1175/2008BAMS2634.1 www.cgd.ucar.edu/staff/trenbert/trenberth.papers/TFK_bams09.pdf , Fig. 1
Zhou, J. and Tung, K. ,2010 Solar Cycles in 150 Years of Global Sea Surface Temperature Data, Journal of Climate 23, 3234-3248 http://journals.ametsoc.org/doi/abs/10.1175/2010JCLI3232.1
bones says:
October 10, 2013 at 10:47 pm
at the surface.
which would seem to depend on the direct incoming flux and not care what the temperature is a great depth [which would have a very attenuated solar cycle variation].
gradients & flows
down with the obfuscation
I agree, but if I recall correctly, it took about 0.18 watt/m^2 to get 0.04 C surface temperature variations for 0.1 cm^2/s thermal diffusivity. That diffusivity is an order of magnitude smaller than needed to account for the ocean heat content measurements and yet it takes double the 0.09 watt/m^2 of TSI reaching the surface to get the requisite surface temperature change.
lsvalgaard says:
October 10, 2013 at 3:41 pm
Explain how any or all of these can supply 3.6 times MORE energy than the variation of the TOTAL energy received from the sun.
===========
The solar wind can react physically with the atmosphere in a fashion that TSI cannot. As such, the effects of the solar wind are not restricted to W/m^2. Even a small change in the albedo due to the solar wind could quickly swamp the variability in TSI.
What the authors numbers show is that TSI cannot be the cause of the 11 year variability in ocean temperatures. there must be another, as yet unknown cause. similar to the discovery of the outer planets in the solar system – by the effect they had on known planets. we can see something is causing the variability, but as yet we haven’t discovered what it is.
What the author has done is to eliminate TSI as the cause. Whatever is left, known or unknown, no matter how improbably, must contain the cause.
ferd berple says:
October 10, 2013 at 11:29 pm
The solar wind can react physically with the atmosphere in a fashion that TSI cannot. As such, the effects of the solar wind are not restricted to W/m^2. Even a small change in the albedo due to the solar wind could quickly swamp the variability in TSI.
The albedo is basically determined by clouds. It takes a lot of energy to make clouds. The solar wind does not have a lot of energy.
fred berple: “What the authors numbers show is that TSI cannot be the cause of the 11 year variability in ocean temperatures.”
Question: Who would even think so? Not picking on you here at all. But we’re all basically on board with the idea that CO2 emitted photons will be absorbed by land masses. But it seems to be an utter mindbender that water below will absorb photons from the water above. With or without any Willis Wobble theory of clouds.
TSI as a sum of the power across all photons of all frequencies is almost entirely pointless to look at. We’d need to know the W/m^2 of the proper wavelengths in and how they vary. Then the rest models up as an ideal GHG system.
Only problem is we’d need a solar scientist to be able to answer that issue.
“It is generally conceded that the earth has warmed a bit over the last century, but it is not clear what has caused it”
Yes, this is science the way the climate guys do it:
They made the first claim, so whoever disagrees is the skeptic.
Een though they never did “due diligence” science by falsifying other competing possibilities, such as sunspot cycles, Milankovitch cycles, natural planetary climate variation, ENSO, etc.
Without testing ANY of those others, they made their unsustainable claim, drawing a line in the sand.
And when someone asked, “Are you sure?” the questioner became a denier.
If we the skeptics had thought about it and beat them to the punch, by first claiming, “The warming is totally natural variation,” then the warmists would be the deniers.
D*mmit! We missed our chance!
Dr. Robertson, (are you ‘bones’?)
For one, it certainly seems that albedo could account for it all. The way I calculate that it would only require a 0.2% flex in the albedo to reach the 0.04°C cycle T range. If you are looking for the 0.31 W/m2 per decade it too would require a decadal decrease in the albedo of, once again, right under 0.2% per decade to fit those 1955 to present curves. I’ve seen albedo figures all over the board, from 0.31 to 0.29x so yes, I can see that, but I am not sure albedo is even that precisely measured.
If so, that’s one good place for such a factor to stay hidden to all for so long by it’s historic immeasurability.
Now, does the 11 year radiation flex affect the overall albedo? I don’t know.
Seems I left out a second question, could the albedo have decreased over the 1955 to present period? Say leaving some wiggle room and take 0.3% times six decades or about -0.005 in the albedo? Don’t know that either, have never looked into it.
I think I have figured out how the sun does it.
http://www.newclimatemodel.com/new-climate-model/
I await date capable of confirming or rebutting.
Down to Earth
Most scientists are obsessed with the atmosphere and fail to include, like the IPCC, the input of the sun on the earth under their feet. I suggest an investigation of how the sun heats up bare earth and concreted bare surfaces would demonstrate one major “amplifier” of the sun’s rays.
We all know that Urban heat Islands are hotter than surrounding rural areas where trees and grass is growing, where vegetation is aplenty, covering the soils.. We all know that deserts are distinctly hot places during daylight. We all know that arid lands are ditto, hot places. We might not know that cultivated land, left bare, also heats up and loses any little moisture they might have by evaporation, In these circumstances, the soil is powdery and picked up winds, eroded by wind.
It is claimed that 50% of the land surface on this globe is desert and arid lands. These dry hot areas, are apparently caused primarily and originally by over grazing, constant cultivation, clearing of vegetation, removal of trees etc. This has occurred from Roman times, and perhaps earlier. Now, we also have large scale open cast mining projects which contribute to the amplification too.
However solar oradiation would determine the amount of heat so generated. A cooler sun, would reduce the heat output from the bare exposed, fast heating surfaces. This we see in the Northern Hemisphere every winter ).
In summer of course the solar input is at a maximum and the bare exposed areas would heat up magnificently. Lakes and rivers shrink. Water shortages occur. Worse evaporation must come to a horrid halt.. Now add in some dust storms, carried by blasting hot winds and life for many becomes unbearable (even impossible) and the terrain becomes hotter and more inhospitable to all life forms..
There is more to be considered, and that is in this situation, the microbies, fungi, bacteria, flora and fauna in the soils die out,or fail to function,, or become inactive – to the detriment of the vegetation that they support. Also soil moisture levels diminish. What scientist considers or has troubled to investigate this “all man made” aspect?
“Here are all the forcings: C02, CH4,halocarbons, N2O, C0. NMVOC, No3,NH3,S02,Black Carbon, Organic Carbon, Mineral Dust, Aerosol, Aircraft (contrails), Land Use, Solar.”
It’s not a knob, it’s an equalizer! Or AGW-izer?
Oh my gosh.. The climate alarmists say that because they cannot otherwise explain the warming it must be CO2 that dunnit. Lief says that because we cannot explain how the sun does it it cannot be the sun. Birds of a feather. Same nonsense just in another form. I do not care how many qualification anyone may have or how much respected work they have done, if they in spite of all that cannot understand the gist of the main post here, which is that it clearly is not TSI but something else related to the sun, AND LET’S FIND IT… what can one say? Closed mind and zero credibility from the very first comment on this thread. Really sorry I have to say this….
lsvalgaard:
“Explain how any or all of these can supply 3.6 times MORE energy than the variation of the TOTAL energy received from the sun.”
It can help to explain here (it the Sun “may be” – as the sun can be – its variability – amplified), only those quotes (by reason of which my comments on Skeptical Science were – mostly – removed):
Solar-forced shifts of the Southern Hemisphere Westerlies during the late Holocene, Varma et al., 2011.:
“Since the reduction in TSI is only 0.15%, the global cooling effect is small and ADDITIONAL FEEDBACKS are required to induce a significant change in the westerlies.”
“… we propose that the role of the sun in modifying Southern Hemisphere tropospheric circulation patterns has probably been UNDERESTIMATED in model simulations of past climate change.”
Natural forcing of climate during the last millennium: fingerprint of solar variability, Swingedouw (2010): “We argue that this lag is due, in the model, to a no rthward shift of the tropical atmospheric convection in the Pacific Ocean, which is maximum more than four decades after the solar forcing increase.”
“Changes in wind stress, notably due to the NAO, modify the barotropic streamfunction in the Atlantic 50 years after solar variations.”
Sub-Milankovitch solar forcing of past climates: Mid and late Holocene perspectives, Helama (2010):
“The observed variations may have occurred in association with internal climate amplification […] (likely, thermohaline circulation and El Niño–Southern Oscillation activity). THE NEAR-CENTENNIAL DELAY in climate in responding to sun spots indicates that the Sun’s influence on climate arising from the current episode of high sunspot numbers may not yet have manifested itself fully in climate trends.”
Response of Norwegian Sea temperature to solar forcing since 1000 A.D., Sejrup (2010): “The observed ocean temperature response is LARGER than expected based on simple thermodynamic considerations, indicating that there is dynamical response of the high‐latitude ocean to the Sun. […]”
Dudok de Wit & Watermann, 2009.:
“… the main mechanisms by which the Sun affects the Earth are not the most immediate ONES IN TERMS OF ENERGETIC CRITERIA.”
“- feedback mechanisms are not sufficiently well understood and POSITIVE FEEDBACK MAY BE MUCH STRONGER than expected …”
Cyclic variation and solar forcing of Holocene climate in the Alaskan subarctic, Hu et al., 2003. :
“Our results imply that SMALL variations in solar irradiance induced pronounced cyclic changes in northern high-latitude environments.”
Testing solar forcing of pervasive Holocene climate cycles, Turney et al., 2005.:
“The cycles, however, ARE NOT COHERENT WITH CHANGES IN SOLAR ACTIVITY (both being on the same absolute timescale), indicating that Holocene North Atlantic climate variability at the millennial and centennial scale IS NOT DRIVEN BY A LINEAR RESPONSE to changes in solar activity.”
Climate change and solar variability: What’s new under the sun?, Bard and Frank, 2006.:
“Overall, the role of solar activity in climate changes —such as the Quaternary glaciations or the present global warming— remains unproven …”
Solar Variability Over the Past Several Millennia, Beer et al. 2006.:
“This led many people to conclude that, even if the solar constant is not constant, the changes are too small to be climatically relevant without invoking additional strong amplification mechanisms. THIS CONCLUSION SEEMS TO BE PREMATURE, firstly because there is no doubt that there are positive feedback mechanisms in the climate system.”
NASA: “The spectral solar irradiance (SSI) at UV (ultraviolet) wavelength has been observed to vary during an 11-year solar cycle with much larger amplitude compared with the variability of TSI.”
“Even though TSI and SSI at UV wavelengths have been observed to vary during solar cycles, how the Sun varies (both TSI and whole spectrum SSI) and how solar variations influence the Earth’s climate over long time scales REMAIN UNRESOLVED.”
“Based on SIM observations Cahalan et al. [2010] demonstrate REMARKABLE different climate responses (stratosphere, troposphere, ocean mixed layer) to SORCE-based and proxy-based SSI variations. The OUT-OF-PHASE SSI variations also have implications to re-examine the connection of the Sun and stratosphere, troposphere, biosphere, ocean, and Earth’s climate. […]”
Gray (2010):
“They found that even low solar forcing could affect climate on multi-decadal to centennial timescales but the results using medium-to-low values (corresponding to the range of Lean et al., 2002) fitted best within the range of temperature reconstructions. Note, however, that if the recent SORCE/SIM measurements of spectrally resolved solar irradiance …” “… are correct then solar radiative forcing at the tropopause would vary out of phase with TSI. In this case, assessments of solar influence on climate, at least over the 11-yr cycle and possibly on the longer term, would need to be ENTIRELY revisited …”
NOAA : “… our understanding of the indirect effects of changes in solar output and feedbacks in the climate system IS MINIMAL […]”
Sun, its variability – as well “suited” the key – it activates the mechanism … –
mechanisms triggering other mechanisms: energy accumulation and releasing huge amounts of energy – energy stored in the energy system of the Earth.
The fact that we do not know: how? (sufficient detail), does not mean it does not exist …
(sorry that I do not give links but some blocking my comments, others are not currently active)
lsvalgaard says:
October 10, 2013 at 6:54 pm
The entire universe is supposedly a chaotic system, yet in our small part of it we find ~400 billion stars in one spiral galaxy, and in a much smaller part of that we find more than 6 billion humans that defy the essence of “chaos”. Or is there something else afoot?
Using chaos to refute the obvious is a rather incomplete defense.
lsvalgaard says:
“The solar wind does not have a lot of energy.”
Looking how well the SABER data follows the geomagnetic signal, the solar wind appears to be responsible for a large proportion of the heating of the upper atmosphere.
lsvalgaard, “Fair enough, but then I’m puzzled by “thermal diffusivity in the range 0.1 – 10 cm2/s and found that the TSI variations were generally inadequate to produce the sea temperature variations over a solar cycle. ”
You don’t need to vary the TSI just the timing. There is a +/- 43 Wm-2 seasonal swing in TSI. Your are removing the seasonal signal of two different systems to determine “forcing” and response. You don’t need to change the energy of the response to get a big impact if you shift the seasonal cycle a latitude or two or week or two, When it comes to chaotic impacts you are comparing apples and oranges.
Isvalgaard,
I would like to point out that the farthest away satellite was launched in 2010 and does not provide data to the TSI dataset. So your still measuring from within the atmosphere for this data and your making assumptions about energy based on a average that may or may not be representative of reality.
v/r,
David Riser
How one spark can make a fire?
How one inoffensive move can lead to a checkmate?
There is a huge amount of stored energy in Earth’s biosphere, that can be released due to small changes of solar irradiance by thousands of different interactions and resonances.
One possible mechanism immediately comes to mind: a small increase in solar irradiance can trigger a substantial increase in activity and reproduction among microscopic sea organisms.
lsvalgaard says:
“The solar TSI variations that reach the earth’s surface are smaller than the 0.33 watt/m2 needed to account for sea surface temperature variations by a factor of 3.6 for this smallest estimate of sea surface temperature variability.
So, in normal science, that falsifies the assumption that solar variations are the cause.”
===
No. In normal science that falsifies the assumption that ” TSI variations that reach the earth’s surface” are the cause.
Only your selective reasoning leads to : “that falsifies the assumption that solar variations are the cause.”
That is post-normal science.
Greg:
re your post at October 11, 2013 at 4:27 am.
Please read my above post at October 10, 2013 at 4:48 pm. This link jumps to it
http://wattsupwiththat.com/2013/10/10/the-sun-does-it-now-go-figure-out-how/#comment-1443729
Please note that Dr Svalgaard said he agrees the points I made in that post.
Richard
Equally, the radiative effect of CO2 is not enough to cause serious warming.
Notwithstanding that, we have been told for the last 30 years that it will destroy climate and life on earth as we know it.
Thanks Richard, when I hit a thread with >150 comments, I admit that I don’t have time the read them all.
@Mosh
“Here are all the forcings: C02, CH4,halocarbons, N2O, C0. NMVOC, No3,NH3,S02,Black Carbon, Organic Carbon, Mineral Dust, Aerosol, Aircraft (contrails), Land Use, Solar.”
So water vapor, the GHG primarily responsible for forcing the Earth’s temperature to rise above its expected black body temperature (255K -> 288K), has less “IPCC-forcing” than the (mostly man-made) ingredients listed above?
Except for contrails, of course. Because they’re made by those flatulent humans. But natural WV has no ‘forcing’. Do I understand correctly?
😐
The solar d**niers have convinced me.
Clearly, unicorns must have caused the MWP and previous warm periods. The sun couldn’t possibly have.