The race to forecast the minimum is on again. Will it be another Serreze death spiral media opportunity? Or will it be ho-hum- nothing to see here, move along?
Once again I’m inviting readers to submit their best guess, best SWAG, or best dartboard result to the poll for the SEARCH Sea Ice Outlook. Deadline, according to the recent announcement I posted on WUWT from ARCUS is close of business Friday June 7th.
Of recent interest has been the recent tendency for the current data to hang between the 1990’s and the 2000 normal line.
 Japan Aerospace Exploration Agency (JAXA) – International Arctic Research Center (IARC) – Click the pic to view at source
We are in that time of year when all of the years converge into a tighter grouping. This makes judging where the current year is going to be a tough challenge at this stage.
I’m going to give WUWT readers an opportunity to make a forecast for the ARCUS SEARCH sea ice contest submission, based on voting. See the poll at the end.
I’ll run this poll each month in the week before the deadline, and we’ll see how we do as the minimum approaches. The value used by ARCUS for judging the contest is the NSIDC value in square kilometers. The object is to guess what the September minimum will be.
I suggest that you should not be using the JAXA graph to forecast minimums, though it it useful for determining short term trends as it is more responsive than the NSDIC graph below, which is averaged.

Here is what the June 2012 forecast submission reports looked like:

The archive of the 2012 contest is available here: http://www.arcus.org/search/seaiceoutlook/2012/summary
For a complete overview of Arctic and Antarctic Sea Ice, see the WUWT Sea Ice Reference page: http://wattsupwiththat.com/reference-pages/sea-ice-page/
Here is the forecast poll, deadline is Friday June 7th. Bear in mind that traditionally, forecasts in June have been too high. Last year’s minimum was 3.41 million square kilometers (1.32 million square miles) at its lowest point on 16 September, and in June, WUWT readers forecast 4.9 million sq kilometers.
Note: The mean is the monthly average in sq km2 for September, which is what the contest is looking for. It is not really as interesting as the minimum, but that’s the number ARCUS is looking for. Given that many of the June forecasts are too high anyway, shooting for the minimum rather than the mean might be just as good.
Note: The POLL HAS CLOSED, and I’ll be submitting the forecast to ARCUS – Anthony
@Keith. 2:44pm last seven days of the animation are a forecast,
Ouch! I didn’t catch that. GIF’s roll by so fast it is hard to catch the details. Thanks for the head’s up.
To all:
What is the easiest way to view frame-by-frame an Animated GIF in Windows 7? Movie Maker, Media Center, Photo View all seem unable to see the frames.
The choice for 5.5 to 5.6 is not available?
5.19166666667. Sorry for the round-off error.
Hmm Anthony, here is another try
@Mosh, still says “this video does not exist”.
Probably some NSA thing, no need to worry.
@Mosh, you can’t submit a playlist, has to be in this form:
[ your URL http://www.youtube.com/watch?feature=player_embedded&list=UUtZdUYUZr493AUh_EInBYxQ&v=u7EHvfaY8Zs ]
[ corrected URL http://www.youtube.com/watch?v=u7EHvfaY8Zs ]
And now it works, though unfortunately, its an interview with the “low information president” of AMS who hasn’t much beyond Rommulan approved talking points to offer. You need better sources Mosh.
“Steven Mosher: do you really fall for this low-sea-ice-affects-the-jet-stream BS? You really fall for what the warmists spout at you with AFAICT no scientific justification. In fact southerly jet streams have been prominent since solar Cycle 23 went low and 24 never came up high.
##############
well, it’s nothing quite remarkable. One need only look at the actual data. The issue is not southernly jet streams. The issue, as even Judith Curry has remarked, is that when the arctic warms you see a change in the N-S gradiant. This leads to a slower jet stream and hence a jet stream with larger amplitudes. That’s measureable. So, it’s not “warmists” it’s the facts. Sorry.
Anthony
since Judith Curry and others have talked about the same phenomena I really dont need to consider the “sources” and go on attacking people. If I want to see people attacked I’ll go to sKs. Instead I Just look at the data. It has no alliances
hmm wave amplitude. Its just data. the curious would look first and then come to a conclusion.
Of course, I dont like her voice so she must be wrong.
dbstealey says:
June 6, 2013 at 11:06 am
“Year over year the ice is getting thinner“??
Really?
##############
yup. this should be an interesting year. Frankly I hope it all holds together as a big loss in september can lead to all sorts of weird weather.
I wonder of we will have big open water north of 85?
http://www.iup.uni-bremen.de:8084/amsr2/arctic_AMSR2_nic.png
4.8675309. Got an 80s song reference in there
From the comments thread I see we’ve been suckered by the hockey team. Arctic sea ice extent and volume is the only surviving metric supporting warming. The AGW proponents are hoping to embarrass skeptics by conning us into nailing our colors to the mast of sea ice extent. Because I’m a lukewarm kind of skeptic who believes that a warm planet is a happy planet, it doesn’t really mean a lot to me if the ice goes right down to zero. Sorry…
Let’s see if I understand this correctly. Mosher absolutely believes that changes in the Arctic temps can influence the jet stream whereas changes in Pacific temps (PDO) cannot. Groupthink in action?
4.5 just because I said so.
But seriously, is anyone planning on “rowing to the pole” this year? I just love those things!
Richard,
Huh?
1. I dont have a any absolute beliefs
2. Its interestng data that one should consider. Judith Curry thinks its interesting, are you going to attack her ?
3. Who said PDO cannot? certainly not me. In fact It would surely play a role.
I dont know why people are so resistent to actually looking at data and seeing for themselves. Its far easier to say “I dont like them, therefore they must be wrong” I know that attitude bugs skeptics, so why do they also do it?
Weird.
Steven Mosher says: June 6, 2013 at 6:59 pm
“I wonder of we will have big open water north of 85?”
Here is a SST animation showing a trace of something similar in just the last few days. It’s early relative to other years.
Steven Mosher says: June 6, 2013 at 6:44 pm Note:(RSS uses a 1979-1998 base period) – Remote Sensing Systems (RSS) – Microwave Sounding Units (MSU) – Click the pic to view at source[/caption]
One need only look at the actual data. The issue is not southernly jet streams. The issue, as even Judith Curry has remarked, is that when the arctic warms you see a change in the N-S gradiant. This leads to a slower jet stream and hence a jet stream with larger amplitudes. That’s measureable. So, it’s not “warmists” it’s the facts. Sorry.
But recently Northern Polar Lower Troposphere Temperatures have been the coolest they’ve been in several years, and right around average:
[caption id="" align="alignnone" width="578"]
Of what relevance are “changes” “when the arctic warms” when Arctic temperatures have been average recently?
From Stephen Rasey on June 6, 2013 at 4:02 pm:
GIMP. On Downloads page select “show other downloads” for the “GIMP for Windows” installer, good for Win XP SP3 and later.
Load the image, the frames and background show up in the “Layers” dialog box (Ctrl-L). Leave the background visible, make the layers non-visible, then make the layer (frame) visible that you want to see.
GIMP is a full-fledged graphics package, hope it’s not too hard for you to figure out for such a simple task. I’m no illustrator, don’t know how to use even a tenth of its capability, and I’ve made simple animated GIF’s with it before.
And given its price, it doesn’t hurt to try it.
“But recently Northern Polar Lower Troposphere Temperatures have been the coolest they’ve been in several years, and right around average:”
Not talking about those temperatures. You’ll need to look at the fall air temps. Of course you can cherry pick anything you like, but if somebody explains that the effect derives from open water in the fall, then you don’t start by looking at annual data. You start by looking at what people are actually talking about. Again, there are many ways to fool yourself.
Nick Stokes says:
June 6, 2013 at 7:47 pm
Steven Mosher says: June 6, 2013 at 6:59 pm
“I wonder of we will have big open water north of 85?”
Here is a SST animation showing a trace of something similar in just the last few days. It’s early relative to other years.
#####################################
Yes, there has been a cyclone persisting over the fragile ice for some time. Watching it on MODIS
The potential for a big blowout is there, but I wouldnt bet on it just yet.
Nick,
while this is a forecast it’s interesting
MYI looks to take a pounding. If we get a lot of cyclones all bets are off.
http://www7320.nrlssc.navy.mil/hycomARC/navo/arcticictn_nowcast_anim30d.gif
As for the high amplitude jet stream, Joe D’Aleo has shown that the positive (warm) AMO phase is a large contributing factor to low sea ice AND the negative phase of the NAO. It happened in the last warm AMO in the 40s and 50s and it is happening now.
This is very perplexing. We can’t all be right! But some of us seem very certain..
I actually haven’t a clue. Nor am I easily persuaded. But very grateful for the opportunity to join in. Thanks Anthony.
(Which applies to the broader controversy as well)
3.3 to 3.4 — for the record (in case there’s a prize) #[:)]
Just a guess by eyeballing the trend and making a HUGE assumption.
Steven Mosher says: June 6, 2013 at 8:31 pm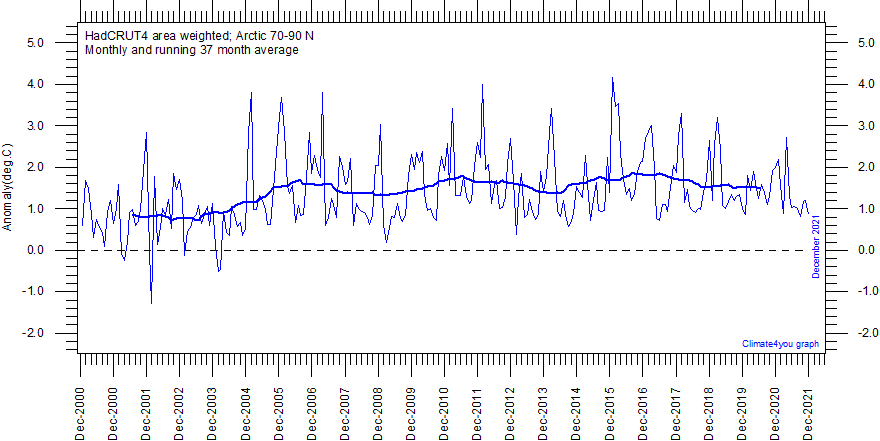 climate4you.com – Ole Humlum – Professor, University of Oslo Department of Geosciences – Click the pic to view at source[/caption]
 Cryosphere Today – Arctic Climate Research at the University of Illinois – Click the pic to view at source[/caption]
Not talking about those temperatures. You’ll need to look at the fall air temps.
It wasn’t particularly warm last fall either compared to the last decade.
Of course you can cherry pick anything you like
How exactly is showing a complete data record and using the word “recently” a “cherry pick” in your mind?
but if somebody explains that the effect derives from open water in the fall, then you don’t start by looking at annual data.
Do you like monthly data better?:
[caption id="" align="alignnone" width="578"]
You start by looking at what people are actually talking about.
Yes, and then you look at the data and research to see if what they are talking about makes any sense. In the graph above it looks like 2007 and 2012, the years with the largest Sea Ice Area Anomalies, actually had less warming:
[caption id="" align="alignnone" width="640"]
Furthermore it appears that the Arctic Temperature pattern set in in 2004, 3 years prior to the 2007 drop in Arctic Sea Ice Area.
Again, there are many ways to fool yourself.
Yes, you’ve certainly figured that out…
The best prediction right now is 0/0. At least that answer is certainly correct at this time.