Guest Post by Willis Eschenbach
Well, this has been a circuitous journey. I started out to research volcanoes. First I got distracted by the question of model sensitivity, as I described in Model Climate Sensitivity Calculated Directly From Model Results. Then I was diverted by the question of smoothing of the Otto data, as I reported on in Volcanoes: Active, Inactive, and Retroactive. It’s like Mae West said, “I started out as Snow White … but then I drifted.” The good news is that in the process, I gained the understanding needed to direct my volcano research. Read the first of the links if you haven’t, it’s a prelude to this post.
Unlike the situation with say greenhouse gases, we actually can measure how much sunlight is lost when a volcano erupts. The volcano puts reflective sulfur dioxide into the air, reducing the sunlight hitting the ground. We’ve measured that reduction from a variety of volcanoes. So we have a reasonably good idea of the actual change in forcing. We can calculate the global reduction in sunlight from the actual observations … but unfortunately, despite the huge reductions in global forcing that volcanoes cause, the global temperature has steadfastly refused to cooperate. The temperature hasn’t changed much even with the largest of modern volcanoes.
Otto et al. used the HadCRUT4 dataset in their study, the latest incarnation from the Hadley Centre and the Climate Research Unit (CRU). So I’ll use the same data to demonstrate how the volcanoes falsify the climate models.
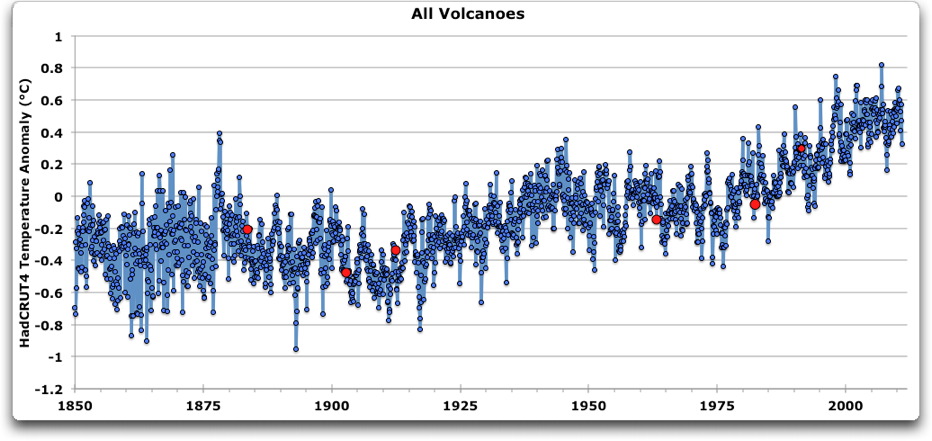
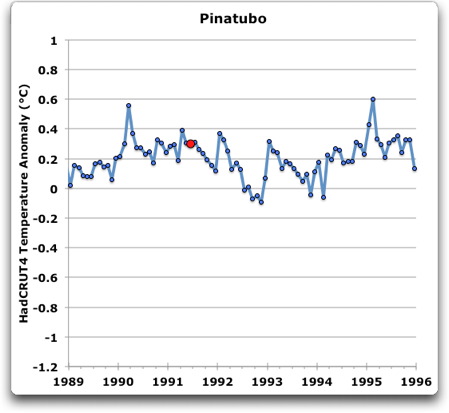
Figure 1. Monthly HadCRUT4 global surface air temperatures. The six largest modern volcanoes are indicated by the red dots.
This post will be in four parts: theory, investigation, conclusions, and a testable prediction.
![]() THEORY
THEORY
Volcanoes are often touted as a validation of the climate models. However, in my opinion they are quite the opposite—the response of the climate to volcanoes clearly demonstrates that the models are on the wrong path. As you may know, I’m neither a skeptic nor a global warming supporter. I am a climate heretic. The current climate paradigm says that the surface air temperature is a linear function of the “forcing”, which is the change in downwelling radiant energy at the top of the atmosphere . In other words, the current belief is that the climate can be modeled as a simple system, whose outputs (global average air temperatures) are a linear function of the SUM of all the various forcings from greenhouse gas changes, volcanoes, solar changes, aerosol changes, and the like. According to the theory, you simply take the total of all of the forcings, apply the magic formula, and your model predicts the future. Their canonical equation is:
Change in Temperature (∆T) = Change in Forcing (∆F) times Climate Sensitivity
In lieu of a more colorful term, let me say that’s highly unlikely. In my experience, complex natural systems are rarely that simply coupled from input to output. I say that after an eruption, the climate system actively responds to reductions in the incoming sunlight by altering various parts of the climate system to increase the amount of heat absorbed by other means. This rapidly brings the system back into equilibrium.
The climate modelers are right that volcanic eruptions form excellent natural experiments in how the climate system responds to the reduction in incoming sunlight. The current paradigm says that after a volcano, the temperature should vary proportionally to the forcing. I say that the temperature is regulated, not by the forcing, but by a host of overlapping natural emergent temperature control mechanisms, e.g. thunderstorms, the El Nino, the Pacific Decadal Oscillation, the timing of the onset of tropical clouds, and others. Changes in these and other natural regulatory phenomena quickly oppose any unusual rise or fall in temperature, and they work together to maintain the temperature very stably regardless of the differences in forcing.
So with the volcanoes, we can actually measure the changes in temperature. That will allow us to see which claim is correct—does the temperature really follow the forcings, or are there natural governing mechanisms that quickly act to bring temperatures back to normal after disturbances?
INVESTIGATION
In order to see the effects of the volcanoes, we can “stack” them. This means aligning the records of the time around the volcano so the eruptions occur at the same time in the stack. Then you express the variations as the anomaly around the temperature of the month of the eruption. It’s easier to see than describe, so Figure 2 shows the results.
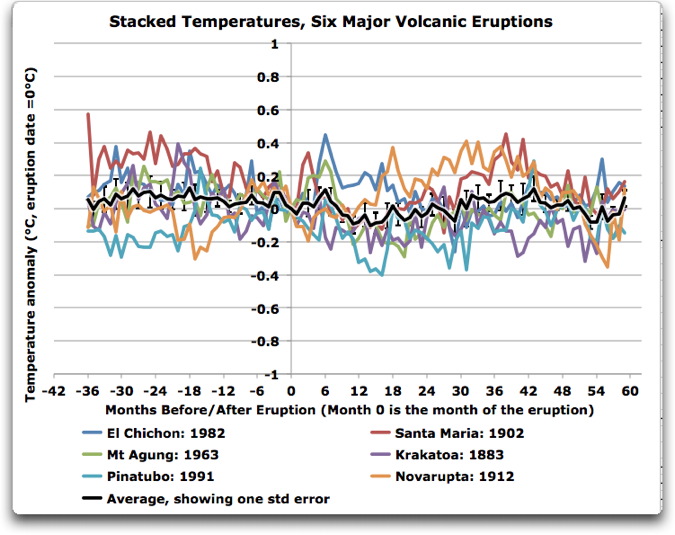
Figure 2. Stacked records of the six major volcanoes. Individual records show from three years before to five years after each eruption. The anomalies are expressed as variations around the temperature of the month of the eruption. The black heavy line shows the average of the data. Black vertical lines show the standard error of the average.
The black line is the average of the stacked records, month by month. Is there a signal there? Well, there is a temperature drop starting about six months after the eruptions, with a maximum of a tenth of a degree. However, El Chichon is clearly an outlier in this regard. Without El Chichon, the signal gets about 50% stronger.

Figure 3. As in Figure 3, omitting the record for El Chichon.
Since I’m looking for the common response, and digging to find the signal, I will leave out El Chichón as an outlier.
But note the size of the temperature response. Even leaving out El Chichon, this is so small that it is not at all clear if the effect shown is even real. I do think it is real, just small, but in either case it’s a very wimpy response.
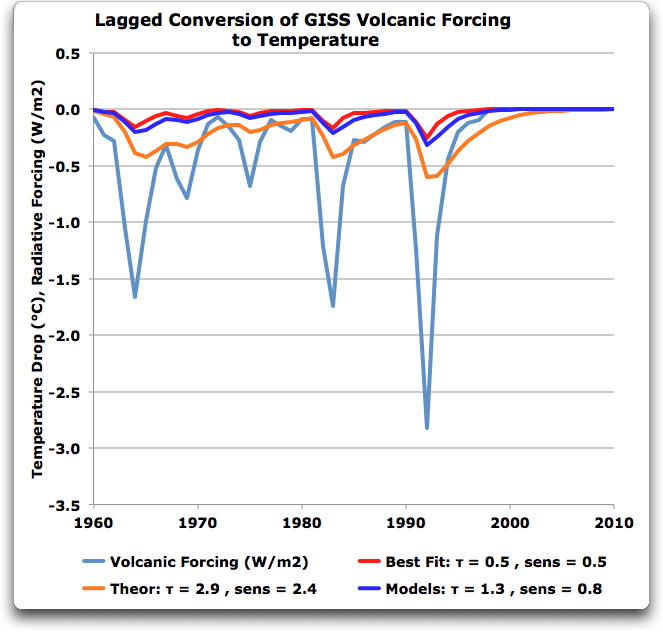
To properly judge the response, however, we need to compare it to the expected response under various scenarios. Figure 3 shows the same records, with the addition of the results from the average models from the Forster study, the results that the models were calculated to have on average, and the results if we assume a climate sensitivity of 3.0 W/m2 per doubling of CO2. Note that in all cases I’m referring the equilibrium climate sensitivity, not the transient climate response, which is smaller. I have used the lagged linear equation developed in my study of the Forster data (first cite above) to show the theoretical picture, as well as the model results.
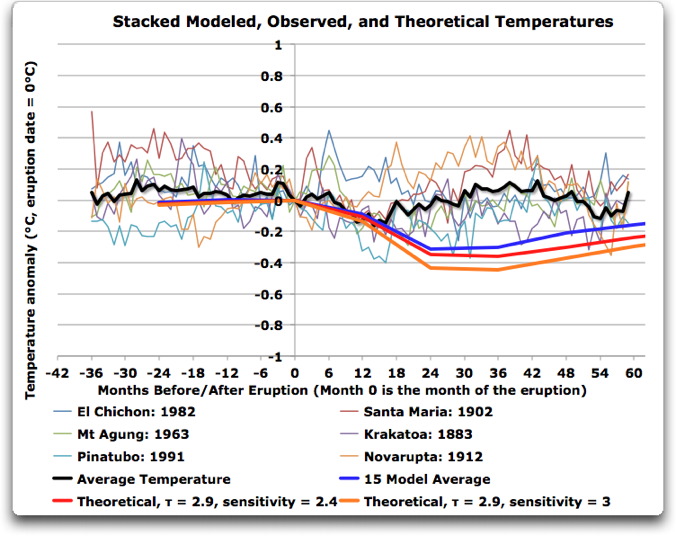
Figure 4. Black line shows the average of the monthly Hadcrut temperatures. Blue line shows the average of the modeled annual temperatures from the 15 climate models in the Forster paper, as discussed here. The red line shows what the models would have shown if their sensitivity were 2.4°C per doubling of CO2, the value calculated from the Forster model results. Finally, the orange line shows the theoretical results for a sensitivity of 3°C per doubling. In the case of the red and orange lines, the time constant of the Forster models (2.9 years) was used with the specified sensitivity. Tau ( τ ) is the time constant. The sensitivity is the equilibrium climate sensitivity of the model, calculated at 1.3 times the transient climate response.
The theoretical responses are the result of running the lagged linear equation on just the volcanic forcings alone. This shows what the temperature change from those volcanic forcings will be for climate models using those values for the sensitivity (lambda) and the time constant (tau).
Now here, we see some very interesting things. First we have the model results in blue, which are the average of the fifteen Forster models’ output. The models get the first year about right. But after that, in the model and theoretical output, the temperature decreases until it bottoms out between two and three years after the eruption. Back in the real world, by contrast, the average observations bottom out by about one year, and have returned to above pre-eruption values within a year and a half. This is a very important finding. Notice that the models do well for the first year regardless of sensitivity. But after that, the natural restorative mechanisms take over and rapidly return the temperature to the pre-eruption values. The models are incapable of making that quick a turn, so their modeled temperatures continue falling.
Not only do the actual temperatures return to the pre-eruption value, but they rise above it before finally returning to the that temperature. This is the expected response from a governed, lagged system. In order to keep a lagged system in balance, if the system goes below the target value for a while, it need to go above that value for a while to restore the lost energy and get the system back where it started. I’ll return to this topic later in the post. This is an essential distinction between governors and feedbacks. Notice that once disturbed, the models will never return to the starting temperature. The best they can do is approach it asymptotically. The natural system, because it is governed, swings back shortly after the eruption and shoots above the starting temperature. See my post Overshoot and Undershoot for an earlier analysis and discussion of governors and how they work, and the expected shape of the signal.
The problem is that if you want to represent the volcanoes accurately, you need a tiny time constant and an equally tiny sensitivity. As you can see, the actual temperature response was both much smaller and much quicker than the model results.
This, of course, is the dilemma that the modelers have been trying to work around for years. If they set the sensitivity of their models high enough to show the (artificially augmented) CO2 signal, the post-eruption cooling comes out way, way too big. If they cut the sensitivity way, way down to 0.8° per doubling of CO2 … then the CO2 signal is trivially small.
Now, Figure 4 doesn’t look like it shows a whole lot of difference, particularly between the model results (blue line) and the observations. After all, they come back close to the observations after five years or so.
What can’t be seen in this type of analysis is the effect that the different results have on the total system energy. As I mentioned above, getting back to the same temperature isn’t enough. You need to restore the lost energy to the system as well. Here’s an example. Some varieties of plants need a certain amount of total heat over the growing season in order to mature. If you have ten days of cool weather, your garden doesn’t recover just because the temperature is now back to what it was before. The garden is still behind in the total heat it needs, the total energy added to the garden this season is lower than it would have been otherwise.
So after ten days of extra cool weather, your garden needs ten days of warm weather to catch up. Or perhaps five days of much warmer weather. The point is that it’s not enough to return the temperature to its previous value. We also need to return the total system energy to its previous value.
To measure this variation, we use “degree-days”. A degree-day is a day which is one degree above from some reference temperature. Ten degree-days could be five days that are two degrees warmer than usual, or two days that are five degrees warmer than usual. As in the example with the garden, degree-days accumulate over time, with warmer (positive) degree days offsetting cooler (negative) degree days. For the climate, the corresponding unit is a degree-month or a degree year. To convert monthly temperature into degree-months, you simply add each months temperature difference from the reference to the previous total. The record of degree-months, in other word, is simply the cumulative sum of the temperature differences from the date of the eruption.
What does such a chart measure? It measures how far the system is out of energetic balance. Obviously, after a volcano the system loses heat. The interesting thing is what happens after that, how far out of balance the system goes, and how quickly it returns. I’ve left the individual volcanoes off of this graph, and only shown the stack averages.
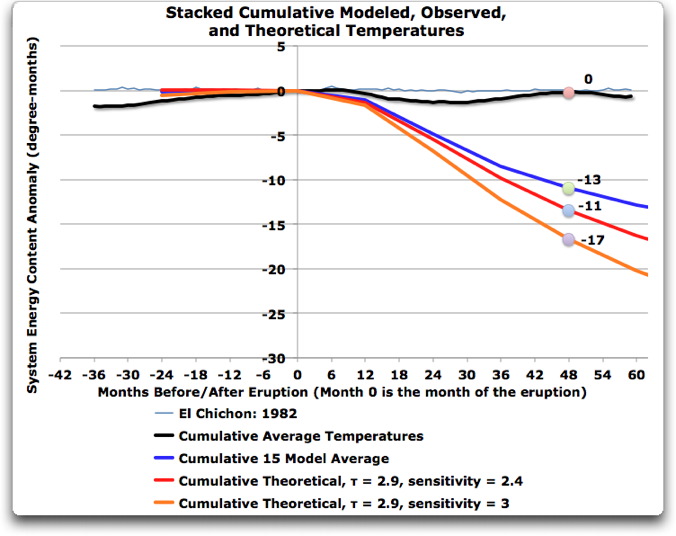
Figure 5. Cumulative record of degree-months of energy loss and recovery after the eruptions. Circles show the net energy loss in degree-months four years after the eruption.
Remember that I mentioned above that in a governed system, the overshoot above the original temperature is necessary to return the system to its previous condition. This overshoot is shown in Figure 3, where after the eruptions the temperatures rise above their original values. The observations show that the earth returned to its original temperature after 18 months. The results in Figure 5 show that it took a mere 48 months to regain the lost energy entirely. Figure 5 shows that the actual system quickly returned to the original energy condition, no harm no foul.
By contrast, the models take much larger swings in energy. After four years, the imbalance in the system is still increasing.
Now folks, look at the difference between what the actual system does (black line) and what happens when we model it with the IPCC sensitivity of 3° per doubling, or even the model results … I’m sorry, but the idea that you can model volcanic eruptions using the current paradigm simply doesn’t work. In a sane world, Figure 5 should sink the models without a trace, they are so very far from the reality.
We can calculate the average monthly energy shortage in the swing away from and back to the zero line by dividing the area under the curve by the time interval. Nature doesn’t like big swings, this kind of response that minimizes the disturbance is common in nature. Here are those results, the average energy deficit the system was running over the first four years.
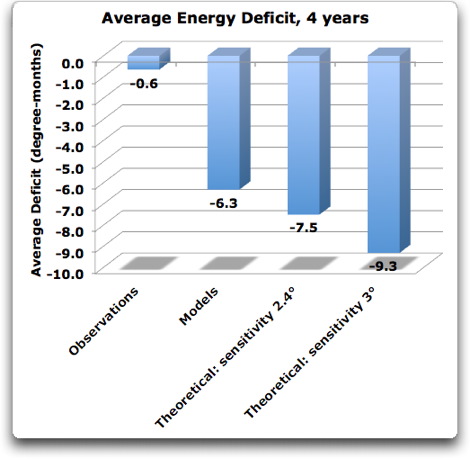
Figure 6. Average energy deficit over the first four years after the eruption.
In this case, the models are showing an average energy deficit that is ten times that of the observations … and remember, at four years the actual climate is back to pre-eruption conditions, but the models’ deficit is still increasing, and will do so for several more years before starting back towards the line.
CONCLUSIONS
So what can we conclude from these surprising results?
The first and most important conclusion is that the climate doesn’t work the way that the climate paradigm states— it is clearly not a linear response to forcing. If it were linear, the results would look like the models. But the models are totally unable to replicate the rapid response to the volcanic forcings, which return to pre-existing temperatures in 18 months and restore the energy balance in 48 months. The models are not even close. Even with ridiculously small time constant and sensitivity, you can’t do it. The shape of the response is wrong.
I hold that this is because the models do not contain the natural emergent temperature-controlling phenomena that act in concert to return the system to the pre-catastrophic condition as soon as possible.
The second conclusion is that the observations clearly show the governed nature of the system. The swing of temperatures after the eruptions and the quick return of both temperature and energy levels to pre-eruption conditions shows the classic damped oscillations of a governed system. None of the models were even close to being able to do what the natural system does—shake off disturbances and return to pre-existing conditions in a very short time.
Third conclusion is that the existing paradigm, that the surface air temperature is a linear function of the forcing, is untenable. The volcanoes show that quite clearly.
There’s probably more, but that will do for the present.
TESTABLE PREDICTION
Now, we know that the drops in forcing from volcanoes are real, we’ve measured them. And we know that the changes in global temperature after eruptions are way tiny, a tenth of a degree or so. I say this is a result of the action of climate phenomena that oppose the cooling.
A corollary of this hypothesis is that although the signal may not be very detectable in the global temperature itself, for that very reason it should be detectable in the action of whatever phenomena act to oppose the volcanic cooling.
So that was my prediction, that if my theory were correct, we should see a volcanic signal in some other part of the climate system involved in governing the temperature. My first thought in this regard, of course, was the El Nino/La Nina pump that moves warm Pacific water from the tropics to the poles.
The snag with that one, of course, is that the usual indicator for El Nino is the temperature of a patch of tropical Pacific ocean called the Nino3.4 area. And unfortunately, good records of those temperatures go back to about the 1950s, which doesn’t cover three of the volcanoes.
A second option, then, was the SOI index, the Southern Oscillation Index. This is a very long-term index that measures the difference in the barometric pressures of Tahiti, and Darwin, Australia. It turns out that it is a passable proxy for the El Nino, but it’s a much broader index of Pacific-wide cycles. However, it has one huge advantage. Because it is based on pressure, it is not subject to the vagaries of thermometers. A barometer doesn’t care if you are indoors or out, or if the measurement location moves 50 feet. In addition, the instrumentation is very stable and accurate, and the records have been well maintained for a long time. So unlike temperature-based indices, the 1880 data is as accurate and valid as today’s data. This is a huge advantage … but it doesn’t capture the El Ninos all that well, which is why we use the Nino3.4 Index.
Fortunately, there’s a middle ground. This is the BEST index, which stands for the Bivariate ENSO Timeseries. It uses an average of the SOI and the Nino 3.4 data. Since the SOI has excellent data from start to finish, it kind of keeps the Nino3.4 data in line. This is important because the early Nino3.4 numbers are from reanalysis models in varying degrees at various times, so the SOI minimizes that inaccuracy and drift. Not the best, but the best we’ve got, I guess.
Once again, I wanted to look at the cumulative degree-months after the eruptions. If my theory were correct, I should see an increase in the heat contained in the Pacific Ocean after the eruptions. Figure 6, almost the last figure in this long odyssey, shows those results.

Figure 6. Cumulative index-months of the BEST index. Positive values indicate warmer conditions. Krakatoa is an obvious outlier, likely because it is way back at the start of the BEST data where the reconstruction contains drifts.
Although we only find a very small signal in the global temperatures, looking where the countervailing phenomena are reacting to neutralize the volcanic cooling shows a clearer signal of the volcanic forcing … in the form of the response that keeps the temperature from changing very much. When the reduction in sunlight occurs following an eruption, the Pacific starts storing up more energy.
And how does it do that? One major way is by changing the onset time of the tropical clouds. In the morning the tropics is clear, with clouds forming just before noon. But when it is cool, the clouds don’t form until later. This allows more heat to penetrate the ocean, increasing the heat content. A shift of an hour in the onset time of the tropical clouds can mean a difference of 500 watt-hours/m2, which averages over 24 hours to be about 20 W/m2 continuous … and that’s a lot of energy.
One crazy thing is that the system is almost invisible. I mean, who’s going to notice if on average the clouds are forming up a half hour earlier? Yet that can make a change of 10 W/m2 on a 24-hour basis in the energy reaching the surface, adds up to a lot of watt-hours …
So that’s it, that’s the whole story. Let me highlight the main points.
• Volcanic eruptions cause a large, measurable drop in the amount of solar energy entering the planet.
• Under the current climate paradigm that temperature is a slave to forcing with a climate sensitivity of 3 degrees per doubling of CO2, these should cause large, lingering swings in the planet’s temperature.
• Despite the significant size of these drops in forcing, we see only a tiny resulting signal in the global temperature.
• This gives us two stark choices.
A. Either the climate sensitivity is around half a degree per doubling of CO2, and the time constant is under a year, or
B. The current paradigm of climate sensitivity is wrong and forcings don’t determine surface temperature.
Based on the actual observations, I hold for the latter.
• The form (a damped oscillation) and speed of the climate’s response to eruptive forcing shows the action of a powerful natural governing system which regulates planetary temperatures.
• This system restores both the temperature and the energy content of the system to pre-existing conditions in a remarkably short time.
Now, as I said, I started out to do this volcano research and have been diverted into two other posts. I can’t tell you the hours I’ve spent thinking about and exploring and working over this analysis, or how overjoyed I am that it’s done. I don’t have a local church door to nail this thesis to, so I’ll nail it up on WUWT typos and all and go to bed. I think it is the most compelling evidence I’ve found to date that the basic climate paradigm of temperatures slavishly following the forcings is a huge misunderstanding at the core of current climate science … but I’m biased in the matter.
As always, with best wishes,
w.
APPENDICES
UNITS
Climate sensitivity is measured in one of two units. One is the increase in temperature per watt/m2 of additional forcing.
The other is the increase in temperature from a doubling of CO2. The doubling of CO2 is said to increase the forcing by 3.7 watts. So a sensitivity of say 2°C per doubling of CO2 converts to 2/3.7 = 0.54 °C per W/m2. Using the “per doubling” units doesn’t mean that the CO2 is going to double … it’s just a unit.
DATA
Let’s see, what did I use … OK, I just collated the Otto and Forster net radiative forcings, the Forster 15 model average temperature outputs, the GISS forcing data, and the dates of the eruptions into a single small spreadsheet, under a hundred k of data, it’s here.
METHOD
The method depends on the fact that I can closely emulate the output of either individual climate models, or the average output of the unruly mobs of models called “ensembles” using a simple lagged linear equation. The equation has two adjustable parameters, the time constant “tau” and the climate sensitivity lambda. Note that this is the transient sensitivity and not the equilibrium sensitivity. As you might imagine, because the earth takes time to warm, the short-term change in temperature is smaller than the final equilibrium change. The ratio between the two is fairly stable over time, at about 1.3 or so. I’ve used 1.3 in this paper, the exact value is not critical.
Using this lagged linear equation, then, I simply put in the list of forcings over time, and out comes the temperature predictions of the models. Here’s an example of this method used on the GISS volcanic forcing data:
Lambda (a measure of sensitivity) controls the amplitude, while tau controls how much the data gets “smeared” to the right on the graph. And sad to say, you can emulate any climate model, or the average of a bunch of models, with just that … see my previous posts referenced above for details about the method.
INDIVIDUAL RECORDS
Here are the most recent six eruptions, eruptions that caused large reductions in the amount of sunlight reaching the earth, with the date of the eruptions shown in red.


next question is where does the heat go when it gets pumped into the troposphere by tropical storms. Some will get radiaited to space , the rest goes gets transported to higher latitudes via Hadley circulation. (Yeah Hadley as in Hadley Centre).
It is interesting to look at the length of the Arctic melting season in relation to the tropical SST Willis is considering as governor.
http://climategrog.wordpress.com/?attachment_id=276
atarsinc says:
May 25, 2013 at 1:48 pm
————————————–
Without invoking Goddess Gaia, it seems clear to me that Mother Earth is homeostatic. The rare runaway positive feedbacks in the climatic record are quickly (at least in geo-time) regulated. Possible exceptions are the Snowball Earth episodes, to the extent that they actually happened, when correction may have taken much longer than usual.
Your example of the inception of Pleistocene & future ice ages from interglacials, as now, is not IMO an instance of our planet’s self-regulating system breaking down but of moving into a new mode, during which the same processes still operate. In interglacials Earth maintains its average temperature (to the extent that global temperature is a valid concept), let’s say, around 15 degrees C, while in glacial mode it might be 5-10 C (actual figures don’t matter, as merely illustrative here). Of course there are periods of excursions below & above the average, as around Heinrich Events, which could count as a third & coldest mode, more extreme than the mean glacial phase climate.
Margaret Hardman says:
May 25, 2013 at 2:26 pm
John B
Bad luck. Try your guessing game again. I am she as you are she and we are altogether.
You are the egg-man?
One could also just look at the Transient Climate sensitivity here.
Let’s take the Pinatubo example where forcing was between -3.0 W/m2 to -4.0 W/m2 (the higher number is from other sources).
Temperatures declined between -0.3C to -0.4C.
Transient Climate Sensivity = 0.1C / W/m2.
Otto 2013 has it at = 1.3C / 3.7W/m2 = 0.35C / W/m2; The IPCC AR4 and AR5 has it at about 2.0C / 4.2 W/m2 = 0.48C / w/m2
So, Pinatubo was just 72% lower that the new lower ECS of Otto 2013 and 79% lower than the IPCC.
And then compared the the Equilibrium Climate Sensitivity of 0.81C / W/m2, it is only 88% lower.
So, 72%, 79%, 88% lower – take your pick.
The caption to Figure 4 says, “Blue line shows the average of the modeled annual temperatures from the 15 climate models in the Forster paper, as discussed here.”
Was there supposed to be a link at “here” to a posting on the Foster paper?
The Foster paper, Table 1 shows 19 models, not 15 models. I tried to replicate your blue line from the annual data, column 3 of your “Forcings and Models.xlsx” file. The average model temperature of the year after the 6 volcano eruptions was 1.23 Celsius less than the average model temperature of the year before each of the 6 eruptions. This is very different from your blue line where the 24 month value is only 0.3 C less than the 0 month value. How did you calculate the blue line?
The average climate sensitivity of the climate models used by the IPCC is 3°C per doubling, the orange line. Why is the climate sensitivity of the 15 models in the Foster paper, calculated at 2.4 C, so much lower?
The paragraph above Figure 4 says, “Figure 3 shows the same records, with the addition of the results from the average models from the Forster study, the results that the models were calculated to have on average, and the results if we assume a climate sensitivity of 3.0 W/m2 per doubling of CO2.” Correction: Change “Figure 3” to “Figure 4”.
milodonharlani says:
May 25, 2013 at 3:13 pm
Milo, I believe you’ve made my case. Probably better than I. JP
onlyme says:
May 25, 2013 at 5:46 am
When you work in the real world with controlled processes and the PID controllers which keep the processes in control, you see strong evidence of bounce, lag and settling time which you refer to.
Yes, the PID analogy is interesting. Let’s see what we have:
plank radiation is T^4 but with fairly small variation in tropical SST in relation to the absolute temperature in kelvin, it can be approximated as linear.
Now the radiation is W/m2 , ie a power term, this is equivalent to dT/dt, so we have a D for our PID.
The conditions that trigger tropical storms are a fairly fixed local temperature to set off the positive feedback that sets off the emergent phenomenon of TS. As long as there is a finite number of storms This will tend to ensure the long term average does not drift off. This was demonstrated by Willis’ degree.day plots. We have the I for our PID.
Evaporation (outside the storms) is proportional to the temperature so , if it is not too much of a gross simplification, we have the P for out PID.
Now I’m not sure that God rides a Harley , but he’s a damn good systems engineer.
clipe says:
May 25, 2013 at 3:14 pm
Margaret Hardman says:
May 25, 2013 at 2:26 pm
John B
Bad luck. Try your guessing game again. I am she as you are she and we are altogether.
“You are the egg-man?”
Walrus I’m thinking.
http://www.jabberwocky.com/carroll/pics/glass20.gif
The Walrus and The Carpenter
Lewis Carroll
(from Through the Looking-Glass and What Alice Found There, 1872)
The sun was shining on the sea,
Shining with all his might:
He did his very best to make
The billows smooth and bright–
And this was odd, because it was
The middle of the night.
The moon was shining sulkily,
Because she thought the sun
Had got no business to be there
After the day was done–
“It’s very rude of him,” she said,
“To come and spoil the fun!”
The sea was wet as wet could be,
The sands were dry as dry.
You could not see a cloud, because
No cloud was in the sky:
No birds were flying overhead–
There were no birds to fly.
The Walrus and the Carpenter
Were walking close at hand;
They wept like anything to see
Such quantities of sand:
“If this were only cleared away,”
They said, “it would be grand!”
“If seven maids with seven mops
Swept it for half a year.
Do you suppose,” the Walrus said,
“That they could get it clear?”
“I doubt it,” said the Carpenter,
And shed a bitter tear.
“O Oysters, come and walk with us!”
The Walrus did beseech.
“A pleasant walk, a pleasant talk,
Along the briny beach:
We cannot do with more than four,
To give a hand to each.”
The eldest Oyster looked at him,
But never a word he said:
The eldest Oyster winked his eye,
And shook his heavy head–
Meaning to say he did not choose
To leave the oyster-bed.
But four young Oysters hurried up,
All eager for the treat:
Their coats were brushed, their faces washed,
Their shoes were clean and neat–
And this was odd, because, you know,
They hadn’t any feet.
Four other Oysters followed them,
And yet another four;
And thick and fast they came at last,
And more, and more, and more–
All hopping through the frothy waves,
And scrambling to the shore.
The Walrus and the Carpenter
Walked on a mile or so,
And then they rested on a rock
Conveniently low:
And all the little Oysters stood
And waited in a row.
“The time has come,” the Walrus said,
“To talk of many things:
Of shoes–and ships–and sealing-wax–
Of cabbages–and kings–
And why the sea is boiling hot–
And whether pigs have wings.”
“But wait a bit,” the Oysters cried,
“Before we have our chat;
For some of us are out of breath,
And all of us are fat!”
“No hurry!” said the Carpenter.
They thanked him much for that.
“A loaf of bread,” the Walrus said,
“Is what we chiefly need:
Pepper and vinegar besides
Are very good indeed–
Now if you’re ready, Oysters dear,
We can begin to feed.”
“But not on us!” the Oysters cried,
Turning a little blue.
“After such kindness, that would be
A dismal thing to do!”
“The night is fine,” the Walrus said.
“Do you admire the view?
“It was so kind of you to come!
And you are very nice!”
The Carpenter said nothing but
“Cut us another slice:
I wish you were not quite so deaf–
I’ve had to ask you twice!”
“It seems a shame,” the Walrus said,
“To play them such a trick,
After we’ve brought them out so far,
And made them trot so quick!”
The Carpenter said nothing but
“The butter’s spread too thick!”
“I weep for you,” the Walrus said:
“I deeply sympathize.”
With sobs and tears he sorted out
Those of the largest size,
Holding his pocket-handkerchief
Before his streaming eyes.
“O Oysters,” said the Carpenter,
“You’ve had a pleasant run!
Shall we be trotting home again?’
But answer came there none–
And this was scarcely odd, because
They’d eaten every one.
Bill Illis says:
“The El Ninos that developed after El Chichon and Pinatubo were already well into development before the volcanoes.”
That’s the other external short term forcing agent at work:
http://omniweb.gsfc.nasa.gov/tmp/images/ret_13439.gif
http://omniweb.gsfc.nasa.gov/tmp/images/ret_13542.gif
accompanied by low land temp’s in winter 1981-82, and early 1991.
Bill Inis: Let’s take the Pinatubo example where forcing was between -3.0 W/m2 to -4.0 W/m2 (the higher number is from other sources).
Temperatures declined between -0.3C to -0.4C.
Where do you see that temp drop Bill?
I see about -0.18 K, of which some is attributable to a pre-existing downward trend.
give it a large half at 0.1K with a forcing of at least 0.3 that gives a transient response of 0.033 K/W/m2
/Basically, I’m offering you the opportunity to read my laboratory notebook as I’m working on the issues, and you complain that it’s not a finished scientific paper?/
I am probably too easily embarrassed. I would never publish my lab notebook! But that’s me! 😀
/I say that after an eruption, the climate system actively responds to reductions in the incoming sunlight by altering various parts of the climate system to increase the amount of heat absorbed by other means./
Actively? That pushes it a bit too far for my taste.
Sure, after a volcanic eruption, the ash and aerosols diminish surface temperatures by blocking sunlight reaching the earth’s surface. A temporary effect as both ash and aerosols get washed out over a couple of years.
But I see no need to posit an ‘actively’ responding climate system. First of all, if surface temps decrease so does outgoing radiation. Secondly, the lower temperature may result in growing of ice sheets and snow in polar regions which may ‘take out part of the cold’ for the surface temperatures for years to come. Third, there is lots of thermal inertia in the climate system, especially in the oceans. When the effects of the eruption start to linger the heat content of the oceans may quickly bring back the surface temperatures to near pre-eruption levels. Also, there is no accounting for ongoing other forcing effects in this analysis, as others have already mentioned.
Summarizing I don’t see any need yet for positing an effect of tropical cloud onset time. If you could show with data that this changed after volcanic eruptions, then I might consider it.
Margaret Hardman says:
May 25, 2013 at 4:44 am
In the middle of marking university entrance individual studies/investigations. I would not give this a good mark. There are lots of confounding factors not taken into account, for example: how long do the particles erupted into the atmosphere remain there? What criteria are used for selecting the eruptions (there were twelve VEI 5 or 6 eruptions in the 20th century)? 14 eruptions would have given a better sample. Are the results statistically significant?
What effect did the eruption of Mount Hudson have in such close temporal proximity to Mt Pinatubo (VEI 5+ and 6 respectively)? Can you unpick the effects of the two eruptions? How much material was erupted into the atmosphere at these eruptions and the other eruptions? Can we see local effects and how far do those effects extend?
The conclusion needs to have strong valid evidence to support it which appears to be missing. Because unsubstantiated assumptions are made in this post, the assertions remain speculative at best and most probably wrong. There will be those that pick that last sentence out for criticism so I shall answer it now. Firstly, taking a simple equation that models part of the behaviour of the climate system and showing it might be wrong does not invalidate all climate models. I believe there are 19 models referenced by the IPCC. Even if this equation is fundamental to them all, the evidence here does not invalidate it.
I know nothing of the author but I would suspect they have not used their full scientific training in the production of this short article. Had they done so, they would have spent a considerable time looking in detail at the possible confounding factors surrounding the global temperatures for each of these eruptions and those that were left out.
Margaret, your arguments are missing the point: Willis has shown that the respective models do a very poor work in modeling volcanic forcings for the respective data analyzed.
You may want to give examples that fit closer to reality or reasons why they might miss in these cases.
The conclusion is strongly supported by the data shown, your comment is missing the points made and is not supported by anything. You do not bring arguments to what has been presented or new facts. Your words like “unsubstantiated assumptions” are just empty words as long as you do not show which/where such assumptions have been made, (which you fail miserably).
Nobody took “a simple equation that models part of the behaviour of the climate system”. Please read the post and try to understand it before you post answers. Trying to show yourself clever and showing you did not understand the basics of what has been said is really a bad start.
Furthermore you continue to say that what has been presented does not invalidate the models.
However we see that the respective models did a very poor job in modeling the climate post eruptions, actually missed in all examples. Just stating that without arguments is useless.
What you do is then ad-hominem. Whom do you try to impress here with empty words?
@Nick Stokes
Well, “canonical”, “current paradigm” – I’d expect you could actually quote scientists saying those things. Instead you just refer me to posts where you’re saying them.
I’ve gone through above what Forster et al say, and Otto et al, and it isn’t their paradigm. Otto specifically says that a proportional relation is not ot be expected after a volcano. So whose is it?
Nick, stop arguing semantics. No-one cares (including you).
Has Willis actually correctly shown the response of the models to volcanoes or not? Yes or no?
If you can show that the models don’t work as Willis claims, then do so. Don’t talk of “paradigms” and who has says what when, but show us how they actually model the results of major eruptions.
You won’t do so, of course, because semantics aside, Willis is basically correct in how they work. Reduced forcings lead directly to a cooling effect that is never negated, but continues indefinitely. And you can’t handle that.
Willis,
As others have mentioned, that last sentence needs to be changed to reference Tambora which erupted for over a week in April 1815 helping to cause the Year Without A Summer in 1816. The wikipedia information says it was at least four times the blast of Krakatoa, which is a really huge.
The effects of Krakatoa, occurring in the more modern era of 1883, are well-known. In fact when I was a kid in the 50’s it was commonly associated with the legendary 1888 blizzards in NYC and vicinity. These days those effects are seldom mentioned but it has always stuck with me and now I automatically expect at least a 5-year window to notice after-effects of large blasts like that. I suppose the main factor is what latitude it occurs at and whether it sends enough particulates into the stratosphere. Consequently precipitation must also be directly related to these blasts as they would seem to be excellent seeders for creation of raindrops and snowflakes.
Interestingly, that linked wiki page has a table called “Selected Volcanic Eruptions” that includes Northern Hemisphere Summer Anomaly for the eruptions and what jumps out is how there were several consecutive dips in temperature and long gaps with no change:
Kuwae 1452 -0.5°C
Huaynaputina 1600 -0.8°C
Tambora 1815 -0.5°C
Krakatoa 1883 -0.3°C
Santa Maria 1902 (none)
Novarupta 1912 -0.4°C
Mt. St. Helens 1980 (none)
El Chichón 1982 (yes) <– but what?
Nevado del Ruiz 1985 (none)
Pinatubo 1991 -0.5°C
So pretty much the entire alleged warming delta is routinely matched by periodic eruptions which means that citing a normal temperature within 0.5°C is futile, and temperature consistency relies solely on the fact of whether one is in a long eruption-less dry-spell or not. Somewhere there must be a complete list of all known eruptions and temperature anomalies, if not there ought to be.
Margaret Hardman says:
May 25, 2013 at 2:26 pm
“John B
Bad luck. Try your guessing game again. I am she as you are she and we are altogether.”
I’m guessing… Rob Ford.
Blade
As with so many volcanic eruptions (1258 is another example) the temperature had already been declining sharply BEFORE the eruption and bounced back very strongly afterwards
http://www.metoffice.gov.uk/hadobs/hadcet/
So how much effect it had is debatable as temperatures were declining anyway, but any effect it might have had was short lived
tonyb
Margaret Hardman is…Margaret Hardman of Leeds University.
I claim my £50 prize
Tonyb
Mooloo says: May 25, 2013 at 4:18 pm
“You won’t do so, of course, because semantics aside, Willis is basically correct in how they work. Reduced forcings lead directly to a cooling effect that is never negated, but continues indefinitely. And you can’t handle that.”
That’s completely wrong. Here is the plot of the 19-model average. It recovers from every eruption. No indefinite cooling effect – it rises 1°C over the period.
“If you can show that the models don’t work as Willis claims, then do so.”
Well, Willis claims that they track a lagged forcing of averages, and they do. But so do real temperatures. And if you want to show a regression of ΔT against ΔF for real temperatures, then it’s Forster’s Fig 6B, which also shows how the relation breaks down for volcanoes. Fig 4b shows the same effect for model HADCM3. So this behaviour is not a black mark against models.
The issue of the “current paradigm” isn’t semantics. Willis has laid out his post systematically – theory, investigations, conclusions and prediction. And the theory section is based on this paradigm. And then, in the conclusions:
“The first and most important conclusion is that the climate doesn’t work the way that the climate paradigm states— it is clearly not a linear response to forcing. If it were linear, the results would look like the models.”
First and most important. But that isn’t the climate paradigm, and it’s not how models work. That’s relevant.
Your most interesting and compelling post yet, Willis. Well done.
@Dale Rainwater. Stefan Weiss (May 25, 2013 at 8:42 am)
A stimulating comment. Thank you.
____
@Greg Goodman (May 25, 2013 at 7:06 am)
Busy month — will have to wait for opportunity to discuss at level more than superficial.
Best Regards.
Has there been any studies on effects of solar eclipses on temperatures? The calculation of reduced solar insolation can be highly accurately calculated in this case.
Nick Stokes says:
May 25, 2013 at 11:21 am
Nick, the models themselves use that exact formula, ∆T = λ ∆F. What do you think I’ve been talking about? I just got through showing that the average of the climate models can be almost perfectly replicated using THAT EXACT FORMULA in its normal lagged version … and now you ask who uses the formula? Pay attention much?
Now, when the outcome of the current group of climate models, both singly and en masse, can be replicated by a single formula, then I think I’m justified in calling it “canonical”.
You really do need to follow the bouncing ball a bit more closely, Nick.
w.
Margaret Hardman says:
May 25, 2013 at 11:40 am
Margaret, to date you have not found a single flaw in my analysis. Yes, you’ve suggested avenues for further investigation, but you haven’t found one damn thing wrong with my work itself. Oh, you made yourself look stupid by babbling about the aerosols and how long they stayed in the air, not realizing that that all of that has been taken care of in the creation of the forcing dataset.
And other than your ill-advised foray into aerosols, mostly what you’ve been is patronizing and offensive.
So I fear that you complaining that the attack is ad hominem misses the point. You haven’t given us one scrap of scientific anything to work over and discuss … so people will naturally turn the discussion to your bad manners, and I can hardly blame them. My first response to you was … well, I was very unhappy with your priggish prima donna stance. But I toned it down, and tried to fill the hole between your ears … but given this latest response, I fear the task may be beyond my abilities.
The game’s not over, but it is late in the game for you. If you have some real scientific comment on my study to make, I’d suggest you make it now, and loud and clear, and you might stand a chance of salvaging your reputation.
w.
PS—You entered into this discussion and opened with an ad hominem, that I had not used my “full scientific training in the production of this short article”. That says nothing about the science, Margaret. It is nothing but a personal attack on me.
So you can take your whining about mean people posting ad hominems about you, and place it gently up your fundamental orifice. I don’t care for your style in the slightest, and your latest bitching about exactly what you started by doing just confirms my earlier impressions.
Willis,
Nick, the models themselves use that exact formula, ∆T = λ ∆F.
Is it so hard to give a quote?
‘can be replicated by a single formula, then I think I’m justified in calling it “canonical”.’
But you called it their canonical equation. Whose?
The formula that you showed achieved replication wasn’t ∆T = λ ∆F. Lagged exponential smoothing makes a big difference.