Guest Post by Willis Eschenbach
Well, this has been a circuitous journey. I started out to research volcanoes. First I got distracted by the question of model sensitivity, as I described in Model Climate Sensitivity Calculated Directly From Model Results. Then I was diverted by the question of smoothing of the Otto data, as I reported on in Volcanoes: Active, Inactive, and Retroactive. It’s like Mae West said, “I started out as Snow White … but then I drifted.” The good news is that in the process, I gained the understanding needed to direct my volcano research. Read the first of the links if you haven’t, it’s a prelude to this post.
Unlike the situation with say greenhouse gases, we actually can measure how much sunlight is lost when a volcano erupts. The volcano puts reflective sulfur dioxide into the air, reducing the sunlight hitting the ground. We’ve measured that reduction from a variety of volcanoes. So we have a reasonably good idea of the actual change in forcing. We can calculate the global reduction in sunlight from the actual observations … but unfortunately, despite the huge reductions in global forcing that volcanoes cause, the global temperature has steadfastly refused to cooperate. The temperature hasn’t changed much even with the largest of modern volcanoes.
Otto et al. used the HadCRUT4 dataset in their study, the latest incarnation from the Hadley Centre and the Climate Research Unit (CRU). So I’ll use the same data to demonstrate how the volcanoes falsify the climate models.
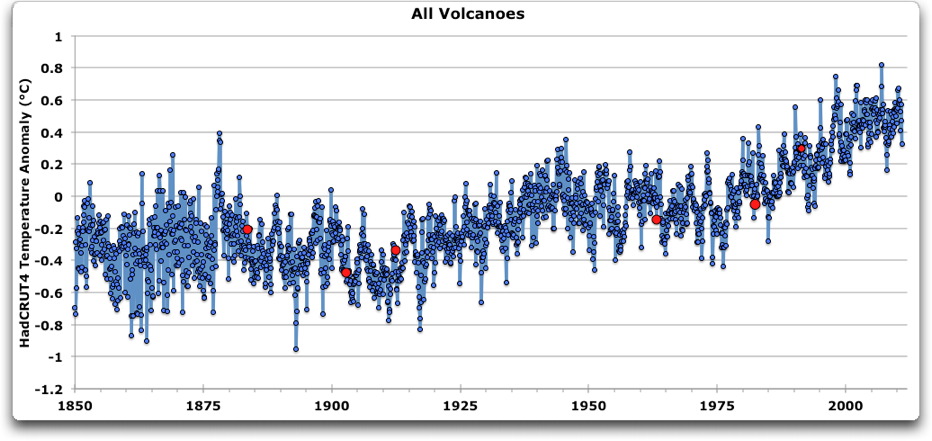
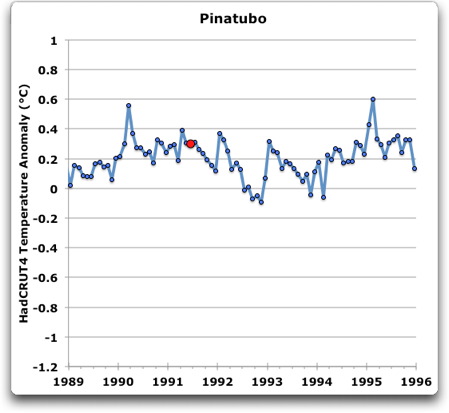
Figure 1. Monthly HadCRUT4 global surface air temperatures. The six largest modern volcanoes are indicated by the red dots.
This post will be in four parts: theory, investigation, conclusions, and a testable prediction.
![]() THEORY
THEORY
Volcanoes are often touted as a validation of the climate models. However, in my opinion they are quite the opposite—the response of the climate to volcanoes clearly demonstrates that the models are on the wrong path. As you may know, I’m neither a skeptic nor a global warming supporter. I am a climate heretic. The current climate paradigm says that the surface air temperature is a linear function of the “forcing”, which is the change in downwelling radiant energy at the top of the atmosphere . In other words, the current belief is that the climate can be modeled as a simple system, whose outputs (global average air temperatures) are a linear function of the SUM of all the various forcings from greenhouse gas changes, volcanoes, solar changes, aerosol changes, and the like. According to the theory, you simply take the total of all of the forcings, apply the magic formula, and your model predicts the future. Their canonical equation is:
Change in Temperature (∆T) = Change in Forcing (∆F) times Climate Sensitivity
In lieu of a more colorful term, let me say that’s highly unlikely. In my experience, complex natural systems are rarely that simply coupled from input to output. I say that after an eruption, the climate system actively responds to reductions in the incoming sunlight by altering various parts of the climate system to increase the amount of heat absorbed by other means. This rapidly brings the system back into equilibrium.
The climate modelers are right that volcanic eruptions form excellent natural experiments in how the climate system responds to the reduction in incoming sunlight. The current paradigm says that after a volcano, the temperature should vary proportionally to the forcing. I say that the temperature is regulated, not by the forcing, but by a host of overlapping natural emergent temperature control mechanisms, e.g. thunderstorms, the El Nino, the Pacific Decadal Oscillation, the timing of the onset of tropical clouds, and others. Changes in these and other natural regulatory phenomena quickly oppose any unusual rise or fall in temperature, and they work together to maintain the temperature very stably regardless of the differences in forcing.
So with the volcanoes, we can actually measure the changes in temperature. That will allow us to see which claim is correct—does the temperature really follow the forcings, or are there natural governing mechanisms that quickly act to bring temperatures back to normal after disturbances?
INVESTIGATION
In order to see the effects of the volcanoes, we can “stack” them. This means aligning the records of the time around the volcano so the eruptions occur at the same time in the stack. Then you express the variations as the anomaly around the temperature of the month of the eruption. It’s easier to see than describe, so Figure 2 shows the results.
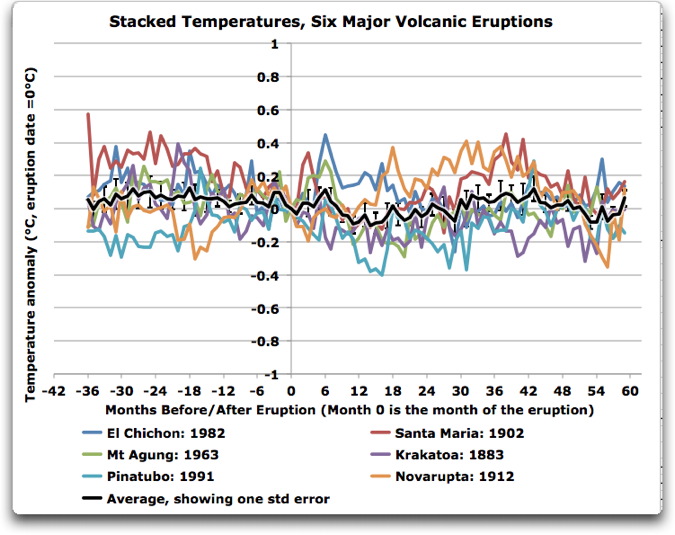
Figure 2. Stacked records of the six major volcanoes. Individual records show from three years before to five years after each eruption. The anomalies are expressed as variations around the temperature of the month of the eruption. The black heavy line shows the average of the data. Black vertical lines show the standard error of the average.
The black line is the average of the stacked records, month by month. Is there a signal there? Well, there is a temperature drop starting about six months after the eruptions, with a maximum of a tenth of a degree. However, El Chichon is clearly an outlier in this regard. Without El Chichon, the signal gets about 50% stronger.

Figure 3. As in Figure 3, omitting the record for El Chichon.
Since I’m looking for the common response, and digging to find the signal, I will leave out El Chichón as an outlier.
But note the size of the temperature response. Even leaving out El Chichon, this is so small that it is not at all clear if the effect shown is even real. I do think it is real, just small, but in either case it’s a very wimpy response.
To properly judge the response, however, we need to compare it to the expected response under various scenarios. Figure 3 shows the same records, with the addition of the results from the average models from the Forster study, the results that the models were calculated to have on average, and the results if we assume a climate sensitivity of 3.0 W/m2 per doubling of CO2. Note that in all cases I’m referring the equilibrium climate sensitivity, not the transient climate response, which is smaller. I have used the lagged linear equation developed in my study of the Forster data (first cite above) to show the theoretical picture, as well as the model results.
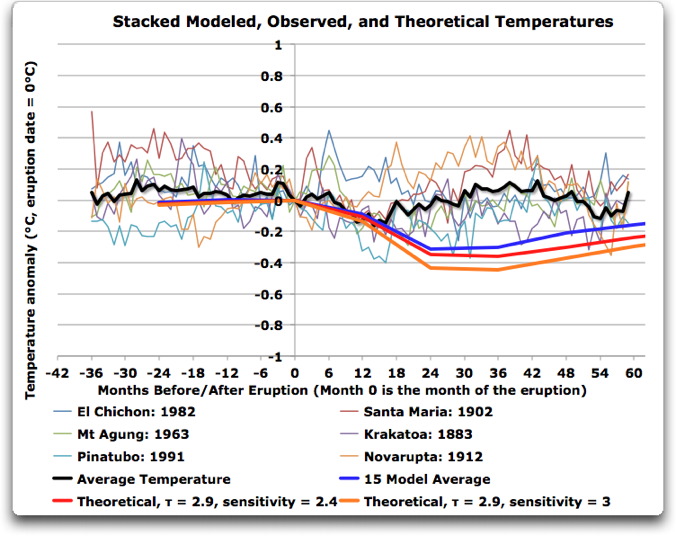
Figure 4. Black line shows the average of the monthly Hadcrut temperatures. Blue line shows the average of the modeled annual temperatures from the 15 climate models in the Forster paper, as discussed here. The red line shows what the models would have shown if their sensitivity were 2.4°C per doubling of CO2, the value calculated from the Forster model results. Finally, the orange line shows the theoretical results for a sensitivity of 3°C per doubling. In the case of the red and orange lines, the time constant of the Forster models (2.9 years) was used with the specified sensitivity. Tau ( τ ) is the time constant. The sensitivity is the equilibrium climate sensitivity of the model, calculated at 1.3 times the transient climate response.
The theoretical responses are the result of running the lagged linear equation on just the volcanic forcings alone. This shows what the temperature change from those volcanic forcings will be for climate models using those values for the sensitivity (lambda) and the time constant (tau).
Now here, we see some very interesting things. First we have the model results in blue, which are the average of the fifteen Forster models’ output. The models get the first year about right. But after that, in the model and theoretical output, the temperature decreases until it bottoms out between two and three years after the eruption. Back in the real world, by contrast, the average observations bottom out by about one year, and have returned to above pre-eruption values within a year and a half. This is a very important finding. Notice that the models do well for the first year regardless of sensitivity. But after that, the natural restorative mechanisms take over and rapidly return the temperature to the pre-eruption values. The models are incapable of making that quick a turn, so their modeled temperatures continue falling.
Not only do the actual temperatures return to the pre-eruption value, but they rise above it before finally returning to the that temperature. This is the expected response from a governed, lagged system. In order to keep a lagged system in balance, if the system goes below the target value for a while, it need to go above that value for a while to restore the lost energy and get the system back where it started. I’ll return to this topic later in the post. This is an essential distinction between governors and feedbacks. Notice that once disturbed, the models will never return to the starting temperature. The best they can do is approach it asymptotically. The natural system, because it is governed, swings back shortly after the eruption and shoots above the starting temperature. See my post Overshoot and Undershoot for an earlier analysis and discussion of governors and how they work, and the expected shape of the signal.
The problem is that if you want to represent the volcanoes accurately, you need a tiny time constant and an equally tiny sensitivity. As you can see, the actual temperature response was both much smaller and much quicker than the model results.
This, of course, is the dilemma that the modelers have been trying to work around for years. If they set the sensitivity of their models high enough to show the (artificially augmented) CO2 signal, the post-eruption cooling comes out way, way too big. If they cut the sensitivity way, way down to 0.8° per doubling of CO2 … then the CO2 signal is trivially small.
Now, Figure 4 doesn’t look like it shows a whole lot of difference, particularly between the model results (blue line) and the observations. After all, they come back close to the observations after five years or so.
What can’t be seen in this type of analysis is the effect that the different results have on the total system energy. As I mentioned above, getting back to the same temperature isn’t enough. You need to restore the lost energy to the system as well. Here’s an example. Some varieties of plants need a certain amount of total heat over the growing season in order to mature. If you have ten days of cool weather, your garden doesn’t recover just because the temperature is now back to what it was before. The garden is still behind in the total heat it needs, the total energy added to the garden this season is lower than it would have been otherwise.
So after ten days of extra cool weather, your garden needs ten days of warm weather to catch up. Or perhaps five days of much warmer weather. The point is that it’s not enough to return the temperature to its previous value. We also need to return the total system energy to its previous value.
To measure this variation, we use “degree-days”. A degree-day is a day which is one degree above from some reference temperature. Ten degree-days could be five days that are two degrees warmer than usual, or two days that are five degrees warmer than usual. As in the example with the garden, degree-days accumulate over time, with warmer (positive) degree days offsetting cooler (negative) degree days. For the climate, the corresponding unit is a degree-month or a degree year. To convert monthly temperature into degree-months, you simply add each months temperature difference from the reference to the previous total. The record of degree-months, in other word, is simply the cumulative sum of the temperature differences from the date of the eruption.
What does such a chart measure? It measures how far the system is out of energetic balance. Obviously, after a volcano the system loses heat. The interesting thing is what happens after that, how far out of balance the system goes, and how quickly it returns. I’ve left the individual volcanoes off of this graph, and only shown the stack averages.
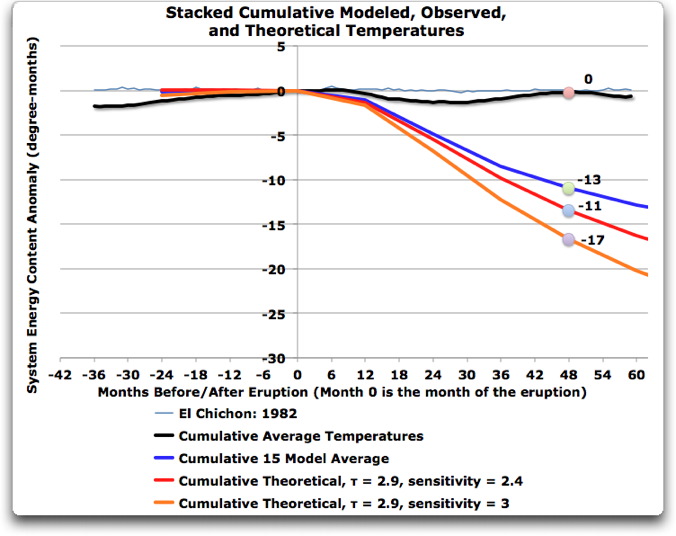
Figure 5. Cumulative record of degree-months of energy loss and recovery after the eruptions. Circles show the net energy loss in degree-months four years after the eruption.
Remember that I mentioned above that in a governed system, the overshoot above the original temperature is necessary to return the system to its previous condition. This overshoot is shown in Figure 3, where after the eruptions the temperatures rise above their original values. The observations show that the earth returned to its original temperature after 18 months. The results in Figure 5 show that it took a mere 48 months to regain the lost energy entirely. Figure 5 shows that the actual system quickly returned to the original energy condition, no harm no foul.
By contrast, the models take much larger swings in energy. After four years, the imbalance in the system is still increasing.
Now folks, look at the difference between what the actual system does (black line) and what happens when we model it with the IPCC sensitivity of 3° per doubling, or even the model results … I’m sorry, but the idea that you can model volcanic eruptions using the current paradigm simply doesn’t work. In a sane world, Figure 5 should sink the models without a trace, they are so very far from the reality.
We can calculate the average monthly energy shortage in the swing away from and back to the zero line by dividing the area under the curve by the time interval. Nature doesn’t like big swings, this kind of response that minimizes the disturbance is common in nature. Here are those results, the average energy deficit the system was running over the first four years.
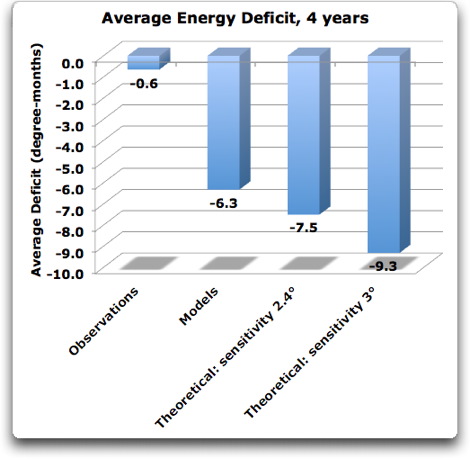
Figure 6. Average energy deficit over the first four years after the eruption.
In this case, the models are showing an average energy deficit that is ten times that of the observations … and remember, at four years the actual climate is back to pre-eruption conditions, but the models’ deficit is still increasing, and will do so for several more years before starting back towards the line.
CONCLUSIONS
So what can we conclude from these surprising results?
The first and most important conclusion is that the climate doesn’t work the way that the climate paradigm states— it is clearly not a linear response to forcing. If it were linear, the results would look like the models. But the models are totally unable to replicate the rapid response to the volcanic forcings, which return to pre-existing temperatures in 18 months and restore the energy balance in 48 months. The models are not even close. Even with ridiculously small time constant and sensitivity, you can’t do it. The shape of the response is wrong.
I hold that this is because the models do not contain the natural emergent temperature-controlling phenomena that act in concert to return the system to the pre-catastrophic condition as soon as possible.
The second conclusion is that the observations clearly show the governed nature of the system. The swing of temperatures after the eruptions and the quick return of both temperature and energy levels to pre-eruption conditions shows the classic damped oscillations of a governed system. None of the models were even close to being able to do what the natural system does—shake off disturbances and return to pre-existing conditions in a very short time.
Third conclusion is that the existing paradigm, that the surface air temperature is a linear function of the forcing, is untenable. The volcanoes show that quite clearly.
There’s probably more, but that will do for the present.
TESTABLE PREDICTION
Now, we know that the drops in forcing from volcanoes are real, we’ve measured them. And we know that the changes in global temperature after eruptions are way tiny, a tenth of a degree or so. I say this is a result of the action of climate phenomena that oppose the cooling.
A corollary of this hypothesis is that although the signal may not be very detectable in the global temperature itself, for that very reason it should be detectable in the action of whatever phenomena act to oppose the volcanic cooling.
So that was my prediction, that if my theory were correct, we should see a volcanic signal in some other part of the climate system involved in governing the temperature. My first thought in this regard, of course, was the El Nino/La Nina pump that moves warm Pacific water from the tropics to the poles.
The snag with that one, of course, is that the usual indicator for El Nino is the temperature of a patch of tropical Pacific ocean called the Nino3.4 area. And unfortunately, good records of those temperatures go back to about the 1950s, which doesn’t cover three of the volcanoes.
A second option, then, was the SOI index, the Southern Oscillation Index. This is a very long-term index that measures the difference in the barometric pressures of Tahiti, and Darwin, Australia. It turns out that it is a passable proxy for the El Nino, but it’s a much broader index of Pacific-wide cycles. However, it has one huge advantage. Because it is based on pressure, it is not subject to the vagaries of thermometers. A barometer doesn’t care if you are indoors or out, or if the measurement location moves 50 feet. In addition, the instrumentation is very stable and accurate, and the records have been well maintained for a long time. So unlike temperature-based indices, the 1880 data is as accurate and valid as today’s data. This is a huge advantage … but it doesn’t capture the El Ninos all that well, which is why we use the Nino3.4 Index.
Fortunately, there’s a middle ground. This is the BEST index, which stands for the Bivariate ENSO Timeseries. It uses an average of the SOI and the Nino 3.4 data. Since the SOI has excellent data from start to finish, it kind of keeps the Nino3.4 data in line. This is important because the early Nino3.4 numbers are from reanalysis models in varying degrees at various times, so the SOI minimizes that inaccuracy and drift. Not the best, but the best we’ve got, I guess.
Once again, I wanted to look at the cumulative degree-months after the eruptions. If my theory were correct, I should see an increase in the heat contained in the Pacific Ocean after the eruptions. Figure 6, almost the last figure in this long odyssey, shows those results.

Figure 6. Cumulative index-months of the BEST index. Positive values indicate warmer conditions. Krakatoa is an obvious outlier, likely because it is way back at the start of the BEST data where the reconstruction contains drifts.
Although we only find a very small signal in the global temperatures, looking where the countervailing phenomena are reacting to neutralize the volcanic cooling shows a clearer signal of the volcanic forcing … in the form of the response that keeps the temperature from changing very much. When the reduction in sunlight occurs following an eruption, the Pacific starts storing up more energy.
And how does it do that? One major way is by changing the onset time of the tropical clouds. In the morning the tropics is clear, with clouds forming just before noon. But when it is cool, the clouds don’t form until later. This allows more heat to penetrate the ocean, increasing the heat content. A shift of an hour in the onset time of the tropical clouds can mean a difference of 500 watt-hours/m2, which averages over 24 hours to be about 20 W/m2 continuous … and that’s a lot of energy.
One crazy thing is that the system is almost invisible. I mean, who’s going to notice if on average the clouds are forming up a half hour earlier? Yet that can make a change of 10 W/m2 on a 24-hour basis in the energy reaching the surface, adds up to a lot of watt-hours …
So that’s it, that’s the whole story. Let me highlight the main points.
• Volcanic eruptions cause a large, measurable drop in the amount of solar energy entering the planet.
• Under the current climate paradigm that temperature is a slave to forcing with a climate sensitivity of 3 degrees per doubling of CO2, these should cause large, lingering swings in the planet’s temperature.
• Despite the significant size of these drops in forcing, we see only a tiny resulting signal in the global temperature.
• This gives us two stark choices.
A. Either the climate sensitivity is around half a degree per doubling of CO2, and the time constant is under a year, or
B. The current paradigm of climate sensitivity is wrong and forcings don’t determine surface temperature.
Based on the actual observations, I hold for the latter.
• The form (a damped oscillation) and speed of the climate’s response to eruptive forcing shows the action of a powerful natural governing system which regulates planetary temperatures.
• This system restores both the temperature and the energy content of the system to pre-existing conditions in a remarkably short time.
Now, as I said, I started out to do this volcano research and have been diverted into two other posts. I can’t tell you the hours I’ve spent thinking about and exploring and working over this analysis, or how overjoyed I am that it’s done. I don’t have a local church door to nail this thesis to, so I’ll nail it up on WUWT typos and all and go to bed. I think it is the most compelling evidence I’ve found to date that the basic climate paradigm of temperatures slavishly following the forcings is a huge misunderstanding at the core of current climate science … but I’m biased in the matter.
As always, with best wishes,
w.
APPENDICES
UNITS
Climate sensitivity is measured in one of two units. One is the increase in temperature per watt/m2 of additional forcing.
The other is the increase in temperature from a doubling of CO2. The doubling of CO2 is said to increase the forcing by 3.7 watts. So a sensitivity of say 2°C per doubling of CO2 converts to 2/3.7 = 0.54 °C per W/m2. Using the “per doubling” units doesn’t mean that the CO2 is going to double … it’s just a unit.
DATA
Let’s see, what did I use … OK, I just collated the Otto and Forster net radiative forcings, the Forster 15 model average temperature outputs, the GISS forcing data, and the dates of the eruptions into a single small spreadsheet, under a hundred k of data, it’s here.
METHOD
The method depends on the fact that I can closely emulate the output of either individual climate models, or the average output of the unruly mobs of models called “ensembles” using a simple lagged linear equation. The equation has two adjustable parameters, the time constant “tau” and the climate sensitivity lambda. Note that this is the transient sensitivity and not the equilibrium sensitivity. As you might imagine, because the earth takes time to warm, the short-term change in temperature is smaller than the final equilibrium change. The ratio between the two is fairly stable over time, at about 1.3 or so. I’ve used 1.3 in this paper, the exact value is not critical.
Using this lagged linear equation, then, I simply put in the list of forcings over time, and out comes the temperature predictions of the models. Here’s an example of this method used on the GISS volcanic forcing data:
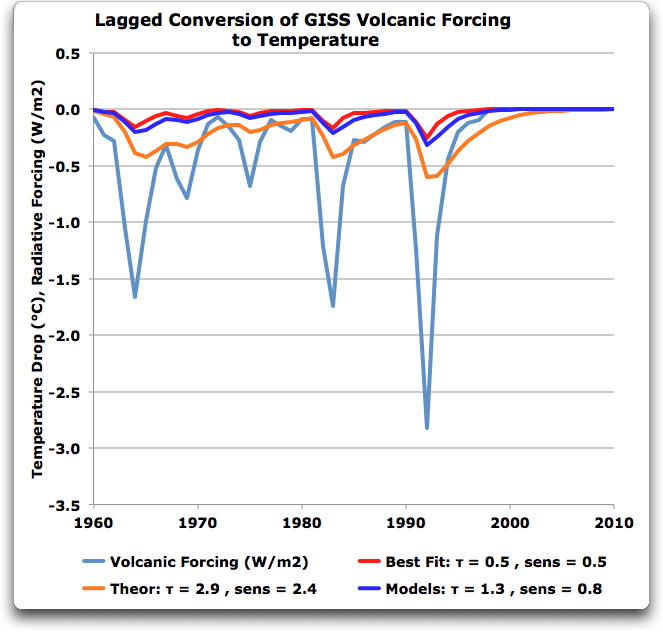
Lambda (a measure of sensitivity) controls the amplitude, while tau controls how much the data gets “smeared” to the right on the graph. And sad to say, you can emulate any climate model, or the average of a bunch of models, with just that … see my previous posts referenced above for details about the method.
INDIVIDUAL RECORDS
Here are the most recent six eruptions, eruptions that caused large reductions in the amount of sunlight reaching the earth, with the date of the eruptions shown in red.


Margaret Hardman says:
May 25, 2013 at 4:44 am
“.In the middle of marking university entrance individual studies/investigations. I would not give this a good mark. There are lots of confounding factors not taken into account, for example: how long do the particles erupted into the atmosphere remain there? What criteria are used for selecting the eruptions….etc….
Margaret, we’ve all had markers like you, who mark tougher on the smart ones. I suspect Einstein’s poor results in mathematics as a student may have partly been because of this. You seem to have missed the point that Willis has just graphed temps before and after the well known set of volcanic eruptions known to have sent aerosols into the stratosphere and noted that their overall effect after a few years has been zero, and remarkably the planet even worked overtime to make up the temporarily lost energy. This is an observation. Perhaps you can take issue with his suggestion that ENSO was somehow part of the rebound in temps associated with the eruptions, but not the observation itself. If Willis gets a low mark on this, what marks would you give to the bulk of climate scientists who certainly have it demonstrably wrong. Also, the last thing the climate scientists you probably admire would do is look into all the details on the behaviours of each eruption – they have an aversion to observation (they have to take such and homogenize and add stepped increases to disinfect them to get them to show their pre-supposed responses). While we are at it, why don’t you inform us of the characteristics of each eruption – volume, chemistry, etc. You could contribute this by way of rebuttal perhaps. Willis has written a thesis here in a number of hours only – you should read his “governor” thesis, It has been peer reviewed, and based on data and real world observations. God help our students.
Willis, I am not particularly sure why you need to bring in the cloud thermostat at this point. The heat capacity of the ocean is 1000 times greater than the atmosphere. With a volcanic perturbation, the ocean can take up the slack for quite some time. That is a change in the delta Q part of the ECS relationship that buffers or damps the atmospheric impact. The northern hemisphere “surface” air temperature drops more because the ocean/land surface area difference limits the rate of heat transfer.
Global temperature is the problem since responses are not globally the same.
Regarding the cooling trends prior to large volcanic eruptions- Don’t many volcanoes exhibit increasing activity prior to the main blast? I don’t know how to quantify that relative to the main date of the volcano, but it’s worth thinking about. (It’s also been pointed out here many times that smoothing temperature records will create a dip in the record preceding the actual drop caused by the initial volcanic eruption, so there’s that confounding factor as well.)
It’s also difficult to know how much routine background vulcanism is occurring both above ground and under sea relative to the large noticeable eruptions. That would need to be quantified as well, wouldn’t it?
Interesting post Willis.
David Archibald says:
May 25, 2013 at 1:59 am
Thanks, David, but the question was rhetorical. The problem, in addition to the size of the response, is the shape of the response. You need the “S”-shaped response that goes up above the zero line, in order to restore the lost energy … and the models seem unable to do that. No surprise, that’s the sign of a governing mechanism, and the models are slaves to linearity.
w.
The current climate paradigm says that the surface air temperature is a linear function of the “forcing”
It says nothing of the sort. You are starting with a misunderstanding, and so based on the well known principle of GIGO, your conclusions are invalid.
Seems to me from looking at those temp charts during the various eruptions, that the climate is already heading in a particular direction. When the climate is heading cooler or has flatlined, the eruption adds a more distinct cooling signal. But when the climate is going warmer, it doesn’t really stop it from doing so, it just seems to slow the process, and temper the peak of the warming.
Nick Stokes says:
May 25, 2013 at 2:18 am
Willis,
“Their canonical equation is:
Change in Temperature (∆T) = Change in Forcing (∆F) times Climate Sensitivity
In lieu of a more colorful term, let me say that’s highly unlikely.”
Whose canonical equation? Could you give a reference? Certainly no GSM works that way.
Folks, if you don’t know him, let me introduce you to Nick Stokes, who once again isn’t following the storyline. In fact, Nick will disagree about anything, if you say blue, he’ll say red. He’s a jailhouse lawyer, and has never (to my knowledge) admitted he is wrong.
I gave you the citations in the head post, Nick. The most important is this one, which discusses the equation in detail in the comments. But if you want more, you could read my post “The Cold Equations“, or any of a host of other posts discussing the topic.
And while you are correct that “no GSM works that way (I assume you mean GCM), my posts have shown that they are functionally equivalent to just exactly that equation … I guess you weren’t paying attention.
Do try to keep up, dear boy … don’t worry, folks, Nick will be back soon with his unending chant of “wrong, wrong, you’re wrong” … nothing short of a tactical nuclear weapon can prevent Nick from exposing his ignorance.
w.
Gary Pearse 25 May @ur momisugly 9.05am
God help you, I think you mean. I mark against agreed criteria and applying those criteria this effort would be marked low. To tell me that it was written in a few hours tells me plenty. To expect to overturn the efforts of hundreds of scientists over dozens of years with something put together in a day, without much in the way of references and without much consideration for confounding factors.
As for marking Einstein down. Try http://skeptics.stackexchange.com/questions/956/was-einstein-a-poor-student for some evidence that Einstein wasn’t marked down by his teachers. Follow the evidence, don’t buy the myth is the moral here. And before you say it, because I am afraid the responses are usually predictable on this site, I follow the evidence, the real, messy, complicated evidence, as do climate scientists.
And as a final remark, you trumpet peer review but I suspect you have an ambivalent attitude to peer review. It is a useful but imperfect tool, designed to ensure that quality science is published whether it is in agreement with what we currently believe is correct or not. It weeds out articles like the current one which would have been returned with a lengthy list of recommendations for improvement. If you could send me a link for the paper you refer to, including the title of the journal, I would be most grateful. Google doesn’t seem to be helpful.
Lance Wallace says:
May 25, 2013 at 2:50 am
As you can see from the figures, the removal of El Chichon made little difference, merely clarified the shape of the response, so I’m not clear what your issue is. And no, that’s not the same reason Briffa uses.
w.
I agree with the very first comment.
Willis rarely admits that he was wrong for one simple reason: he is rarely wrong. That is in stark contrast to Nick Stokes and the rest of the alarmist crowd, who can’t seem to understand that their endlessly repeated predictions of runaway global warming were flat wrong. Instead of admitting they were wrong, they alter their argument.
Now we are at the “climate change”, “global-warming-causes-cooling” stage of delusion. My question to Nick: how many more years of non-warming would it take for you to admit that your catastrophic AGW conjecture is wrong? Give me a number.
Nick Stokes says:
May 25, 2013 at 4:24 am
This is Nick at his finest, folks. He claims that he can’t understand whether I’m talking about … Nick, when I say the “average of the fifteen Forster models’ output”, I’m talking about the average of the output of the Forster models … is that so hard to understand? I discussed in my last post, which I cited above and you apparently didn’t read, exactly how I got the results by digitizing the Forster data … wake up and smell the coffee, Nick. Your nit-picking is boring, just makes you look dumb.
w.
Wilis: ” You need the “S”-shaped response that goes up above the zero line, in order to restore the lost energy … and the models seem unable to do that. No surprise, that’s the sign of a governing mechanism, and the models are slaves to linearity.”
You need the S shape to match the data but not to restore lost energy. Your degree.days idea is wrong (physical dimensions again will tell you that).
The “S” is typical of a governor but so would a slow rise to previous temps. It is the return that matters and that shows recovering lost energy.
I explained all that above in more detail , I suggest you read and take note.
It does not undo any of what you are saying here but it would be better if you understood the physics since you will not get the idea accepted if you retain mistakes like that.
Nice work.
Especially see my comments on over shoot and over damped systems.
Nick Stokes says:
May 25, 2013 at 4:42 am
No, Nick, that’s just more of your bafflegab to avoid admitting an error. I digitized them from the FORSTER PAPER, exactly as I cited and quoted in my last post. See Figure 2 of the Forster paper that you just cited, that’s what I reproduced at the top of my last post. That’s what I digitized, and that’s what you seem unable to see.
I hardly expect you to actually admit you have your head up your fundamental orifice, Nick, you’ve never done that before … but it is obvious to the rest of us.
Thanks for the published version of the paper, though, much appreciated.
w.
@Willis I sometimes wonder if Nick is on some sort of frequent obfuscator program, where he gets rewards based on the number of such comments he leaves. – Anthony
Margaret Hardman:
“I know nothing of the author but I would suspect they have not used their full scientific training in the production of this short article. Had they done so, they would have spent a considerable time looking in detail at the possible confounding factors surrounding the global temperatures for each of these eruptions and those that were left out.”‘
So this is the holier than though “educator” that pretends to know more than anyone else?
When you’re marking those exams, do you allow students to use “their” and “they” to refer to a single individual?
And, perhaps as a better indicator of Einstein’s experience with “educators” (and those who mark entrance exams), Wiki tell us “Einstein did however fail his first entrance exam into Federal Polytechnic School in 1895.”
http://en.wikipedia.org/wiki/List_of_common_misconceptions
If I were to use the same tactics as Ms/Dr/Professor/Schoolmarm Hardman, I might write” “I know nothing about this “eduactor”, but I suspect she has a bloated opinion of her own intellect.”
But I won’t.
Willis – THANKS.
This is the first post that includes the basic concepts that a good process control engineer knows and understands. The globe, like a Terrarium, or a boiler at a power plant – a closed system. Changes are effected as much by the lag of a factor/parameter as they are by the gain/attenuation of the parameters involved. This seems to have been missed in the General Theory of AGW (pun intended.) The perceived effects of a known change mat not be the only effect, they can as you have suggested cause a lead (early cloud formation) or a lag of the effects (clouds lasting longer) each of which also causes different imperceptible, unless analyzed carefully, effects.
In tuning the control systems during the startup phase of a new power plant, The operators quickly discovered how difficult it was to manually control the level of a feedwater heater, or boiler. For some operators it was near impossible. And all were amazed at how one seemingly insignificant subsystem could quickly put the plant into a rapid, un-recoverable, spiral to trip/shutdown. Anyone with any process control training should readily see that the Earth is doing a very good job of controlling it’s temperature, otherwise we would be in a constant stat of oscillations.
All volcanic activity is not created equal. The effect on the models or the climate due to this bit of information is really unknown to me. But at least it might be worth noting the fact. I worked at a solar furnace in NM previous to and after the El Chichon eruption and I observed a drop in normal fall “solar constant” readings by about 100 watts/m^2 at our site for several months. We measured solar “input” at the surface with an Eppley normal incident pyrheliometer (NIP) tracker. Normal readings during the fall were 900 to1000 w/m^2 depending on water vapor in the atmosphere (and fall days were usually very low in water vapor). The fall after El Chichon was clearly different with a decreasing value throughout the year that lasted about 6 months and then slowly increased back to normal by the end of the 12 month period after the eruption. El Chichon apparently blasted large amounts of dust and gas into the stratosphere so that upper winds circling the globe slowly distributed this material far and wide. Effects like this depend heavily on the location of the volcano and the weather conditions during the activity. Apparently volcanoes at higher latitudes do not have much of a global effect.
So the take away from this is that perhaps most volcanoes do not have global effects. They certainly may have regional or latitudinal ones but the limits of their effects must be gauged by the physical conditions involved in the activity (location, eruption characteristics [violence, ejecta, etc], winds, etc). Perhaps this is why taking all volcanoes into the mix will not produce more than noise at least taken from a global perspective. And perhaps a global decrease in incoming SW radiation from the sun may still not be enough to cause much more than a ripple in “force” (climate). However, if this is true of levels of 100 watts/m^2 why are we worried about a few watts/m^2 caused by CO2?
Just a data point in an always interesting Willis analytical exercise.
Maybe the next step is to sort volcanoes by latitude and magnitude to see if a better signal can be teased out?
Anthony Watts says:
May 25, 2013 at 10:26 am
@Willis I sometimes wonder if Nick is on some sort of frequent obfuscator program, where he gets rewards based on the number of such comments he leaves. – Anthony
It is true. The posts are amazingly described by: “some sort of frequent obfuscator program, where he gets rewards based on the number of such comments he leaves”
I had the same experience reading comments posted under the same nick some time ago comparing the way the UVA behaved towards two different FOI requests, one by a green organisation requesting info based of FOI for a skeptic scientists (Michaels), the other by ATI requesting for info based on FOI for M.Mann:
http://rankexploits.com/musings/2012/court-ruling-on-mannati-case/
It is amazing to see his “logic”. Whilst I do understand the discussion should be looked from both angles, is this way of obfuscation the best the alarmists are able to bring up? Is this all they can do?
Willis,
“I gave you the citations in the head post, Nick.”
Yes, I’m back. You have given a caricature of the modeller’s approach to relating temperature to forcing, saying:
“Their canonical equation is:
Change in Temperature (ΔT) = Change in Forcing (ΔF) times Climate Sensitivity
In lieu of a more colorful term, let me say that’s highly unlikely.”
and
“The current paradigm says that after a volcano, the temperature should vary proportionally to the forcing.”
Well, “canonical”, “current paradigm” – I’d expect you could actually quote scientists saying those things. Instead you just refer me to posts where you’re saying them.
I’ve gone through above what Forster et al say, and Otto et al, and it isn’t their paradigm. Otto specifically says that a proportional relation is not ot be expected after a volcano. So whose is it?
On the data question, you gave no source for the 15 Model average plotted in this post for post volcano periods. I looked for the numbers in all the places one might expect – no. So I asked. Then I looked through some of your earlier posts, and by checking the numbers from a spreadsheet there and this one, I saw that they matched. So I posted again to acknowledge that. But it would have helped if you had said here where they come from, since they are central to your post.
Margaret Hardman says:
My goodness, madam, this is the hastily assembled findings of work done when I’m not working at my day job in construction, research into what volcanoes can show us which is still ongoing as I write this. Basically, I’m offering you the opportunity to read my laboratory notebook as I’m working on the issues, and you complain that it’s not a finished scientific paper?
This is totally taken into account, in the creation of the forcing figures. The volcanic forcing data takes all of those issues into account, the scientists considered those questions when they produced the estimate of the global reduction in sunlight.
The criteria for selecting the eruptions is that I picked the obvious large peaks in the forcing estimates that were clearly identifiable from the record. If there had been seven peaks, I’d have chosen them. I was looking for the biggest volcanoes.
I see now that you are a true scholar, destined for the ivory tower … not one of those makes the slightest difference to my analysis. How would it make any change in my results if I knew how much material was erupted into the atmosphere, or what the local effect of volcanoes might be?
Also, the VEI (volcanic explosivity index) isn’t really the important factor. The issue is how much dust is injected into the stratosphere. An eruption can have a high VEI and not put much aerosols into the stratosphere, and a low VEI eruption can put lots of aerosols up there.
But all of these issues are taken into account by the folks who put together the estimate of the volcano forcings, how much material, for how long it was injected, how long it lasted, they’ve considered all of that. Your claim that I need to adjust for those issues just reveals your misunderstanding. If you think those are problems, go talk to the volcanic forcing guys.
Not sure what to say to that … I see that despite my efforts, you haven’t understood the problem with the models. I’ll continue to explain.
Ah, I see what part of it is. You haven’t understood about the equation I used to emulate the models.

First, the equation I used doesn’t “model part of the behaviour of the climate system”. It models the MODELS. It is an equation that is functionally equivalent to what the models do. The problem is that the equation DOESN’T model the climate system for beans.
Let me see if I can simplify this.
What I discovered in the course of my research is that the current generation of climate models are all bozos when it comes to estimating the global surface temperature. All they do is a simple lagged linear transformation of the input data. An example of the models at work is this figure from above:
The volcanic forcing, in W/m2, is the bottom blue line. The other lines represent examples of a family of curves that can be produced by the climate models. The dark blue line is the 19-model average used in the Forster study. All that the models are doing is that they are delaying and changing the size of the effect. That’s it.
The red line is kind of interesting. It’s the line that gives the best fit to the actual volcanic results. Note that it has a wholly unrealistic time constant of six months …
The main problem, however, is not in the size of the climate models’ response. It is in the shape of the response. Notice that not one of those model results ever showed a temperature that crosses the top line, that goes higher than the original conditions … but in order to quickly recover from a volcanic loss of sunlight, you need to go above the original temperature in order to restore the lost energy.
Second, does this “invalidate all climate models”? Well, to date I’ve analyzed the GISS and the CCSM3 individual models. Isaac Held independently did the same analysis on the CM2.1 model. And I did the analysis on the 19 models in the Forster analysis … and that’s about all the models I know about.
So at this point, the shoe is on the other foot. I’ve done my part. If you want to claim that there is a climate model out there whose outputs CAN’T be replicated by my simple equation, you’ll need to identify it …
Ah, my dear, you can’t know how unintentionally funny that is … let me point you to my post “It’s Not About Me“, you might find my scientific training interesting.
Let me see if I can explain my thesis simply.
A volcano causes a huge dip in the amount of sunlight reaching the earth. This is clearly shown in the model results as a large and long-lasting dip in temperature following an eruption, but but such a large and lasting fall does not actually occur in the real world.
We know the effect isn’t happening in the real world because I showed the combined effects of the volcanoes by averaging them to minimize confounding factors, and also because I showed the individual records. That gave me an average response along with a standard error.
Then I showed that in the real world, both the temperature and the system energy quickly returned to pre-eruption values. In the models, by contrast, while they do return to near pre-eruption temperature (albeit very slowly), the system energy is not restored for decades.
And not one of the issues that you raised make the slightest difference to those findings or conclusions, Margaret. How long the aerosols remain in the air, and whether Mt. Hudson did or didn’t, those are all accounted for in the shape of the volcanic forcing data.
Finally, and as gently as I can, I do have to say that more questions and less assertions might be in order for you …
w.
John M
May 25, 2013 at 10:17 am
Thank you for missing the point. I wondered how long it would take before the comments turned from substantive points to ad hominem assertions. I don’t rate myself highly intellectually but I’m also not stupid (though I don’t doubt many would debate that). My point in suggesting that Mr Eschenbach might have used more of his BA in psychology (yes, I googled him) to bring to bear his undoubted intellectual qualities and really investigated the issue, as befits anyone trying to produce something of true intellectual worth. It is not enough in science to produce a few colourful graphs without doing some true analysis on the data and seeing if there really is anything real going on or just something that fools the eye. I read the piece waiting for the real meat in this thin sandwich and it never arrived. If the purpose of this site is really to unravel the science (and politics) of climate change then it requires something more than the preceding article. It requires intellectual rigour. It requires proper quantification of all sorts of factors. Science doesn’t proceed on assertion. Remember what Richard Feynman said on the subject of delusion.
As for Einstein, it is true he failed his initial FPI entrance exam at 16, two years early and partly self taught. He failed because his non-science scores were insufficient, while scoring exceptionally in maths and natural science. See http://www.library.ethz.ch/en/Resources/Digital-collections/Einstein-Online/Youth-1879-1896 If you had read the wiki link rather than just cherry picking the phrases you wanted then you might have got the full picture. Einstein himself said he was no slouch at school. Applying two years ahead of time for higher education was clearly a gamble and it didn’t work. Didn’t make him a dullard.
This really needs to be broken down in to land/sea temps and tropical , extra-tropical.
This would be expected when looking for evidence for or against Willis’ TS regulator hypothesis
http://climategrog.wordpress.com/?attachment_id=270
Land shows temporary winter warming ex-tropics and a remarkable El Chichon tropical response.
http://climategrog.wordpress.com/?attachment_id=271
SST tropics is more stable than usual it seems certainly no drop. Score 1 for Willis.
ex-tropical , clear annual oscillation in the anomaly for three years after Pinotubo.
If we look at the sense we see this is because of a _reduced_ annual variation, again warmer winters but cooler end of summer.
ie Land : temporary warming
Sea : less annual variation.
NO cooling. score two for Willis.
Now if someone wants look at this with a GCM simulator , try putting volcanic forcing to zero, zero water vap. feedback, CO2x2 at its theoretical value and see what happens.
Zero volcanics is not accurate but it’s probably the best first stab to test this in a model that is not capable of creating tropical storms.
To our resident Mother Superior…
“Whoever undertakes to set himself up as judge in the field of truth and knowledge is shipwrecked by the laughter of the Gods.”
Willis Eschenbach
May 25, 2013 at 11:38 am
Thank you for patronising me. Most gallant of you.
I read your Brief Communications and the response. I also read your scientific autobiography. I stand by my comment that there are many omissions and if this is a work in progress it should be labelled as such at the beginning.
As for true scholar. Destined for an ivory tower. I refer you here
Well, they’ll choose a man for you to meet tonight
You’ll play the fool and learn how to walk through doors
How to enter into the gates of paradise
No, how to carry a burden too heavy to be yours
Yeah, from the stage they’ll be tryin’ to get water outa rocks
A whore will pass the hat, collect a hundred grand and say thanks
They like to take all this money from sin, build big universities to study in
Sing “Amazing Grace” all the way to the Swiss banks
But I’m sure this will be moderated out as irrelevant.