Over at The Conversation Andrew Glikson asks Fact check: has global warming paused? citing an old Skeptical Science favorite graph, and that’s the problem; it’s old data. He writes:
As some 90% of the global heat rise is trapped in the oceans (since 1950, more than 20×1022 joules), the ocean heat level reflects global warming more accurately than land and atmosphere warming. The heat content of the ocean has risen since about 2000 by about 4×10²² joules.
…
To summarise, claims that warming has paused over the last 16 years (1997-2012) take no account of ocean heating.
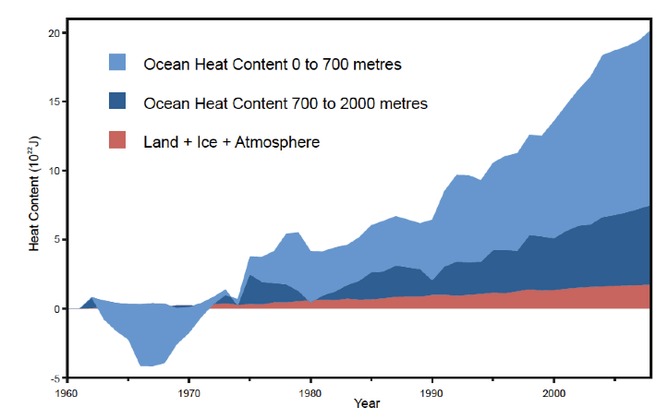
Hmmm, if “…ocean heat level reflects global warming more accurately than land and atmosphere warming…” I wonder what he and the SkS team will have to say about this graph from NOAA Pacific Marine Environment Laboratory (PMEL) using more up to date data from the ARGO buoy system?
Sure looks like a pause to me, especially after steep rises in OHC from 1997-2003. Note the highlighted period in yellow:

From PMEL at http://oceans.pmel.noaa.gov/
The plot shows the 18-year trend in 0-700 m Ocean Heat Content Anomaly (OHCA) estimated from in situ data according to Lyman et al. 2010. The error bars include uncertainties from baseline climatology, mapping method, sampling, and XBT bias correction.
Historical data are from XBTs, CTDs, moorings, and other sources. Additional displays of the upper OHCA are available in the Plots section.
As Dr. Sheldon Cooper would say: “Bazinga!“
h/t to Dr. Roger Pielke Sr. for the PMEL graph.
UPDATE: See the above graph converted to temperature anomaly in this post.
@Mark Bofill: No one is talking about a runaway greenhouse effect as a serious possibility, only as an “if,” because no sane person thinks we will burn 10,000 GtC. (For one thing, it would raise atmospheric CO2 levels to roughly 5,000 ppmv, which begins to become toxic (or at least sedative)).
Humans would stop burning carbon long before that.
P.S. I barely know who John Cook is.
IPCC, 2004: “A ‘runaway greenhouse effect’—analogous to Venus—appears to have virtually no chance of being induced by anthropogenic activities.”
http://www.ipcc.ch/meetings/session31/inf3.pdf
@Mark Benson – like I said, it was an irrelevant point when I raised it. I saw you two talking about it when I got back to the thread but didn’t do a very good job checking the comment history before I posted on it.
RE John Cook: Bummer!
Hey, just out of curiosity again, how’d you end up with 5,000 ppmv for burning 10,000 GtC? I did this wrong in my earlier post, but revisiting – if we’re burning about 9 GtC a year now and CO2 is increasing 2 ppmv in the atmosphere, one might think we’d increase by another 2,222 ppmv at 10,000 GtC. I’ve read that by computing our CO2 contribution theoretically instead of taking the observations we see that we’re actually putting out something more like 6 ppmv per year, but the CO2 sinks in the system are absorbing some of that, so what we measure is 6 ppmv. Are you figuring some of the sinks saturating somewhere along the line in your calculation?
BTW – I think you’re overestimating the effects of a half percent CO2 concentration there. A quick google glance at a couple of sources seems to indicate no effect at indefinite exposure times until at least a percent or two.
Excuse me, meant to say, what we measure is 2 ppmv, not 6 ppmv.
Phobos says:
“The links I’ve given above (Harries et al, and the others) are direct measurements of the enhanced greenhouse effect.”
Once more, for the hard of understanding: there are no empirical, testable measurements of the so-called ‘enhanced greenhouse effect’, nor of AGW. None. What is it about none that is so hard to understand?
If there were verifiable measurements, the sensitivity number would then be established. It is not. Prof Richard Lindzen puts climate sensitivity to CO2x2 at <1°C. Dr Craig Idso puts the sensitivity number at 0.37ºC; Dr Miskolzci puts it at 0.00ºC; Dr Spencer puts it at 0.46; Dr Schwartz puts it at ≈1.1ºC; Dr Chylek puts it at 1.4ºC. Prof Lindzen’s estimate is about average among skeptical scientists – the only honest kind of scientist.
One more time for the dense: there is no agreed sensitivity number, therefore any and all claims that AGW has been measured are false.
Phobos says:
March 2, 2013 at 11:25 am
Joe says: “In the intervening years they’ve refined the models, which now allow for zero trends of any (as yet undetermined) length without altering the conclusions.”
Do you really not understand that a lot of evidence supports the enhanced greenhouse effect, while uncertainties in other factors that influence surface temperatures (aerosols, ENSOs, clouds, deep ocean dynamics, feedbacks) leave ample room for a flat trend over short time intervals?
————————————————————————————————————-
Do you really not understand humour comment when you see it? Sheesh!!!
On a more serious note, do you also not understand that it was YOUR side who said, as recently as 2008, that a 15 year pause was ruled out by the models at a 95% confidence level? Or that we have now reached that 15 years and the Met Office are predicting a further 4 to 5 year pause on top?
You see, there has to come a point where your “flat trend over a short time interval” starts to mean something. The last word from the experts was that point was “15 years”. Now that 15 years has arrived, they’re moving the goal posts but haven’t said where too yet. Hence my tongue-in-cheek comment about “zero trends of any (as yet undetermined) length” being consistent with the models
What will they do when (quite likely as things are going) the “pause” becomes longer than the late 20th C warming? Only another 10 years or so to go and they’re already preparing us for 4+ of those. Will you STILL be saying it’s “just a pause” then?
What will they do when (if) the “pause” gets to the magic “30 years for climate”? Will that suddenly be too short to mean anything as well?
Joe commented.
” What will they do when (quite likely as things are going) the “pause” becomes longer than the late 20th C warming?”
Okay, i have a prediction, temps are very near their peak, if not already past it. The ~30 year downward cycle has begun.
If you compare the difference between day time temp increase, amd the following nights drop, on a daily basis throughout the year, and get the slope of this change from spring to fall, and fall to spring. That slope was at a max right about 1974, where it started dropping. The minimum slope bottomed the same time temps peaked, the max slope lasted about 10 years, as of 2010, the min slope was just finishing its 8-9th year.
It is almost an exact 30 year cycle.
Phobos says:
March 2, 2013 at 11:10 am
“Nature absorbs as much as she puts in — actually a little more than that. It’s man’s contribution that is causing the atmospheric buildup.”
Nope, that’s not how it works. That’s not how feedback systems work in general. The proof, for this specific case, is here.
D.B. Stealey says: :Once more, for the hard of understanding: there are no empirical, testable measurements of the so-called ‘enhanced greenhouse effect’,”
Just to entertain you….
1) explain why a decrease in brightness temperature at CO2 and CH4 absorption frequencies is not a sign of an enhanced greenhouse effect
2) explain why an increase in surface downward longwave radiation at CO2 and CH4 emission frequencies is not a sign of an enhanced greenhouse effect
3) explain how you would measure the enhanced greenhouse effect.
Phobos says:
1) explain…
2) explain…
3) explain…
You still don’t understand the Scientific Method. The onus is on you to explain, not on scientific skeptics. You are the one who needs to provide a credible explanation of your CO2=CAGW conjecture. But you have no good explanation. In fact, Planet Earth is falsifying your conjecture. You just can’t admit it.
Phobos says:
…
1) explain why a decrease in brightness temperature at CO2 and CH4 absorption frequencies is not a sign of an enhanced greenhouse effect
2) explain why an increase in surface downward longwave radiation at CO2 and CH4 emission frequencies is not a sign of an enhanced greenhouse effect
3) explain how you would measure the enhanced greenhouse effect.
—————
Definitions:
Answers:
1) & 2) Nobody disputes the basic radiative physics. (see Straw Man above) By definition, the primary measure of the greenhouse effect is increase in average temperature (see Greenhouse Effect above). Showing a decrease in brightness temperature at CO2 and CH4 absorption frequencies is not a sign of an enhanced greenhouse effect, as it does not inevitably follow that a decrease in brightness temperatures at CO2 and CH4 absorption frequencies will correspond to an increase in average temperature. As you well know, any postulated increase in average temperature resulting is subject to numerous other factors, I.E. sub of total feedback
3) Measuring a significant rise in the average temperature (as opposed to the insignificant warming observed over the past 17 years) would be a good place to start (see Greenhouse Effect above).
@DB Stealey: I have explained, and given the references to the papers that prove it.
All you have done is said, no no no, without even being willing to analyze the results or discuss why you think they don’t show an enhanced greenhouse effect. (They do.)
What exactly are you doing here is you don’t want to discuss science?
Mark Bofill says; “1) & 2) Nobody disputes the basic radiative physics. (see Straw Man above) By definition, the primary measure of the greenhouse effect is increase in average temperature (see Greenhouse Effect above).”
There has been a 0.8 C increase in average surface temperature since the pre-Industrial era..
You and DB Stealey insist on analyzing a short interval where other factors have relatively large contributions to the short-term trends.
That’s why the decrease in brightness temperature is the *best* measurement of an enhanced greenhouse effect — it is independent of all the other complicating factors. That’s the kind of measurement scientists strive for — one that is simple and clean, without complicating factors.
That’s why Harries et al 2001 and Philipona et al 2004 are the surest sign that the greenhouse effect has gotten stronger as GHG concentrations have increased.
Phobos,
Are you completely dense? How many times do I have to explain this to you? There are no empirical measurements of AGW. None. No matter how many pal-reviewed papers you trot out.
For the umpteenth time: if we could measure AGW [enhanced globaloney], we would then know the climate sensitivity number. But we do not know the sensitivity number.
Prof Richard Lindzen puts the climate sensitivity to CO2x2 at < 1°C.
Drs Craig Idso, pere & fils, put the sensitivity number at ≈0.37
Dr Ferenc Miskolzci puts it at 0.0ºC
Dr Spencer puts it at 0.46
Dr Schwartz puts it at 1.1
Dr Chylek puts it at 1.4
The UN/IPCC puts it at a preposterous 3º+
With the exception of the IPCC, these are all reputable climatologists. They are recognized, published, peer reviewed authors — and they all disagree widely over what the sensitivity number is. Why? Because there are no empirical measurements of AGW.
If you cannot follow the reasoning and logic here, everyone else can. ALL of these SWAG estimates of sensitivity are simply educated guesses. They are not empirical, testable, falsifiable measurements. Peer reviewed papers are not empirical measurements. Climate models are not measurements. ‘Radiative physics’ is not a measurement.
There are no empirical, testable, falsifiable measurements of AGW.
I have a feeling you still don’t get it.
Phobos says:
March 3, 2013 at 6:32 pm
Er, uhm, ah, … no.
There was essentially NO change in CO2 levels from man’s activity before 1960. (And no other changes either from any known event.) To claim effects “since the Industrial Revolution” is dead false.
Therefore, there could have been NO effect on the earth’s temperature from a change in CO2 levels at ANY time prior to 1961. And, in fact, the “change” would need to be proportional to CO2 levels at ALL periods since 1960 for your “logic” (the CAGW = CO2 level religious fervor) to hold true. During that period since 1960, IF other factors have influenced worldwide temperatures, YOU need to be the one (or your other CAGW theists) to provide such worldwide measurements of aerosols, particulates, SOx, NOx, solar influences, or volcanoes, or clouds, or other matters.
Instead, we MEASURE real-world explicit declines in worldwide temperatures after particular events (extreme volcanic eruptions for example, EL Nino maximums, etc.) and NOT elsewhere. NOT at any other times.
In particular, since 1997-1998 period now 16 years ago, there has been NO increase in temperatures – despite a steadily increasing and very significant measured change in CO2 levels worldwide.
Further, there has been NO EVENTS since 1998 that you describe so blandly and generically as “other factors”. YOU cannot define ANY event nor series of events that have been measured to explain the flat-line of temperatures since 1997. And, likewise, you cannot accept the death of your religion described by that flatline. You have been trying to wave your hands and claim events – or claim underwater eruptions, or claim low-level eruptions – that somehow nobody else has noticed.
But your religion’s icon has been flat-lined for 16 years now.
RACookPE1978,
Phobos seems to have a problem remembering anything. He says:
“You and DB Stealey insist on analyzing a short interval…”
I have been constantly arguing that the longer the data record is, the better. Phobos needs to put out the joint and pay attention. This chart shows conclusively that CO2 has no measurable effect on temperature. And I have dozens of similar charts, all showing the same thing: whether CO2 is low or high, the natural recovery since the LIA is on the same long term trend line, and that trend is not accelerating — despite a ≈40% rise in [harmless, beneficial] CO2.
Phobos says:
March 3, 2013 at 6:32 pm
…
That’s why the decrease in brightness temperature is the *best* measurement of an enhanced greenhouse effect — it is independent of all the other complicating factors. That’s the kind of measurement scientists strive for — one that is simple and clean, without complicating factors.
That’s why Harries et al 2001 and Philipona et al 2004 are the surest sign that the greenhouse effect has gotten stronger as GHG concentrations have increased.
—
All it shows is an increased concentration in the atmosphere of certain gases. It’d be lovely to be able to avoid the complicating factors, but it’s not possible. Until we understand the feedbacks in the system in a much more precise and quantitative way than we do now, we aren’t going to be able to make theories that accurately predict anything useful about climate change.
BTW – yup, don’t dispute that it’s been warming. But warming per se isn’t my acceptance criteria for AGW. See my post in this thread (February 27, 2013 at 10:32 am) for what’s needed to persuade me. Also, understand the argument about the short interval, sorry about the short interval but there’s nothing to be done for that. If there was less horse hockey and political motivation in climate work, less IPCC policy recommendation, climategate, and so on, maybe I’d be more willing to look at older and more questionable data. I’m not. Sticking with results from modern instrumentation.
What makes you think net feedbacks will be positive?
D.B. Stealey says:
March 3, 2013 at 6:45 pm
…
For the umpteenth time: if we could measure AGW [enhanced globaloney], we would then know the climate sensitivity number. But we do not know the sensitivity number.
Prof Richard Lindzen puts the climate sensitivity to CO2x2 at < 1°C.
Drs Craig Idso, pere & fils, put the sensitivity number at ≈0.37
Dr Ferenc Miskolzci puts it at 0.0ºC
Dr Spencer puts it at 0.46
Dr Schwartz puts it at 1.1
Dr Chylek puts it at 1.4
The UN/IPCC puts it at a preposterous 3º+
…
—————–
Yep, this is another way of stating my problem with the 'science'. How is this science if nobody knows this value? This isn't a science yet, this is a bunch of scientists speculating and activists spinning.
Mark Bofill says:
March 3, 2013 at 7:01 pm
Phobos says:
March 3, 2013 at 6:32 pm
…
What makes you think net feedbacks will be positive?
——————————————————————–
He could be an idiot, or just a sh!t scientist like the rest of them.
More likely, he doesn’t actually think that, as he’s a paid liar/climate fraudster.
@DB Stealey: You keep writing about measuring climate sensitivity. I am talking about measuring the enhanced greenhouse effect. They are different things.
Mark Bofill says: “All it shows is an increased concentration in the atmosphere of certain gases.”
No — they show these higher concentrations are reducing the amount of longwave radiation leaving Earth.
Independent measurements show their concentrations are increasing. If there weren’t greenhouse gases, there’s be no dips in OLR at their absorption frequencies. If the greenhouse effect wasn’t increasing, there’d be no change in these dips. But there is.
Phobos said:
” No — they show these higher concentrations are reducing the amount of longwave radiation leaving Earth.”
The problem with this is that it doesn’t preclude an even larger variable (such as water), that compensates for the slight increase from Co2. The combined effect doesn’t change. While temps went up, I’ll repeat yet again, night time cooling didn’t change.
philincalifornia says:
“He could be an idiot, or just a sh!t scientist like the rest of them.
More likely, he doesn’t actually think that, as he’s a paid liar/climate fraudster.”
Do you have anything scientific to say? Or just insults? Insults convince no one, and reflect poorly on the one making them.
@MiCro:
IPCC 4AR WG1:
“From 1950 to 2004, the annual trends in minimum and maximum land-surface air temperature averaged over regions with data were 0.20°C per decade and 0.14°C per decade, respectively, with a trend in diurnal temperature range (DTR) of –0.07°C per decade.”
http://www.ipcc.ch/publications_and_data/ar4/wg1/en/ch3s3-2-2.html
@Mark Benson,
That’s nice, but nothing to do with what I said, or was talking about.
You’d have to go read my work. But you’ve already dismissed it.
Is it a surprise that GISS, CRU, and BEST all get the same answer, when they’re doing the same thing?
RACookPE1978 says: “There was essentially NO change in CO2 levels from man’s activity before 1960.”
No — by 1960 the atmospheric CO2 level was 13% higher than the preindustrial level, with an associated additional radiative forcing of about 0.7 W/m2.
Phobos says:
March 3, 2013 at 6:32 pm
“That’s why the decrease in brightness temperature is the *best* measurement of an enhanced greenhouse effect — it is independent of all the other complicating factors.”
You are hanging your hat on a small number of measurements from different instruments taken decades apart under unlike, uncontrolled conditions. The calibrations alone have enough fudge factors that you can get anything you like out of the farrago. You really don’t understand science.
The best, most up-to-date, and most reliable measurements indicate that temperatures are responsible for the rise of CO2, and not the other way around.