Guest post by Dr. Leif Svalgaard
The official sunspot number is issued by SIDC in Brussels http://sidc.be/sunspot-data/ . The [relative] sunspot number was introduced by Rudolf Wolf http://en.wikipedia.org/wiki/Rudolf_Wolf in the middle of the 19th century. He called it the ‘relative’ number because it is rather like an index instead of the actual number of spots on the Sun. Spots occur in groups [which we today call ‘active regions’] and Wolf realized that the birth of a new group was a much more significant event than the emergence of just a single new spot within a group, so he designed his index, R, [for any given day] to be a weighted sum of the number of spots, S, and the number of groups, G, giving the groups a weight of 10: R = S + 10*G. The number of 10 was chosen because on average a group contains about 10 spots, and also because it is a convenient number to multiply by.

Later, Wolf introduced the so-called ‘k-factor’ to compensate for differences in the size of telescope, precise counting method, observer acuity, etc, in order to bring the relative sunspot number determined by another observer on to the same scale as Wolf’s: R = k (10*G + S), where k is 1 for Wolf himself using his ‘standard telescope’ [Figure 1a,b] and his rules [not counting the smallest spots] for counting spots. From the 1860s Wolf had to travel extensively and he used exclusively [for the rest of his life] a much smaller telescope [Figure 1c]. With a smaller telescope Wolf, obviously’ saw fewer spots [and groups!], so he used k = 1.5 to convert his counts to the scale of the standard telescope.
Wolf’s successor, Alfred Wolfer, thought [rightfully] that the rule of ‘not counting the smallest spots’ was too vague and advocated to count all spots and groups that could be seen. This, of course, made his count larger than Wolf’s, so based on overlapping counts during 1876-1893, determined that to place his [Wolfer’s] relative number on to the Wolf scale he should multiply by 0.6 [one could say that his k-factor was 0.6]. This conversion factor of 0.6 has been adopted by all [Zurich] observers ever since. Adopted, not measured, as Wolf is not around any more. SIDC adopts that same factor, thus striving to stay on the Zurich scale.
So far, so good. But at some point in the 1940s, the Zurich observers began to ‘weight’ sunspots according to size and complexity, such that large spots would not be counted just once [as Wolf and Wolfer did], but up to five times, i.e. given a weight of five. There is nothing wrong with that, if one then also adjusts the k-factor to reflect this new way of counting. The director of the Zurich observatory from 1945-1979, Max Waldmeier, may have thought [?] that the weighting was introduced a long time ago [he mentions ‘about 1882’] so that no change of k-factor would be needed. Waldmeier set up a station in Locarno in southern Switzerland [as the weather on the other side of the Alps is often complimentary to that in Zurich] to provide observations when it was cloudy in Zurich. The observers in Locarno [Sergio Cortesi began in 1957 and is still at it] were instructed to use the same weighting scale as Waldmeier in Zurich. Because SIDC to this day normalize all observations they collect from a network of 60-70 observers to the count from Locarno, the weighting scheme carries over unchanged to the modern sunspot number.
We know that Wolfer did not weight the spots [contrary to Waldmeier’s assertion], because Wolfer himself explicitly [in 1907] stated that each ‘spot is counted only once, regardless of size’, and also because Wolfer’s counts as late as in 1924 when compared to other observers’ simply show that single spots are counted only once no matter how large.
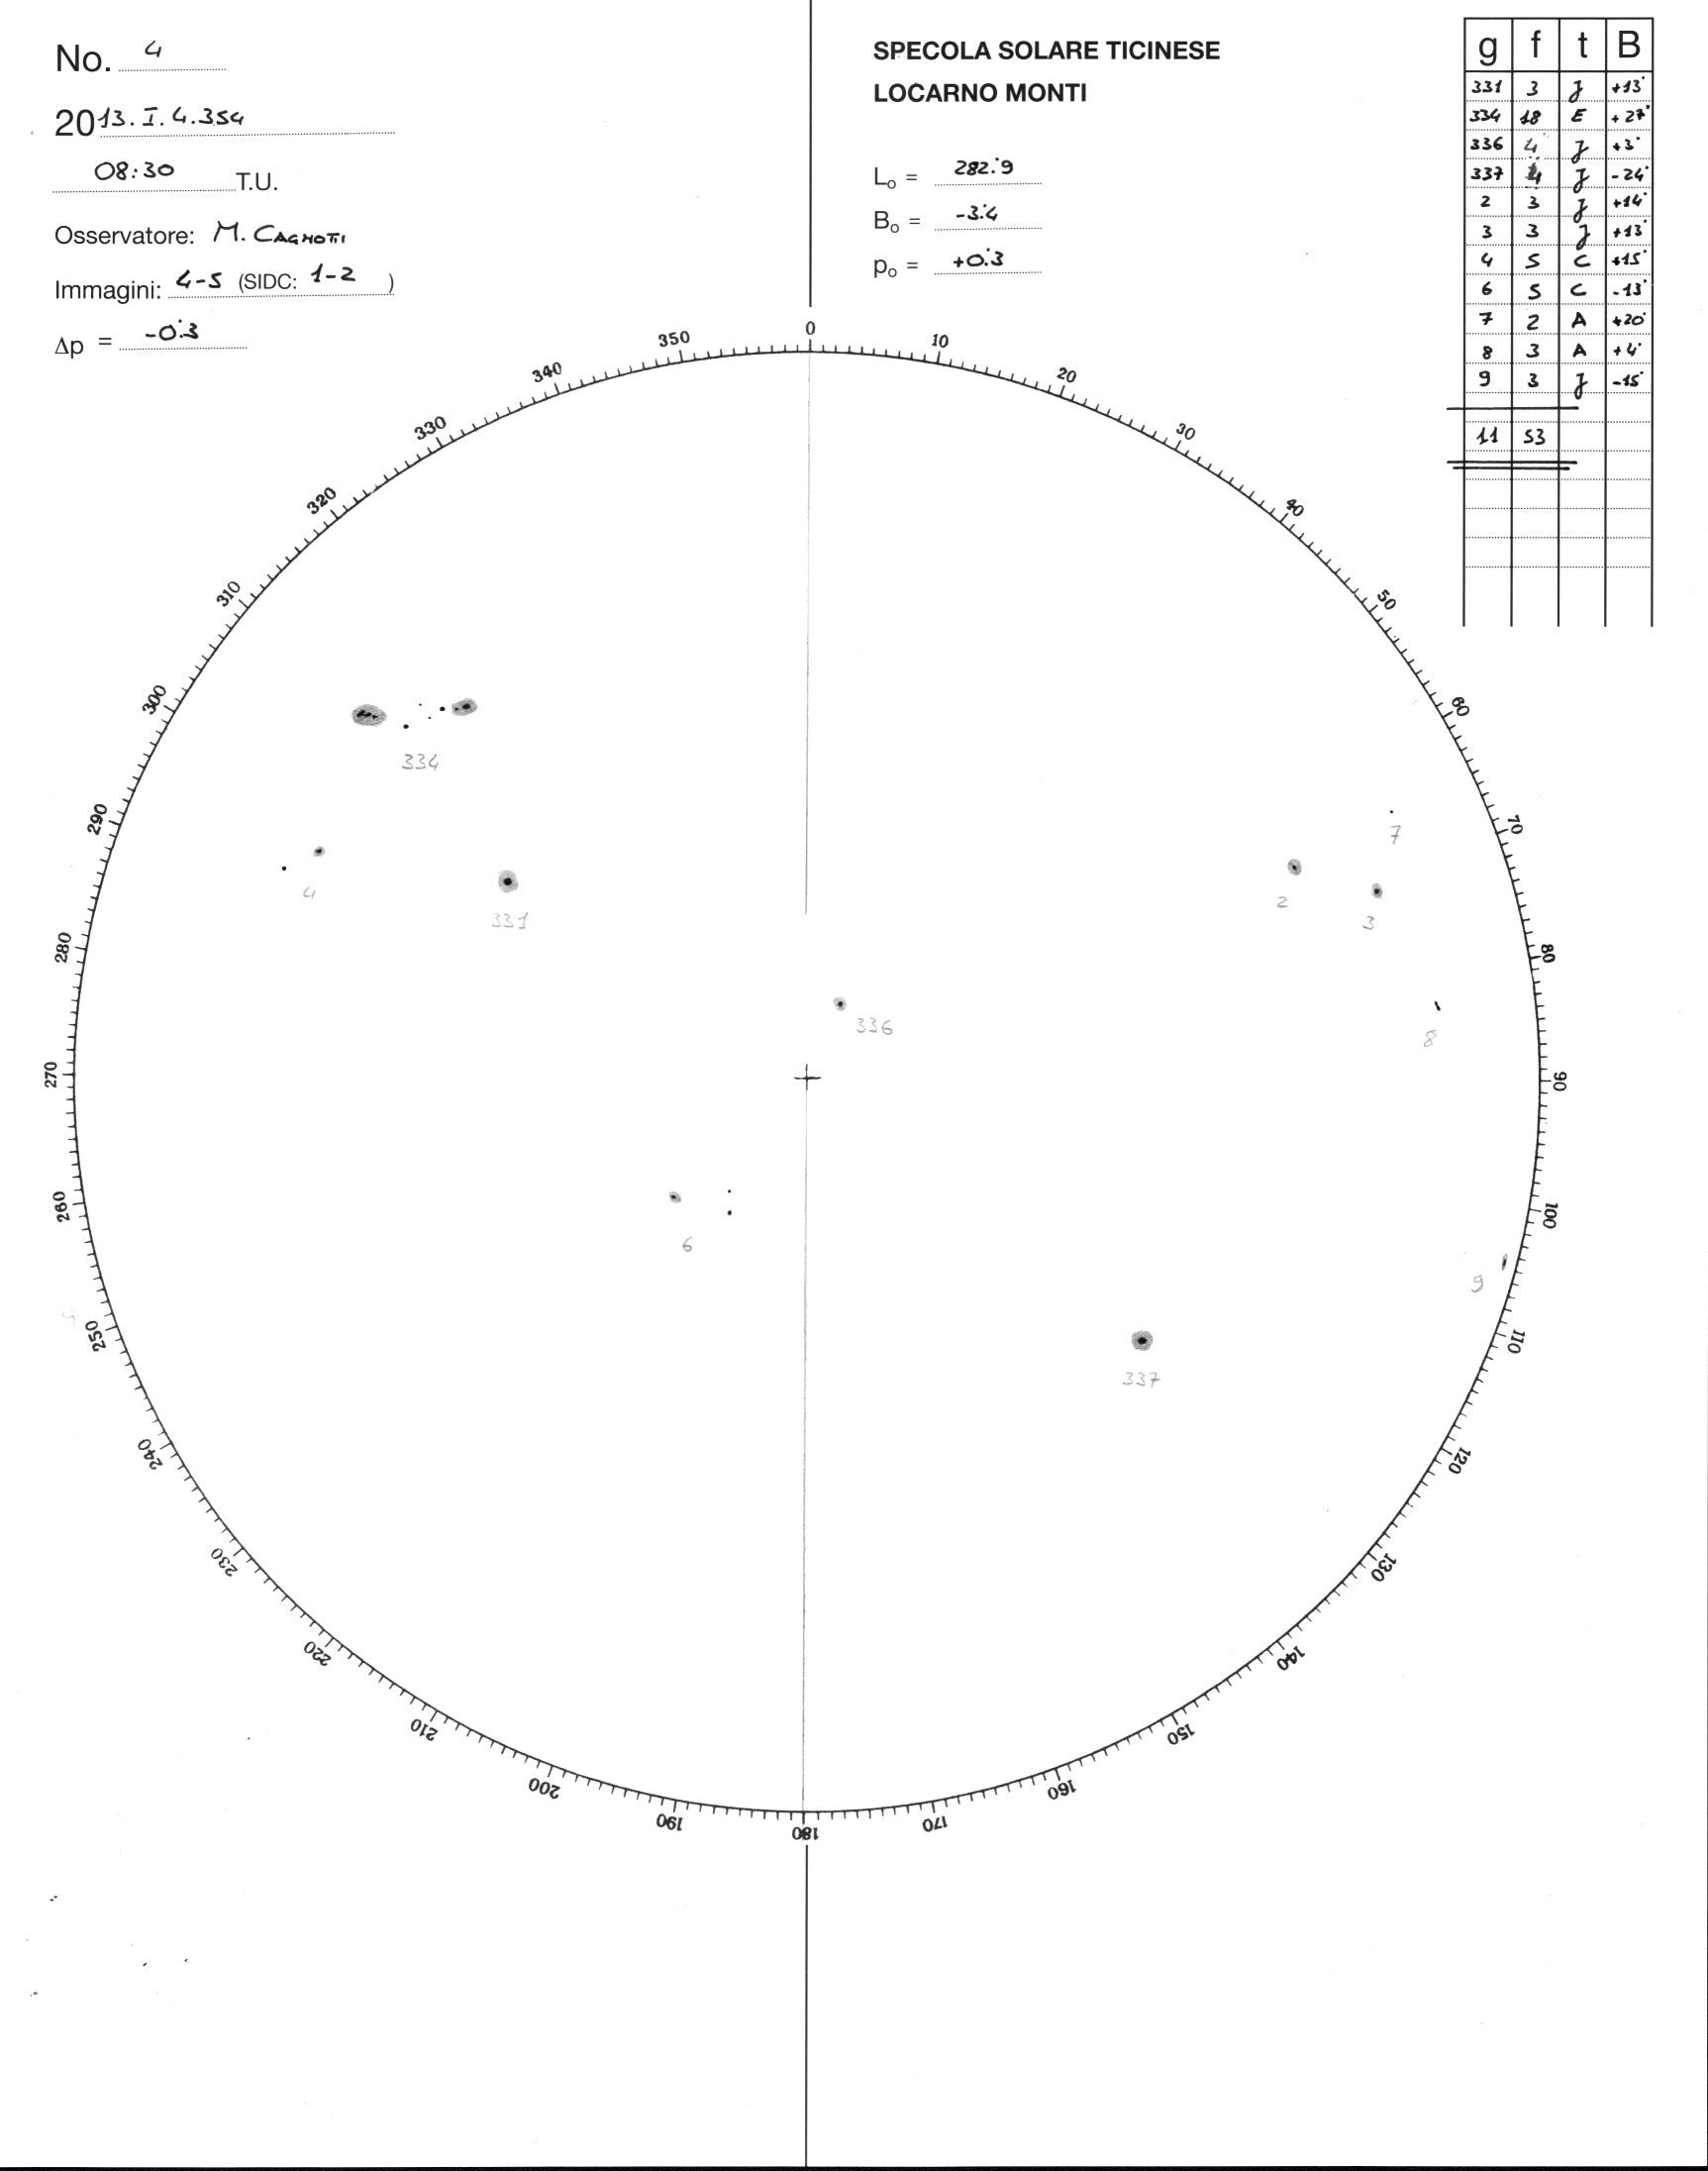
To get a feeling for how the weighting works, try to count the spots on the Locarno drawing for today http://www.specola.ch/drawings/2013/loc-d20130104.JPG and compare your counts with the values given for each numbered group in the little table at the upper right.
![loc-d20130104[1]](http://wattsupwiththat.files.wordpress.com/2013/01/loc-d201301041.jpg?quality=83)
(Note: I did this exercise, and found that my layman’s count was much lower than the “official” count, lending credence to Leif’s premise. Try it! – Anthony)
Marco Cagnotti’s [from Locarno] count is 11 groups and 53 ‘weighted’ spots. My count of the actual number of spots is 23. Try it for yourself. Your count may differ by about one from mine, but that does not change the fact that the weighted relative number 10*11+53=163 is about 23% larger than the ‘raw’, simple count of 10*11+23=133 that Wolfer and Wolf would have reported. For the whole of 2012 the ‘over count’ was 18%. So, it seems that the relative sunspot number suffered a 20% inflation because Waldmeier did not change his k-factor to compensate for the weighting.
Can we verify any of this? Well, one verification you can do yourself: just count the spots. But a better test is to ask the Locarno observers to report two numbers: the weighted count as usual and the unweighted count, where each spot is counted just once. Such a test has been [as is being] done. Figure 2 shows the effect of the weighting. Blue symbols show the official weighted count, and red symbols show Marco and my raw counts. The conclusion should be obvious.

The top panel of Figure 3 shows how well the sunspot number calculated from this formula matches that reporter by the Zurich observers.

Applying the same formula to data after 1945 gives us the lower panel. Under the assumption that the Sun did not know about Waldmeier we would expect the same relationship to hold, but in fact there is an abrupt change of the observed vs. the expected sunspot numbers between 1946 and 1947 of [you guessed it] 20%. Several other solar indicators give the same result. So there are several smoking guns.
What to do about this? One obvious thing would be to simply to remove the inflation [dividing the modern sunspot number by 1.20] and to stop weighting the spots. This turns out to be a bad idea, at least users of the sunspot numbers complain that they do not want to change the modern numbers as they are used in operational programs. The next-best thing is to adjust the old numbers before 1947 by multiplying them by 1.20. This is what we have decided to do [at least for now]. Who are ‘we’? You can see that here http://ssnworkshop.wikia.com/wiki/Home
There is a precedent for this [with the same ‘solution’]. In 1861 Wolf had published his first list of relative sunspot numbers, which he then updated every year after that. But about 1875 he realized that he had underestimated Schwabe’s counts [which formed the backbone of the list before Wolf’s own observations began in 1849]. Consequently, Wolf increased wholesale all the published sunspot numbers before 1849 by 25%. So we are in good company.
A somewhat disturbing [to many people] consequence of the correction of the official sunspot number is that there is now no evidence for a Modern Grand Maximum [‘the largest in 8000 years’ or some such].
NOTE: Figure 4 added 1/5/13 at Leif’s request

Thanks, Leif. And a Happy New Year to you!
An informing and interesting post, thank you Leif and Anthony!
I suspect that you mean “no evidence in the adjusted sunspot counts.” There are other lines of evidence, including beryllium-10 as a proxy (which is actually a proxy for galactic cosmic rays, themselves an implied proxy (as a reciprical) for solar wind which has been connected with sunspots.
While the connection to sunspots directly from this measure is tenuous, Be-10 is a more direct proxy for solar output in general, and this seems to correspond reasonably well to other measurements including the old-style sunspot measurements.
Independent of sunspots, the sun seems to vary over time, was high recently, and is dropping now — something you noted yourself on the last page of your report.
As you said: “Exciting times!”
===|==============/ Keith DeHavelle
Thanks, Dr. Leif, this is timely, as i wait the December SSN and its effect on the Smoothed Monthly Values. I’ve read a good bit of your papers site, and understood somewhat less. We live in interesting times.
Nice. At least the time series hasn’t been *deliberately* distorted, unlike some we could all mention.
PS: Either need a bigger screen or new glasses – only counted 17.
but would it be fair to say we are going into a minimum ??
As I understand it, Solar Maximum is defined when the Northern and Southern solar hemispheres’ magnetic fields reach a minimum and reverse polarity. They’re close but SC-24 maximum still approaches.
I was fine up to and including the 1+1 = 2 part… after that I kinda lost the thread and it got a little vague — maybe if I re-read… 😉
The graphic is in this file http://www.leif.org/research/AGU%20Fall%202012%20SH12A-07.ppt
Slide number 3
Thank you Dr. Svalgaard. I’m sure the pure minded are upset. As long as things are on the same relative base and no one is trying to calculate some absolute value, it makes little real difference. The danger, always present, is people will run off making assumptions that are not founded in facts but suppositions.
A worthwhile posting; should help to clear up some of the confusion seen on WUWT
“A somewhat disturbing [to many people] consequence of the correction of the official sunspot number is that there is now no evidence for a Modern Grand Maximum [‘the largest in 8000 years’ or some such].”
What does that mean?
Rather, what are the implications of that statement? (The consequences of not having had a Modern Grand Maximum.)
I am aware I may be showing some ignorance here; humor me, please.
But isn’t all of this a bit simplistic? It assumes that 10 is the appropriate correction factor at minimum and maximum, and in active and inactive solar cycles, and in cycles with a Livingston and Penn effect and those without. Why not just count the visible spots above a certain size and call it a day.
Why is it that every single data series has to be tampered with? How the hell can you expect to get a fair comparison of past events to current events if you “adjust” the record? Oh, wait …
Keith DeHavelle says:
January 4, 2013 at 3:07 pm
Be-10 is a more direct proxy for solar output in general
No, 10Be depends on the geomagnetic field [the biggest factor], climate [the next biggest], and finally solar activity.
fred says:
January 4, 2013 at 4:03 pm
Why not just count the visible spots above a certain size and call it a day.
That is what we suggest. That ‘certain size’ being zero.
markstoval says:
January 4, 2013 at 4:08 pm
Why is it that every single data series has to be tampered with?
Why is it that some people cannot follow a straightforward demonstration?
Great/interesting post.
@markstoval,
Except that in the case of the sunspot numbers you don’t have a continuous string of consistent observations. Observations in different time periods were done use different methods and the variance in this case is a process not a technology issue. It is therefore impossible to make a valid comparison between current and past observations without adjusting one or the other.
This can be a problem in the land surface temperature records as well, but it the case of temperature it is minor vs all the other problems.
why on earth would someone say-
“A somewhat disturbing [to many people] consequence of the correction of the official sunspot number is that there is now no evidence for a Modern Grand Maximum [‘the largest in 8000 years’ or some such].”
that makes no sense at all. first if you add both those charts together, you see no difference than the ‘uncorrected’ figures, it still peaks around 19 and 21 and 22 are higher than earlier years. ie it is still on the rise until the great crash of 23/24. its obvious even in the butterfly diagram-
http://en.wikipedia.org/wiki/File:Sunspot-bfly.gif
the beryllium proxy also backs up the recent high conditions.
Leif
In an earlier track you provided the decadal average sunspot numbers for the new derived sunspot numbers for the period 1830 to1940. Is there a source for the derived annual figures? Also to what extent have these new numbers been accepted by all of your colleagues?
Just to confirm explicitly what you are implying in your response: When you wrote “there is now no evidence for a Modern Grand Maximum” you are now correcting this to note that there is indeed some evidence for this solar maximum outside of sunspots.
It seems to me that you are overstating the case even so, with regard to sunspots. Using your corrected numbers, sunspot activity for the last half of the 20th century is visibly higher than the prior half, and 20C values higher than earlier centuries. That the sunspot activity might vary somewhat less than thought does not mean that it is not varying significantly, agreed?
The math isn’t hairy
And logic’s not scary
But here I would parry
The numbers still vary
The new count of spot
Might be less than thought
But if they’re more hot
Then what have you got?
===|==============/ Keith DeHavelle
Leif, as always, most informative. My thanks.
w.
Ach, Waldmeier… Perhaps, after Wolf and Wolfer, had they chosen a guy named “Wolfest” to the post we would have been spared this apotheticary accounting!
Yet on Figure 3, discarding the infamous blue curve and only using the virtuous red curve (Rc), we still end up with the top of 1935-1944 and 1955-1964 solar cycles spot count culminating over all others. Furthermore, all solar cycles post 1945, except the 1970 centered one -and so far cycle 24-, still exhibit more 100 counts than their pre-1945 ancestors.
Is this spurious or the reality?
When I started reading, I was afraid that I was going to discover yet another series that has been deliberately distorted. Fortunately, here, people still seems to be looking for the truth and not busy hiding it.
MattS says:
January 4, 2013 at 4:34 pm
It is therefore impossible to make a valid comparison between current and past observations without adjusting one or the other.
Wolf himself discovered [and actually used] how to make a valid comparison. Perhaps a topic for a future post, but here is the basic idea:
http://www.leif.org/research/Geomagnetic%20Calibration%20of%20Sunspot%20Numbers.pdf
mobihci says:
January 4, 2013 at 4:36 pm
it still peaks around 19 and 21 and 22 are higher than earlier years. ie it is still on the rise until the great crash of 23/24. its obvious even in the butterfly diagram-
Indeed some cycles are higher than others. The point is that there are high cycles in every century and no long-term trend the past 300 years.
herkimer says:
January 4, 2013 at 4:37 pm
derived annual figures? Also to what extent have these new numbers been accepted by all of your colleagues?
The simplest is to multiply all sunspot numbers [which you can ghet from SIDC] by 1.2 before 1947.
There is no doubt about the discontinuity arounbd 1946. And the remedy for it. There can be [and is] debate as to how good the numbers [even after correction] are for the early part of the series, e.g. before 1825. This issue is the topic for the next two workshops scheduled for later this year.
Keith DeHavelle says:
January 4, 2013 at 5:01 pm
Just to confirm explicitly what you are implying in your response: When you wrote “there is now no evidence for a Modern Grand Maximum” you are now correcting this to note that there is indeed some evidence for this solar maximum outside of sunspots.
No, that is not what I meant.
Using your corrected numbers, sunspot activity for the last half of the 20th century is visibly higher than the prior half, and 20C values higher than earlier centuries.
Indeed some cycles are bigger than others. The point is there are high cycles in every century. Some 20C cycles are high, but do not qualify as a ‘Grand Maximum’. Now, one can debate the semantics of ‘Grand Maximum’. What is usually meant can be seen in slides 4-7 of http://www.leif.org/research/The%20long-term%20variation%20of%20solar%20activity.pdf
Leif is a true scientist. He doesn’t make extravagant claims about things he doesn’t know. He makes conservative statements about things he is sure about. He openly states the limits of his knowledge, and if challenged can explain absolutely everything he does in as much detail as his audience can comprehend. He never appeals to authority or talks down to people. He doesn’t need to do that. He just knows more about sunspots than just about anyone else in the world. That what a scientist should be like and indeed what most scientists are like.
As Leif notes some here would find a grand solar maximum convenient as is would help to provide an alternative explanation for the late 20th century temperature increase. Nevertheless Leif can come here and argue with those who disagree with him and wipe the floor with anyone who chooses to challenge him on his subject, the sunspot record. This is what a scientist should be.
Could you imagine Mann trying to defend his hockey stick here? He’d get his head handed to him.