 Guest post by Alec Rawls
In an interview with NewScientist magazine, Imperial College professor of atmospheric physics Joanna Haigh scoffs at the idea that late 20th century warming could have been caused by the sun:
Haigh points out that the sun actually began dimming slightly in the mid-1980s, if we take an average over its 11-year cycle, so fewer GCRs should have been deflected from Earth and more Earth-cooling clouds should have formed. “If there were some way cosmic rays could be causing global climate change, it should have started getting colder after 1985.”
What she means is that the 20th century’s persistent high level of solar activity peaked in 1985. That is the estimate developed by Mike Lockwood and Claus Fröhlich. The actual peak was later (solar cycle 22, which ended in 1996, was stronger than cycle 21 by almost every measure) but set that aside. Who could possibly think that cooling should commence when forcings are at their peak, just because the very highest peak has been passed?
Haigh’s argument against solar warming was in response to my suggestion that one new sentence in the leaked Second Order Draft of AR5 is a “game changer.” That is the sentence where the authors admit strong evidence that some substantial mechanism of solar amplification must be at work. The only solar forcing in the IPCC’s computer models is Total Solar Irradiance so if some solar forcing beyond TSI is also at work then all their model results are wrong.
No, no, no, Haigh told the NewScientist, it is “the bloggers” who have it all wrong:
They’re misunderstanding, either deliberately or otherwise, what that sentence is meant to say.
Look whose accusing people of misunderstanding. This woman thinks that warming is driven, not by the level of the temperature forcing, but by the rate of change in the level of the forcing. When a forcing goes barely past its peak (solar cycle 22 nearly identical in magnitude to cycle 21), does that really create cooling? Haigh should try it at home: put a pot of water on a full burner for a minute then turn the burner down to medium high. Does she really think the pot will stop warming, or that it will actually start to cool?
“Deliberately or otherwise,” this is an astounding misunderstanding of the very most basic physics, and Haigh is not the only consensus scientist who is making this particular “mistake.” Hers is the stock answer that pretty much every “consensus” scientists gives when asked about the solar-warming hypothesis. I have collected examples from a dozen highly regarded scientists: Lockwood, Solanki, Forster, Muscheler, Benestad, and more. Not surprisingly, it turns out that they are all making some crucial unstated assumptions.
Solar warming and ocean equilibrium
To claim that the 20th century’s high level of solar forcing would only cause warming until some particular date such as 1970, or 1980, or 1987, one must be assuming that the oceans had equilibrated by that date to the ongoing high level of forcing. That’s just the definition of equilibrium. After a step up in forcing the system will continue to warm until equilibrium is reached.
When I asked these scientists if they were making an unstated assumption that the oceans must have equilibrated by 1980 say to whatever forcing effect high 20th century solar activity was having, almost all of them answered yes, each giving their own off-the-cuff rationale for this assumption, none of which stand up to the least bit of scrutiny. Isaac Held’s two-box model of ocean equilibration is better than Mike Lockwood’s one-box model, but just move to the next simplest model, a three-box model of ocean equilibration, and any idea that longer term forcing won’t cause longer term warming collapses.
The well mixed upper ocean layer (the top 100-200 meters) does equilibrate rapidly to a change in forcing, showing a response time of less than ten years, but that isn’t the end of the story. As the top layer warms up it transfers heat to the next deeper ocean layers. If the elevated forcing persists then these next deeper layers will continue to warm on the time scale of multiple decades to multiple centuries. This warming will reduce the temperature differential between the upper and deeper layers, causing there to be less and less heat loss over time from the upper to the deeper layers, causing the upper layer to continue to warm on the time scale of multiple decades to multiple centuries.
This accords with what we actually see. Since the 50 year absence of sunspots that coincided with the bottom of the Little Ice Age, 300 years of uneven warming have coincided with an uneven rise in solar activity. Any claim that these three centuries of natural warming had to have ended by a particular 20th century date (never mind right when solar activity was at its peak), is at the very least highly speculative. To claim that we can be confident that this is what happened is borderline insane.
Or maybe it’s that other thing that Joanna Haigh insinuates about. Maybe there is an element of deliberateness to this “misunderstanding” where scads of PhD scientists all pretend that warming is driven by the rate of change of the temperature forcing, not the level of the forcing. How else to blame late 20th century warming on human activity? Some rationale has to be given for why it can’t have been caused by the high level of solar activity that was still raging. Aha, what if temperature were driven by the trend in the forcing rather than the level of the forcing? That would do it. Let’s say that one. Let’s pretend that even peak forcing will cause cooling as soon as the trend in the forcing turns down.
It’s one psycho-drama or the other: either Haigh’s insinuations about dishonesty are projection, accusing others of what she and her cohorts are actually doing, or she’s just dumber than a box of rocks.
Haigh also channels Steven Sherwood, pretending that the highlighted sentence is just about GCR-cloud
The draft report acknowledges substantial evidence for some mechanism of solar amplification and lists Henrick Svensmark’s GCR-cloud theory as an example of one possible such mechanism (7-43 of the SOD):
Many empirical relationships have been reported between GCR or cosmogenic isotope archives and some aspects of the climate system (e.g., Bond et al., 2001; Dengel et al., 2009; Ram and Stolz, 1999). The forcing from changes in total solar irradiance alone does not seem to account for these observations, implying the existence of an amplifying mechanism such as the hypothesized GCR-cloud link.
Haigh claims that the evidence about cloud formation being induced by cosmic rays points to a weak mechanism, then simply ignores the report’s admission of substantial evidence that some such mechanism must be at work:
Haigh says that if Rawls had read a bit further, he would have realised that the report goes on to largely dismiss the evidence that cosmic rays have a significant effect. “They conclude there’s very little evidence that it has any effect,” she says.
Rawls says that if Haigh had read the actual sentence itself, she would have realized that it isn’t about galactic cosmic rays, but only mentions GCR-cloud as one possible solar amplifier.
Aussie climatologist Steven Sherwood did the same thing, claiming (very prematurely) that the evidence does not support GCR-cloud as a substantial mechanism of solar amplification, then pretending away the report’s admission of clear evidence that some substantial such mechanism is at work:
He says the idea that the chapter he authored confirms a greater role for solar and other cosmic rays in global warming is “ridiculous”.
“I’m sure you could go and read those paragraphs yourself and the summary of it and see that we conclude exactly the opposite – that this cosmic ray effect that the paragraph is discussing appears to be negligible,” he told PM.
As JoNova and I blogged last weekend, this ploy inverts the scientific method, using theory (dissatisfaction with one particular theory of solar amplification) as an excuse for ignoring the evidence for some mechanism of solar amplification. Using theory to dismiss evidence is pure, definitional anti-science. Unfortunately, NewScientist gives this slick anti-scientist the last word:
“The most interesting aspect of this little event is it reveals how deeply in denial the climate deniers are,” says Steven Sherwood of the University of New South Wales in Sydney, Australia – one of the lead authors of the chapter in question. “If they can look at a short section of a report and walk away believing it says the opposite of what it actually says, and if this spin can be uncritically echoed by very influential blogs, imagine how wildly they are misinterpreting the scientific evidence.”
Sherwood and Haigh are flat lying to the public about what a simple single sentence says, pretending the admission of strong evidence for some substantial mechanism of enhanced solar forcing was never made, then trusting sympathetic reporters and editors not to call them on it. This is why the report had to be made public. After my submitted comments showed how thoroughly the new sentence undercuts the entire report it was obvious that the consensoids who run the IPCC would take the sentence right back out, and here Sherwood and Haigh are already trying to do exactly that.
Too late, anti-scientists. Your humbug is on display for the whole world to see.
Elsewhere we call the system response to a step change ‘inertia’ – she could easily look the word up if she were a real scientist. The thermal inertia involved in 1.4 billion cubic kilometres of liquid water washing around a bumpy sphere for example.
You’ve really got to wonder about Leif.
I’ve just been to the sidebar on this very page.
There is a chart of solar activity courtesy of NASA (sunspots as percentage of visible hemisphere)
It shows QUITE CLEARLY that solar activity has been increasing since the 1880 cycle up to a peak in the 1960s, a dip in the 70s then a secondary peak in the 90s.
We’re now back in la-la land. Who do we believe, Nasa/Grenwich etc (and our own eyes)
or Leif who claims that the opposite is happening?
Tell you what, he might be a ‘scientist’ (tugs forelock respectfully) but I wouldn’t let Dr Svalgaard near the air-conditioning controls of a building!
Its not just solar radiance. It is also the number of electrons and protons(solar wind) impacting earth.
This can cause “electrical” heating effects…
Alec Rawls says:
December 21, 2012 at 11:24 am
how about YOU reading the sentence Alec. In legal papers, ambiguities are often resolved by repeating a clause, so I do that. Here it is:
“7.4.5.1 Correlations Between Cosmic Rays and Properties of Aerosols and Clouds
Many empirical relationships have been reported between GCR or cosmogenic isotope archives and some aspects of the climate system (e.g., Bond et al., 2001; Dengel et al., 2009; Ram and Stolz, 1999). The forcing from changes in total solar irradiance alone does not seem to account for the empirical relationships that have been reported between GCR or cosmogenic isotope archives and some aspects of the climate system, implying the existence of an amplifying mechanism such as the hypothesized GCR-cloud link.”
to explain to empirical relationships that have been reported between GCR or cosmogenic isotope archives and some aspects of the climate system provided they hold up. The report then goes on the point out that the correlations do not hold up: “Although there is some evidence that ionization from cosmic rays may enhance aerosol nucleation in the free troposphere, there is medium evidence and high agreement that the cosmic ray-ionization mechanism is too weak to influence global concentrations of CCN or their change over the last century or during a solar cycle in any climatically significant way. The lack of trend in the cosmic ray intensity over the last 50 years provides another strong argument against the hypothesis of a major contribution of cosmic rays to ongoing climate change.”
Until we understand why the MWP dropped away into the LIA, we cannot understand how the LIA ended.
Talk of Maunders and Daltons is only part of the story. The transition from MWP began around 1200AD, so other factors must have been in play.
This seems to be the elephant in the room that so many scientists like Haigh try to ignore.
Alec Rawls says:
December 21, 2012 at 11:24 am
Leif says that …Haigh is “absolutely correct” …. Read the SENTENCE Leif. It says exactly what I say it says. Haigh is indeed “flat our lying” about it, and now you are making inane excuses for her lying, pretending that sentences are limited by section headings. Sheesh.
>>>>>>>>>>>>>>>>>>>>>>>>>>>>>>>>>>>
I find it very interesting that L.S. and other scientists are now ‘reworking’ the historic sunspot numbers…..
Carter says:
December 21, 2012 at 10:56 am
“‘Learn to think and speak for yourself for a change’ the reason I can see so far ahead is because I’m standing on the shoulders of giants, were as you are only standing on their toes!
Mr Carter continues to sucumb to Skeptical Science Syndrome. He does not realize that as we peer down on those “giants” they keep getting smaller and smaller and smaller.
In fact, they are now so small that they are invisible.
Indeed.
40,000 years ago, weren’t we still in the midst of an ice age? Maybe a large increase in GCR, with the climate in that state, is just not going to make the difference it might with the climate in the current state.
Paul Homewood says:
December 21, 2012 at 11:44 am
Until we understand why the MWP dropped away into the LIA, we cannot understand how the LIA ended. … This seems to be the elephant in the room that so many scientists like Haigh try to ignore.
what is there to ignore. Here is how the MWP ended compared to the ‘solar activity record’. although labelled TSI, it is really derived from the cosmic ray record:
http://www.leif.org/research/Does%20The%20Sun%20Vary%20Enough.pdf slide 20.
It seems to me that the solar enthusiasts are the ones ignoring the elephant.
Much of the “evidence” for solar activity being a strong driver for temperature is based on kind of argument that temperature should be proportional to forcing that Rawls denounces here. Should we now discount papers like Friis-Christensen & Lassen, and what really remains of the evidence if we do that?
A simple caution to all involved in looking for a “solar-and-temperature” relationship – or any other fundamental “cause” of global climate changes.
The Mid-Atlantic rift existed for some 60 million years – before it was PLOTTED on ocean depth sounders and strip charts. Continental drift existed since Pangaea was broken up – but was not discovered either.
The strip charts existed (data existed!) on paper as evidence LONG before they were read and plotted on maps to show where the mid-Atlantic rift actually was.
Other seismologists had plotted mid-ocean earthquakes, but did not realized they were plotting a 48,000 mile continuous mid-ocean rift zone (separation zone) that explained continental drift.
Geology textbooks could not explain mountains and valleys – but were written anyway. Geology classes were taught anyway. Critics of mountain-building theories were rejected – because they could not propose an alternative “theory” …. But the Alps, Rockies, and Andes were still there. The sea-life fossils were still up high in the mountains. Meteoric rocks DID FLY – but could not be explained.
Continental drift had been discussed and proposed as a SYMPTOM since before Ben Franklin’s day – but was equally rejected – viciously! – by orthodox scientists and scientific organization because “it had no mechanism’ – it had ” no theory to explain it”. The trenches and edge-volcanoes existed around the opposite side of the drifting continental shelves – but were not linked either by theory or by scientists. But – they were still there, just NOT “observed” and written in peer-reviewed papers.
Papers and scientific meeting reviewing and proposing continental drift were rejected vehemently by editors and reviewers – but those same papers were right! The peer-review was wrong!
But – continental drift and plate tectonics EXISTED and WERE CONTINUING despite the absence of a theory or the math or the physics to explain them.
Likewise, simple observations are NOT always enough. If you did not know each bay and inlet geometry, you could reasonably reject the moon as a cause of the tides that are inches high in the Gulf of Mexico and Mediterranean Sea, but tens of feet high in the Gulf of Fundy. You would very properly reject two tides a day of varying heights through the year if you did not know about fluid flow and gravity, about changes in the sun’s pull over the year. If you did not know the upstream floods and droughts – would get a proper tidal chart by only correcting for the sun? Or would you REJECT a proposed solar influence on tides BECAUSE you saw the influence of droughts and floods regularly each summer, spring and fall?
We only “think” we know all of the influences. And we DO confuse “symptoms” of influences for the theory itself. Thus, volcanoes along the Pacific coasts and a mid-Atlantic rift are a SYMPTOM of continental drift, NOT the cause of it. (The cause is underneath both – but NOT visible on the surface.) Sun spots may a SYMPTOM of what might change solar changes in the earth’s climate – but may not be the CAUSE of those changes that accompany sunspot changes.
Lunar craters look like earth-bound volcanoes …. But are not. Lunar seas “look like” earth oceans – and are, in their own way, from “liquid rock” flowing like oceans on earth. You cannot extrapolate too far or you will be wrong! Dead wrong. Equally, you cannot FAIL to extrapolate between “It-is-impossible-to-get-water-on-the-moon” scenarios so the “Mares” cannot be liquid! (Now, why are there no lunar Mares on the back side? )
Humility is required. On every new idea. by both “experts” in the status quo – “we know” – community, and by the “This is a new idea that matches (some) observations, but it has no theory behind it” community.
Correct observations may be explained by a wrong theory.
A wrong theory may explain incomplete – or incorrect – observations.
(Newton and Kepler both explained what was observed at the time of their theories – neither works well near the speed of light.)
Therefore, I caution every one that “observations” of related events – AND unrelated events important to the final theory! – may come well before the theory. And that first theory, that second theory, that correction to the second theory, that third or fifteenth theory may be wrong!
Doesn’t change the observation that proves the final theory.
Nor does it change those “incorrect” observations unrelated to the first, fourth, or fifteenth theory that were wrong!
Doesn’t change the “unrelated observations” that prove the sixteenth theory correct.
Doesn’t make the first theory complete either.
Charles Gerard Nelson says:
December 21, 2012 at 11:40 am
It shows QUITE CLEARLY that solar activity has been increasing since the 1880 cycle up to a peak in the 1960s
And before the 1880 cycle activity was decreasing from the 1830-1875 peaks… There has been a roughly 100-yr ‘cycle’ in activity the past 300 years, so numbers go up and down.
Mr Watts:
“The spoken word has much inflection that adds communication, whereas the Internet written word, rattled off as a short comment, basically leaves it in a confused or incomplete comprehension state. The onus is on the commenter to be clear and precise.”
Some people like to try “cool and clever”. Other people prefer “clear and precise”. Just different flavours of expression, that’s all.
Generally speaking, the “cool and clever” people find it hard to bother with reaching all the way down to the boringly pedantic “clear and precise” people.
mike g says:
December 21, 2012 at 11:50 am
40,000 years ago, weren’t we still in the midst of an ice age? Maybe a large increase in GCR, with the climate in that state, is just not going to make the difference it might with the climate in the current state.
Sounds like special pleading to me. Would you have said the same if there HAD been a climate response? That is: ‘the climate response is spurious because we were in the midst of an ice age, so conditions were different and we would not expect a response’.
Some mechanism involving solar other than GCRs…..
My favourite (because I thought of it) does not seem to have been picked up by anybody. I even posted it on Svalgards blog and used his name instead of Svenmarks (sorry) and posted it in the wrong place (sorry again). Anyway..
The basic idea followed on from a discovery that was made a few years ago that the resistivity of the solar corona associated with lateral flare currents was not the expected Spitzer resistivity. It turned out to be six orders of magnitude out and very close to that of sea water. So we are ballpark correct in saying that (by the maximum power transfer theorem) that coupling between the Sun’s and Earth’s magnetic fields will lead to much stronger induced currents in the oceans when the sun is more active. This could source the “missing heat” that Landscheidt was looking for and which buffers Earth’s temperatures through solar cycle minima.
Such a mechanism could also explain why glaciation onsets are associated with magnetic field excursions and inversions are associated with a collapsing geomagnetic field as this additional energy source is cut off completely. Obviously it also explains cooling during times of low solar activity. Not only that the oceans skin depth is just what is needed.
Has anyone measured this? Anyone have a boat and some ocean nearby? It should be straightforward. We need to log the (AC) current between the surface and a depth of many tens of meters and correlate that with solar magnetic field index components.
Here is a challenge for a real scientist. If the currents are there and sufficiently large then:
1) The AGW hypothesis is destroyed completely.
2) We are in serious trouble as the geomagnetic field is falling as is the Sun’s magnetic field i.e. a major glaciation is almost upon us.
Please feel free to do something about this.
Gail Combs says:
December 21, 2012 at 11:45 am
I find it very interesting that L.S. and other scientists are now ‘reworking’ the historic sunspot numbers…..
When errors are found, they should be corrected. This has happened to the ‘historical sunspot record’ several times already over the past 150 years, so we are just following in the footsteps of that proud tradition.
SVALGAARD
December 21, 2012 at 10:34 am
‘The last column gives what we now believe is the correct sunspot number’
Thanks Lief!
Can you explain who the ” we”are. My analysis is based on official SIDC figures , so they do not seem to recognize your “we” yet . Are we getting into the same situation as we are with global temperature data sets were there are so many data sets and they are altered frequently when people do not like the current data sets as they disprove their preferred view[ like hadcrut 3 ,hadcrut4, GISS, BEST , etc] Who are you going to believe anymore?. In any case your new figures do not significantly alter my previous observations . Namely low dacadal average sunspot numbers and cooler global surface temperatures seem to happen together too often to be ignored.or minimized.It was happening in the past and is happening as we blog.Just look at what is happening in Russia already and the winter just started.today
As usually, Leif is trying to mislead the readers of this blog about solar activity.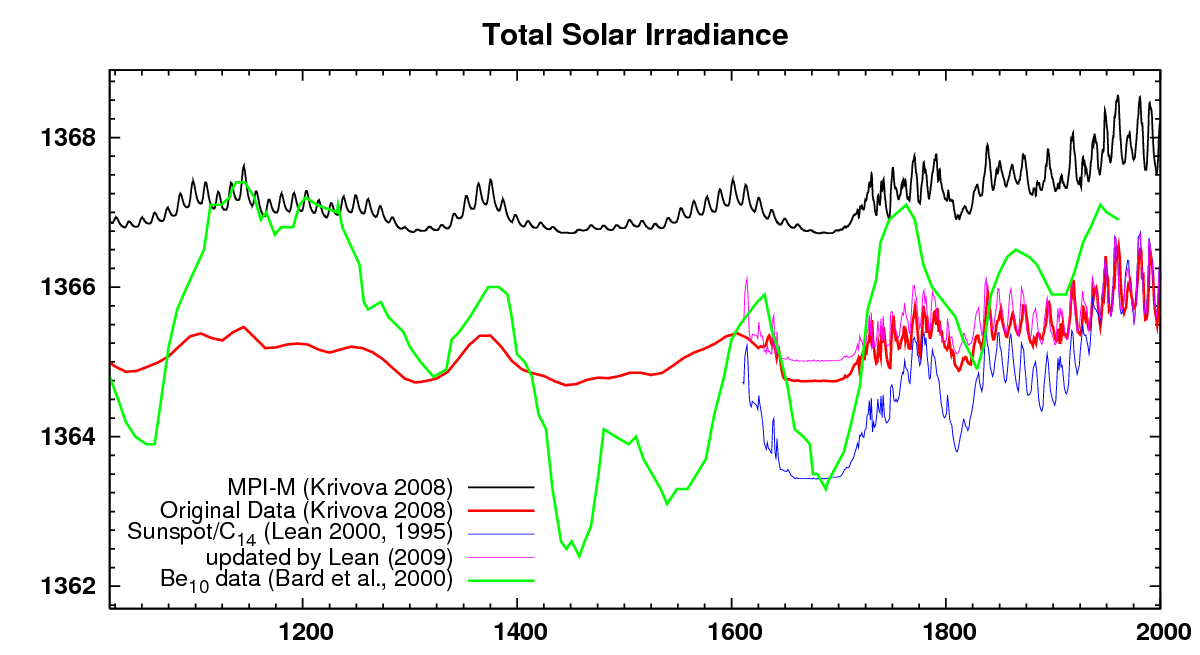 ?w=500
The truth is that the past dynamical behavior of solar activity is not known with precision.
Leif’s position is extreme in the sense that he claims that TSI did not vary at all during the last 300 year and more. Leif’s position is considered unlikely even by the IPCC and by the GCM modelers that prefer to adopt Lean’s TSI models that show a solar activity trending and warming during the last 300 yr and during the last century.
A comparison among some proposed TSI reconstruction is here
http://s5.tinypic.com/mmuclk.jpg
Leif’s model is in red, and it is nothing but a linear re-scaled sunspot number record into TSI units: essentially is a toy model.
Other proposed reconstructions of TSI are here
and there is this recent model by Shapiro
http://www.skepticalscience.com/pics/ShapiroTSI1600.png
and none of the above TSI reconstructions even closely resemble Leif’s “flat sun hypothesis” which is extreme in its flatness.
About the behavior of TSI during the last decades, Leif knowns but hides the fact that there exists a controversy about the TSI groups: ACRIM and PMOD, with ACRIM showing an upward trend from 1980 to 2000, and downward trend after. See here
http://acrim.com/TSI%20Monitoring.htm
About cosmic ray count they decreases (=solar activity increased) from 1970 to 1995, see here
http://www.climate4you.com/images/CosmicRaysAndSunspotsMonthlySince195801.gif
Finally there are other evidences discussed in my papers, solar model based on harmonic reconstruction hindcast centuries of solar and climate records. See here a summary
http://tallbloke.wordpress.com/2012/03/21/nicola-scafetta-major-new-paper-on-solar-planetary-theory/
In conclusion, Leif is not trying to inform the readers of this blog. He is simply trying to sell his unlikely “flat sun hypothesis”, which is considered “extreme” in the scientific solar community.
Now Leif is claiming that because our paleo proxies for solar activity come from GCR, the only mechanism of solar amplification that these proxies can implicate is GCR-cloud. His cite of the chapter 7 sentence, with his commentary added:
You are SHAMELESS Leif, and of course, utterly wrong. Any mechanism of enhanced solar forcing will yield correlations between the cosmogenic isotope record and global temperature, so long as the mechanism of forcing is stronger when the solar wind is up. That’s why the sentence says “an amplifying mechanism” and “such as GCR-cloud.”
GCR is a proxy, for instance, for the UV shift that accompanies variation in solar magnetic activity. This UV shift drives stratospheric ozone creation when solar activity is high, possibly altering atmospheric circulation patterns. That’s Stephen Wilde’s theory: that the Rossby waves that the jet stream follows lose amplitude when solar activity is high, and since the jet stream drives cloud formation, total cloudiness shrinks because the jet stream is not waving around so much. Could be.
Put it this way, if the chapter 7 authors actually mean what Leif is saying, if they actually think that GCR-correlations with climate indices can only implicate a GCR driven mechanism of solar amplification, then every last one of them should have his PhD revoked.
herkimer says:
December 21, 2012 at 12:17 pm
Can you explain who the ” we”are.
‘We’ are National Solar Observatory (NSO), the Royal Observatory of Belgium (ROB), and the Air Force Research Laboratory (AFRL), see http://ssnworkshop.wikia.com/wiki/Home for more info.
Nicola Scafetta says:
December 21, 2012 at 12:20 pm
In conclusion, Leif is not trying to inform the readers of this blog. He is simply trying to sell his unlikely “flat sun hypothesis”, which is considered “extreme” in the scientific solar community.
Not at all extreme; here is a similar ‘flat sun’ paper: http://www.leif.org/EOS/2011GL046658.pdf by some of the most respected authors of the ‘scientific solar community’
Their conclusion: “drivers other than TSI dominate Earth’s long-term climate change”
And from the respected people at the San Fernando Observatory:
http://www.leif.org/EOS/2005GL022839.pdf
Their conculsion: “We find that the level of S at solar minimum has no long-term secular trend that is correlated with the level of sunspot activity”
Leif says
Here is how the MWP ended compared to the ‘solar activity record’. although labelled TSI, it is really derived from the cosmic ray record:
http://www.leif.org/research/Does%20The%20Sun%20Vary%20Enough.pdf
It does not answer my question , Leif.
Slide 20 shows TSI in the MWP at the same level as now, and much higher than the LIA.
However, you conclude
Variation in Solar Output is a Factor of Ten too Small to Account for The Little Ice Age
So which is right?
If Solar Output is not enough, then what did cause the transition from MWP to LIA?
And if it was enough, why has not it caused 20thC warming?
Alec Rawls says:
December 21, 2012 at 12:27 pm
Now Leif is claiming that because our paleo proxies for solar activity come from GCR, the only mechanism of solar amplification that these proxies can implicate is GCR-cloud.
I’m claiming that that is the only thing the report talks about and has in mind, as evidenced by an author of the report.
Paul Homewood says:
December 21, 2012 at 12:38 pm
It does not answer my question , Leif.
The Figure shows that the MWP was ending long before solar activity began to drop and the MWP was unaffected by the grand solar minimum around 650AD, so the partial answer is that the MWP and the LIA have nothing to do with solar activity, but are driven by the stochatic variations any complex system [like the climate] has.
Variation in Solar Output is a Factor of Ten too Small to Account for The Little Ice Age
Given a variation in solar output of 0.1%, the resulting temperature change is a quarter of that, i.e. 0.025% which of 288K is 0.07 degrees, which is a factor of ten smaller than the actual LIA change in temperature.
“There has been no rise in solar activity the last 300 years.”
Leif missing the point again?
Six high cycles in a row means more energy received than three high cycles.
http://virakkraft.com/Leifs-TSI-running-sum.png
They may be interviewing people who claim to be scientists. That is a meaningless claim since they are not talking like scientists and not like geoscientists at all. It should be given all the credit is deserves.