Guest post by Tom Fuller
The physics behind the theory of global warming are solid. CO2 is a greenhouse gas, we’re emitting industrial levels of it, with China now in the lead for emissions. A significant portion remains in the atmosphere for a fairly long time, though the residence time is widely disputed. This residence of CO2 retards the cooling of the Earth and temperatures warm as a result.
One of the few non-controversial datasets in climate change is the Keeling curve, the graph of the concentrations of CO2 in the atmosphere reproduced here:

We see concentrations rising steadily from 315 parts per million in 1960 to 395 ppm last year. It’s close to 400 ppm now.
Human emissions of CO2 caused by burning of fossil fuels and production of cement have risen similarly:

Emissions have climbed at an even higher rate than concentrations.
And the third data source to look at (for simplicity’s sake–we could actually look at dozens of data sources) is temperature changes. This chart shows the global average temperature change from a ‘normal’ 30-year range from 1950-1980. It comes from the Goddard Institute for Space Studies, led by scientist James Hansen.
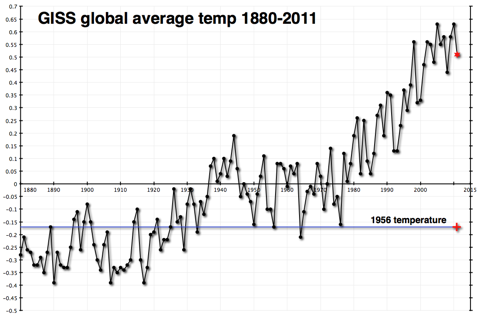
This shows a fairly constant rise in temperatures since 1978.
Once again, you don’t have to be a climate scientist to think that there seems to be a connection. The physical theory published first by Svante Arrhenius over 100 years ago and elaborated on by a century’s worth of scientists has observational evidence that tends to confirm it. I certainly believe in it.
In fact, I believe that global temperatures will probably rise by about 2 degrees Celsius over the course of this century. The difference in estimated temperature rises from different sources almost always comes from the differences in estimated atmospheric sensitivity to concentrations of CO2 in the atmosphere. Having extra CO2 in the atmosphere warms the atmosphere, which is presumed to produce more water vapor, which is also a greenhouse gas and would contribute more warming than the CO2 by itself. How much extra warming would ensue is pretty much the heart and soul of the debate over global warming.
Those who think that there isn’t much of an additional effect (that sensitivity of the atmosphere is low) have been chuckling very publicly because temperatures haven’t risen very much (if at all) since the big El Nino year of 1998. This is not hugely surprising, as the shape of the data is uneven, a sawtooth with ups and downs that can last a decade or longer. But it is happening at an inconvenient time politically for those who are worried that sensitivity is high. They are trying to get the world to prepare for warming of 4.5C or higher, without much success.
Here’s what temperatures look like more recently.

By itself, this chart doesn’t explain very much. As I said, it is not uncommon or unexpected for the temperature record to have flat or declining periods that last a decade or more.
However, I have a problem. The Carbon Dioxide Information Analysis Center (CDIAC) has estimates of how much CO2 humans have emitted since 1750. (Confusingly, they convert the CO2 to tons of carbon with a fixed formula.) That chart is the first one way up there at the top of the post. It rises dramatically
But looking at the data global.1751_2009 (3), one thing jumps out at me. CDIAC writes “Since 1751 approximately 356 billion metric tonnes of carbon have been released to the atmosphere from the consumption of fossil fuels and cement production.” And they helpfully provide an Excel spreadsheet showing their estimates by year.
And almost one-third of that number, 110 billion metric tonnes, have occurred since that time in 1998 when temperatures reached their temporary plateau.
| 1998 | 6644 |
| 1999 | 6611 |
| 2000 | 6766 |
| 2001 | 6929 |
| 2002 | 6998 |
| 2003 | 7421 |
| 2004 | 7812 |
| 2005 | 8106 |
| 2006 | 8372 |
| 2007 | 8572 |
| 2008 | 8769 |
| 2009 | 8738 |
Above: Table1, CO2 emissions by years, million metric tonnes – data CDIAC
Because heat moves somewhat sluggishly through the earth’s oceans, and because there is a lag factor in other earth systems, we do not expect a hair-trigger reaction to increases in CO2 emissions and concentrations.
But one-third of all human emissions of CO2 have occurred since 1998. And temperatures haven’t budged as a result.
This does not ‘disprove’ global warming–at all. I still believe that temperatures will climb this century, mostly as a result of the brute force effect of the 3,000 quads of energy we will burn every year starting in 2075–the reason I started this weblog.
However it makes it exceedingly difficult to use the past 15 years as evidence of a very high sensitivity of the atmosphere to CO2 concentrations. And it makes me feel more comfortable about my ‘lukewarm’ estimate of 2C temperature rises as opposed to the more alarming 4.5C rises put forward by some of those who are most active in the movement to reduce emissions drastically.
And it makes me wonder about why people don’t include relevant data when they discuss these issues. Is it really that politically incorrect to show real data, even if that data doesn’t advance your case?
Tom Fuller blogs at: 3000Quads and is co-author with Steve Mosher of the CRUTape Letters.
Spector says
so the net effect is to *heat* the atmosphere
henry says
rubbish. most of it is back radiated due to re-radiation as soon as the sun starts shining…
The O2 and N2 is completely transparent at the wavelengths where CO2 absorbs…..they cannot be heated by that re-radiation.
Did you ever look at the spectrum of CO2? You can see the absorptions between 1-2 um in that report of the radiation specific to the CO2 being bounced back from the moon. CO2 also emits in the UV due to re-radiation which is why we can identify it on other planets. We have also big absorption between 4 and 5 um where water vapor also absorbs.
If you ask me, you still do not understand how the GH effect works. But I am glad you understand the books./
My main point here has been to say (see above) that MODTRAN (‘good enough for government work’) calculations seem to show that CO2 is not the Big Bad Bear that most people now fear.
As the solar band is 20,000 or more cycles/cm (wave-number) wide, the CO2 spectrum only impacts minute fractions of this energy and that is probably logarithmically related to CO2 content, in just the same way that outgoing absorption is logarithmically limited.
CO2 can only cool the Earth by emitting photons derived from heat energy absorbed from the surrounding atmosphere to outer space. I believe terrestrial temperatures make 15-micron photons the primary means of cooling by CO2, as there is not enough thermal energy to easily excite the higher modes. Only in the mesosphere (and perhaps the upper stratosphere) is the remaining CO2 thin enough to let its own emitted photons escape to outer space.
CO2 scattering of incoming radiation is a problematic calculation as it involves knowing whether the absorbed energy will be re-emitted before it is diluted by being shared with other molecules in the atmosphere. One needs to know the radiation decay, half-life of each excited state, (Einstein constant) the molecular collision rate and the probability that each collision will be elastic for that state of excitation. Then there is also the probability of escape to outer space for each emitted photon to consider.
Relative to the surface, the greenhouse effect is primarily due to the 333 W/m2 back-radiation that allows only 63 W/m2 of 396 W/m2 attempted emission to escape as indicated on the Trenberth diagram. That is only one factor influencing the global thermal energy budget.
I believe the fact that there has been no appreciable warming since 1998, even though nearly one third of CO2 emissions occurred since then clearly shows that there are other things involved beside CO2. This also indicates that the rapid rise in temperatures between 1965 and 1995 is probably not valid as a calibration for the effect of CO2 on the climate.
Spector says
CO2 can only cool the Earth by emitting photons derived from heat energy absorbed from the surrounding atmosphere to outer space. I believe terrestrial temperatures make 15-micron photons the primary means of cooling by CO2,
henry says
no!
CO2 cools by back radiation (to space) of sunlight (various absorptions 0-5 um).
CO2 warms by back radiation (to earth) of earth shine (14-16 um, where H2O also absorbs)
If you don’t get this you will not understand why London was cooling when the rest of the world was warming and why we are cooling now.
To put this matter to rest I will copy my whole blog post here.. Perhaps it (the teaching) can also benefit other people following this discussion.
The greenhouse effect and the principle of re-radiation
Quote from Wikipedia (on the interpretation of the greenhouse effect);
“The Earth’s surface and the clouds absorb visible and invisible radiation from the sun and re-emit much of the energy as infrared back to the atmosphere. Certain substances in the atmosphere, chiefly cloud droplets and water vapor, but also carbon dioxide, methane, nitrous oxide, sulfur hexafluoride, and chlorofluorocarbons, absorb this infrared, and re-radiate it in all directions including back to Earth.”
I am watching with some amusement a lot of scholar discussions on the green house effect as I realised again that the people that I encounter on most scientific blogs don’t understand the chemistry principle of absorption and subsequent re-radiation. In fact very few people do understand it because if they did they would have raised the alarm bells ringing long time ago. But they all got stuck at Tyndall and Svante Arrhenius. … They know that CO2 (carbon dioxide) “absorbs” in the 14-16 um region. Most people think that what it means is that the molecules absorbs photons here which then subsequently get transferred as heat to neighbouring molecules. Then it absorbs again, and so on, and so on…and all the absorbed light is continuously transferred to heat…Although this may happen up to a certain saturation point as soon as the light or radiation hits on the gas, that is in fact not what is causing the heat entrapment.
I happen to be familiar with spectrophotometry. You have to understand what actually happens when we put a beam of light of certain wavelength on a sample of liquid or gas. We have various spectrophotometers that can measure the various ranges of UV-visible -IR etc. Usually you have the option to vary the wavelength of the beam of light, either manually or automatically. If the gas or liquid is completely transparent, we will measure 100% of the light that we put through the sample coming through on the other side. If there is “absorption” of light at that specific wavelength that we put through the sample, we only measure a certain % on the other side. The term “extinction” was originally used but later “absorption” was used to describe this phenomenon, meaning the light that we put on was somehow “absorbed”. I think this was a rather unfortunate description as it has caused a lot of confusion since. Many people think that what it means is that the light of that wavelength is continually “absorbed” by the molecules in the sample and converted to heat. If that were true, you would not be able to stop the meter at a certain wavelength without over-heating the sample, and eventually it should explode, if the sample is contained in a sealed container. Of the many measurements that I performed, this has never ever happened. Note that in the case of CO2, when measuring concentrations, we leave the wavelength always at 4.26 um. Because the “absorption” is so strong here, we can use it to compare and evaluate concentrations of CO2.
The best way to experience re-radiation for yourself is to stand in a dark forest just before dawn on a cloudless night. Humidity must be high. Note that water vapour also absorbs in the visible region of the spectrum. So as the first light of sun hits on the water vapour you can see the light coming from every direction. Left, right, bottom up, top down. You can see this for yourself until of course the sun’s light becomes too bright in the darkness for you to observe the re-radiated light from the water vapour. This is also the reason why you will quickly grab for your sun glasses when humidity is high, because even with the sun shining for you from your back and driving in your car, you can feel on your eyes that the light from the sun is re-radiated by the water vapor in the atmosphere.A third way to experience how re-radiation works is to measure the humidity in the air and the temperature on a certain exposed plate, again on a cloudless day, at a certain time of day for a certain amount of time. Note that as the humidity goes up, and all else is being kept equal, the temperature effected by the sun on the plate is lower. This is because, like carbon dioxide, water vapour has absorption in the infra red part of the spectrum.
We can conclude from all these experiments that what actually happens is this:
in the wavelength areas where absorption takes place, the molecule starts acting like a little mirror, the strength of which depends on the amount of absorption taking place inside the molecule. We may assume that at least 50% of a certain amount of radiation is sent back in a radius of 180 degrees in the direction where it came from. (However, because the molecule is very small and therefore might behave more or less like a sphere, it could be up to ca. 62,5% ). This re-radiation in the sun’s spectrum and in the earth’s spectrum is the cooling effect, or warming effect, respectively, of a gas hit by radiation. An effect that is very similar to this, is also observed when car lights are put on bright in humid, moist and misty conditions: your light is returned to you!!
Unfortunately, in their time, Tyndall and Arrhenius could not see the whole picture of the spectrum of a gas which is why they got stuck on seeing only the warming properties of a gas (i.e. the closed box experiments). If people would understand this principle, they would not singularly identify green house gases (GHG’s) by pointing at the areas in the 5-20 um region (where earth emits pre-dominantly) but they would also look in the area 0-5 um (where the sun emits pre-dominantly) for possible cooling effects. If you really want to understand what happens in the atmosphere, this rough graph / representation (on a cloudless day) is very important:
http://albums.24.com/DisplayImage.aspx?id=cb274da9-f8a1-44cf-bb0e-4ae906f3fd9d&t=o
See how the absorptions that are apparent in the spectra of the individual components of the atmosphere affect the outgoing radiation of earth and see how they affect the incoming radiation. For example, let us look at the absorption of ozone at between 9-10 um? It makes a dent in earth’s outgoing radiation at 9-10. In other words what happens: Radiation from earth of 9-10 goes up, hits on the ozone, most of which is high up in the sky and which is already absorbed to capacity, and therefore a great percentage (at least 50%, probably more) is sent back to earth, leading to entrapment of heat, leading to delay in cooling, leading to a warming effect. Also look at water vapor and CO2 around 2 um and see how that makes a dent in the incoming solar radiation. Notice that the ozone shields us from a lot of sunlight by absorbing and re-radiating in the UV region. In fact, if you really grasp what you are seeing in this graph/ representation (from a cloudless day), you would realize that without the ozone and CO2 and H2O and other GHG’s you will get a lot more radiation on your head. In fact, you would probably fry.
For comprehensive proof that CO2 is (also) cooling the atmosphere by re-radiating sunshine, see here:
http://www.iop.org/EJ/article/0004-637X/644/1/551/64090.web.pdf?request-id=76e1a830-4451-4c80-aa58-4728c1d646ec
They measured this re-radiation from CO2 as it bounced back to earth from the moon. So the direction was sun-earth (day)-moon(unlit by sun) -earth (night). Follow the green line in fig. 6, bottom. Note that it already starts at 1.2 um, then one peak at 1.4 um, then various peaks at 1.6 um and 3 big peaks at 2 um. You can see that it all comes back to us via the moon in fig. 6 top & fig. 7. Note that even methane cools the atmosphere by re-radiating in the 2.2 to 2.4 um range.
This paper here shows that there is absorption of CO2 at between 0.21 and 0.19 um (close to 202 nm):
http://www.nat.vu.nl/en/sec/atom/Publications/pdf/DUV-CO2.pdf
There are other papers that I can look for again that will show that there are also absorptions of CO2 at between 0.18 and 0.135 um and between 0.125 and 0.12 um.
We already know from the normal IR spectra that CO2 has big absorption between 4 and 5 um.
So, to sum it up, we know that CO2 has absorption in the 14-16 um range causing some warming (by re-radiating earthshine) but as shown and proved above it also has a number of absorptions in the 0-5 um range causing cooling (by re-radiating sunshine). This cooling happens at all levels where the sunshine hits on the carbon dioxide same as the earthshine. The way from the bottom to the top is the same as from top to the bottom. So, my question is: how much cooling and how much warming is caused by the CO2? How was the experiment done to determine this and where are the test results? (I am afraid that simple heat retention testing might not work here, we have to use real sunshine and real earthshine to determine the effect in W/m3 / [0.03%- 0.06%]CO2/m2/24hours).
I am doubtful of the analysis of the spectral data. I have not seen any work that convinces me. In the case of CO2, I think the actual heat caused by the sun’s IR at 4-5 could be underestimated, i.e. the radiation of the sun between 4 and 5 may be only 1% of its total energy output, but how many Watts per m2 does it cause on earth? Here in Africa you cannot stand in the sun for longer than 10 minutes, just because of the heat (infra-red) of the sun on your skin.
In all of this we are still looking at pure gases. The discussion on clouds and the deflection of incoming radiation by clouds is still a completely different subject.
CO2 also causes cooling by taking part in the life cycle. Plants and trees need warmth and CO2 to grow – which is why you don’t see trees at high latitudes and – altitudes. It appears no one has any figures on how much this cooling effect might be. There is clear evidence that there has been a big increase in greenery on earth in the past 4 decades.
From all of this, you should have figured out by now that any study implying that the net effect of more CO2 in the atmosphere is that of warming, must exhibit a balance sheet in the right dimensions showing us exactly how much radiative warming and how much radiative cooling is caused by an increase of 0.01% of CO2 that occurred in the past 50 years in the atmosphere. It must also tell us the amount of cooling caused by the increase in photosynthesis that has occurred during the past 50 years.
There are no such results in any study, let alone in the right dimensions. FOR EXAMPLE, consider the fact that time must be in the dimensions.
For more on why it is considered highly unlikely that CO2 is a contributory cause to global warming, see here:
http://blogs.24.com/henryp/2012/04/23/global-cooling-is-here/
http://blogs.24.com/henryp/2012/10/02/best-sine-wave-fit-for-the-drop-in-global-maximum-temperatures/
The above results show that a cooling cycle started around 1995.