Guest post by Tom Fuller
The physics behind the theory of global warming are solid. CO2 is a greenhouse gas, we’re emitting industrial levels of it, with China now in the lead for emissions. A significant portion remains in the atmosphere for a fairly long time, though the residence time is widely disputed. This residence of CO2 retards the cooling of the Earth and temperatures warm as a result.
One of the few non-controversial datasets in climate change is the Keeling curve, the graph of the concentrations of CO2 in the atmosphere reproduced here:

We see concentrations rising steadily from 315 parts per million in 1960 to 395 ppm last year. It’s close to 400 ppm now.
Human emissions of CO2 caused by burning of fossil fuels and production of cement have risen similarly:

Emissions have climbed at an even higher rate than concentrations.
And the third data source to look at (for simplicity’s sake–we could actually look at dozens of data sources) is temperature changes. This chart shows the global average temperature change from a ‘normal’ 30-year range from 1950-1980. It comes from the Goddard Institute for Space Studies, led by scientist James Hansen.
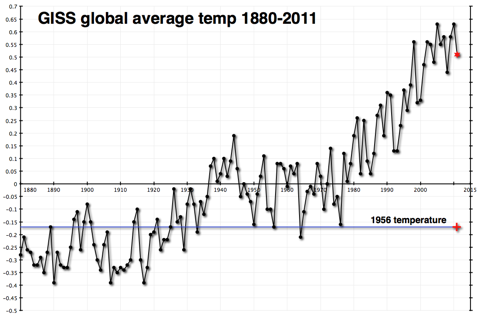
This shows a fairly constant rise in temperatures since 1978.
Once again, you don’t have to be a climate scientist to think that there seems to be a connection. The physical theory published first by Svante Arrhenius over 100 years ago and elaborated on by a century’s worth of scientists has observational evidence that tends to confirm it. I certainly believe in it.
In fact, I believe that global temperatures will probably rise by about 2 degrees Celsius over the course of this century. The difference in estimated temperature rises from different sources almost always comes from the differences in estimated atmospheric sensitivity to concentrations of CO2 in the atmosphere. Having extra CO2 in the atmosphere warms the atmosphere, which is presumed to produce more water vapor, which is also a greenhouse gas and would contribute more warming than the CO2 by itself. How much extra warming would ensue is pretty much the heart and soul of the debate over global warming.
Those who think that there isn’t much of an additional effect (that sensitivity of the atmosphere is low) have been chuckling very publicly because temperatures haven’t risen very much (if at all) since the big El Nino year of 1998. This is not hugely surprising, as the shape of the data is uneven, a sawtooth with ups and downs that can last a decade or longer. But it is happening at an inconvenient time politically for those who are worried that sensitivity is high. They are trying to get the world to prepare for warming of 4.5C or higher, without much success.
Here’s what temperatures look like more recently.

By itself, this chart doesn’t explain very much. As I said, it is not uncommon or unexpected for the temperature record to have flat or declining periods that last a decade or more.
However, I have a problem. The Carbon Dioxide Information Analysis Center (CDIAC) has estimates of how much CO2 humans have emitted since 1750. (Confusingly, they convert the CO2 to tons of carbon with a fixed formula.) That chart is the first one way up there at the top of the post. It rises dramatically
But looking at the data global.1751_2009 (3), one thing jumps out at me. CDIAC writes “Since 1751 approximately 356 billion metric tonnes of carbon have been released to the atmosphere from the consumption of fossil fuels and cement production.” And they helpfully provide an Excel spreadsheet showing their estimates by year.
And almost one-third of that number, 110 billion metric tonnes, have occurred since that time in 1998 when temperatures reached their temporary plateau.
| 1998 | 6644 |
| 1999 | 6611 |
| 2000 | 6766 |
| 2001 | 6929 |
| 2002 | 6998 |
| 2003 | 7421 |
| 2004 | 7812 |
| 2005 | 8106 |
| 2006 | 8372 |
| 2007 | 8572 |
| 2008 | 8769 |
| 2009 | 8738 |
Above: Table1, CO2 emissions by years, million metric tonnes – data CDIAC
Because heat moves somewhat sluggishly through the earth’s oceans, and because there is a lag factor in other earth systems, we do not expect a hair-trigger reaction to increases in CO2 emissions and concentrations.
But one-third of all human emissions of CO2 have occurred since 1998. And temperatures haven’t budged as a result.
This does not ‘disprove’ global warming–at all. I still believe that temperatures will climb this century, mostly as a result of the brute force effect of the 3,000 quads of energy we will burn every year starting in 2075–the reason I started this weblog.
However it makes it exceedingly difficult to use the past 15 years as evidence of a very high sensitivity of the atmosphere to CO2 concentrations. And it makes me feel more comfortable about my ‘lukewarm’ estimate of 2C temperature rises as opposed to the more alarming 4.5C rises put forward by some of those who are most active in the movement to reduce emissions drastically.
And it makes me wonder about why people don’t include relevant data when they discuss these issues. Is it really that politically incorrect to show real data, even if that data doesn’t advance your case?
Tom Fuller blogs at: 3000Quads and is co-author with Steve Mosher of the CRUTape Letters.
Claiming that the global temperature will increase by the end of the century is obvious nonsense for a very simple reason: nobody knows.
As far as I’m aware the ice cores do not provide any evidence that CO2 can drive temperatures, but it shows clearly that temperatures drive CO2. Greenhouse warming may work in the laboratory but the ice cores show that, for whatever reason, it doesn’t work in the climate system.
So: nobody knows. But I have a horrible feeling that this century may be dominated by global cooling. Now that really is something to worry about….
Chris
markx:
“.. am I correct in assuming coal beds (brown coal at least?) can still considered to be sedimentary organic products?
That’s a good question: I think it might be an assumption worth more research and consideration, rather than an established fact. If some of the organic compounds on the surface and in the atmosphere of Titan would be considered “signs of life if they were on our planet,” how can we be sure that an organic compound here is a sign of life?
Maybe some of our popular ideas about cosmology, biology, geochemistry, evolution, the origin of life, the scope of the biosphere and its relationship to climate, are compromised by an impossible story of petroleum origin that comes from one of the alchemists featured in Extraordinary Popular Delusions. That would be horrible, if true!
Hi Khwarizmi:
Whether oil is truly a fossil fuel (like coal, where the actual literal fossils of leaves can sometimes be found in the shales immediately above and below the seam) or not, the best guess we have is the dinosaurs — large fierce predators and their natural prey — lived in an epoch of much higher atmospheric CO2 concentration. Higher CO2, –> higher photosynthetic efficiencies, –> more life.
Human history has developed in an epoch of relatively scarce carbon dioxide. The past century has seen Gaea restore herself via the services of her minions, Mankind, to the levels she enjoyed in her youth.
That many ignorant and anti-scientific minds argue that the recovery of deep carbon and restoration of that carbon into the biosphere we and all Gaea’s creatures share is some kind of a PROBLEM just boggles my mind. Have these people no education whatever? Or is it merely a matter of perspective?
HenryP says:
December 7, 2012 at 10:23 am
i.e.
the truth is that the physics is not solid and we do not know if the net effect of more CO2 in the atmosphere is that of warming.
============
Correct. The atmospheric lapse rate shows that energy is being lost to space from the atmosphere. This energy loss MUST be due to radiation by GHG to space. It cannot be due to conduction because there is no conduction to space.
You cannot reduce this radiation loss to space by increasing the very same GHG that is causing the energy loss. The only way to reduce radiation loss to space (and thus warm the planet) is to reduce GHG. Increasing the amount of GHG in the atmosphere is like adding a bigger radiator to your car and arguing that since there is more heat coming out of the engine the engine will run hotter.
sunsettommy says:
December 7, 2012 at 6:32 am
Here is a nice chart that are composed of many peer reviewed science papers from the 1950′s to the 1990′s that show it is less than 25 years (The high end) and always less than 15 years in the rest of the chart:
http://globalwarmingskeptics.info/thread-188-post-3118.html#pid3118
Hi Tommy,
Only one problem with that graph: the IPCC (too) long decay time has nothing to do with the residence time of CO2 in the atmosphere of all the other estimates. The residence time is how long it takes in average for a CO2 molecule (whatever its origin) in the atmosphere before it is exchanged with a CO2 molecule of another reservoir. That is the turnover time, which is about 150 GtC / 800 GtC each year (mainly during the seasonal exchanges) or about 20% per year. Thus a residence time of ~5 years.
The time needed to remove some excess CO2 out of the atmosphere above the (temperature dictated) dynamic equilibrium is of a different order: Some 4 GtC as CO2 (whatever its origin) is removed from the atmosphere each year, while we are about 210 GtC (100 ppmv) above equilibrium. That gives an e-fold time of 210 / 4 = 52.5 years or a half life time of roughly 40 years to remove any extra CO2. Way longer than the 5 years residence time, but much shorter than the IPCC, which calculates that at some point saturation of the deep ocean and terrestrial uptakes takes place, where no such saturation is in sight…
highflight56433 says:
December 7, 2012 at 1:37 pm
Maybe there should be some “consensus” that the warming since LIA has released CO2, thus the rise in CO2 is an artifact of the warming oceans plus industrialization.
Simple measurements show that an increase of 1°C of seawater increases the partial pressure of CO2 in the water phase with about 16 microatm. Thus to bring the air-water transfer of CO2 back into dynamic equilibrium, an increase of ~16 ppmv in the atmosphere is sufficient.
That means that the increase in temperature since the Little Ice Age of maximum 1°C should have given an increase of maximum 16 ppmv in the atmosphere, while the measured increase is about 100 ppmv, of which 70 ppmv since we have accurate measurements at Mauna Loa. Further, vegetation reacts in opposite way: higher temperatures means more land available for vegetation, thus more CO2 sequestering and growth (with sufficient moisture). The average result over multi-decades (MWP-LIA) to multi-millennia (glacials – interglacials) is about 8 ppmv/°C.
Thus temperature related: maximum 8 ppmv. Human induced: 92 ppmv.
IanG says:
December 7, 2012 at 5:15 pm
We know that CO2 rises after around 800 years following a warm period. So what was happening in 1150? The medieval warm period? So how much of today’s CO2 level is due to that period?
Not much:
CO2 levels changed ~6 ppmv in the medium resolution (~20 years averaging) ice core of Law Dome for a change of ~0.8°C, with a lag of ~50 years after the sharp drop in temperature:
http://www.ferdinand-engelbeen.be/klimaat/klim_img/law_dome_1000yr.jpg
Thus we may expect the same CO2 levels as in the MWP, which were 280-285 ppmv. But we are already over 100 ppmv above that level…
If I am ever up in some high remote area, near the upper inhabitable edge of our atmosphere on a mountain,
and I’m stranded, with just three 5mm thick, wool blankets, to keep me warm, in a cabin, the furnace is broken on,
sleeping,
and there’s a fire,
If I run outside to find myself facing a problem: narrow ledge facing the stars in front of me and to my back, the raging inferno of the cabin-
When Emergency Services arrive, I’ll tell them that
“I stood there looking at those freezing stars in space,
but on the other side,
to my back,
I had that raging fire;
which was burning me. But I had three, 5mm thick, furniture mover’s pads I had brought with me to wrap some sensitive equipment up in.
So, I wrapped those around me, using them as insulating blankets:
and once I had those three wrapped around me, there was less radiation getting through,
so the surface of my skin and clothes, were warmer.
When the State Trooper says “You mean – cooler ?”
I’ll look at him like –
“You must not believe in Global Warming, you
silly arguing,
UNSCIENTIFIC
trash,
so I’ll EXPLAIN this, ONE MORE TIME! This is ALL AGREED by SCIENTISTS from NASA!
You’re SO unSCienTIFIC, I feel like I’m taking CRAZY PILLS having to EXPLAIN THIS to YOU!!”
” I CLEARLY SAID: “At FIRST I was standing on that freezing ledge, with the SURFACE of my BACK on FIRE,
and FREEZING on my FRONT.
I wrapped a 5mm thick, woolen emergency blanket around me,
which blocked 10% of the radiation from the fire:
leaving the surface of my body, WARMER.
My clothes didn’t go out completely, so I added ANOTHER 5mm blanket to the first one, blocking 20% of the radiation from the fire,
leaving the SURFACE of my BODY
WARMER!!!!
The fire was STILL causing me some DISCOMFORT
so I put yet a THIRD 5mm blanket around me,
which blocked a total of 30% of the incoming radiation,
making me YET WARMER.
WTF about THIS,
do YOU,
NOT UNDERSTAND,
OFFICER?!?!”
How do you Magic Gassers think that’s gonna shake out – is he going to:
(1) THANK me for clearing up to him that blocking fire from reaching an object in frigid space is WARMING it
(2) Whip my #$$, and take me in for observation at the mental hospital,
until I stop insisting that the blankets I used to block 30% of the heat from a fire which had my clothes smoldering,
“made me warmer and warmer, until my clothes stopped smoldering.”
You say.
henry@ferdberple
Good comment. thanks
henry@ferdinand meeus engelbeen
the relationship between increasing CO2 versus increasing temps (without the presence of man) has been well established.
At the top of my hat, how you work this out to not being about 16 ppms per degree K seems implausible in terms of the actual records for CO2 versus temps. (I will have to look at those graphs again, but we know that CO2 was as high as 7000 ppm at much earlier stages of earth)
Apart from the normal increase in CO2 due to temp. rise of the oceans we must also consider more CO2 release from below the seabed (due to normal volcanic activity ) as a result of a temp. increase of sea water. (atlantic/pacific rifs)
I am also a bit puzzled as to how you explain that earth is cooling whilst CO2 is rising?
http://wattsupwiththat.com/2012/12/06/a-problem-nearly-one-third-of-co2-emissions-occured-since-1998-and-it-hasnt-warmed/#comment-1167630
I would also question how you came to a probable result (of ca. 8 ppm) from the sequestration of CO2 due to the increase in vegetation noted over the past 4 or 5 decades? (report, results?)
Finally, are you still saying that the net effect of more CO2 in the atmosphere causes more warming, if so where is your balance sheet?
http://blogs.24.com/henryp/2011/08/11/the-greenhouse-effect-and-the-principle-of-re-radiation-11-Aug-2011/
btw I am in Holland soon. please make it a bit warmer there for me? thanks
This does not ‘disprove’ global warming–at all.
—
If that doesn’t do it, then you fail to mention what would. Falsifiability is a tenet of the scientific method. Yet you fail to provide it. In fact, you go against the facts and proclaim that some belief you hold must be true. At the very least, you should be open to the proposition that when faced with an unknown future, that multiple causes may be true. But you do no such thing. To you, AGW is the only possible outcome.
This brings me to where you state that the theory of global warming are sound. No, it is the theory of greenhouse gases in a closed system that is sound. When it comes to global warming, there are many greenhouses gases and other effects that are still uncertain as to their amount, effect and overall interaction between each other. You state that CO2 drives water vapour. That’s ridiculous. Larger effects always drive the smaller ones if they interact, never the other way around. It’s like saying that a moth can change the direction of traffic. It is ridiculous.
I’ve said it before. Climate scientists need to understand natural variations, especially the cooling parts, before announcing doomsday on something they do not comprehend. The current theory of global warming is not sound at all. It based on the lack of imagination and knowledge of climate scientists. I wish I could make that up, but it’s entirely true. They’re using the Sherlock Holmes theory that if they eliminate all other causes, then the only thing that remains (human effects) must be the cause, no matter how unlikely it may seem. This is all based on computer models and none of them can explain natural cooling periods. So forgive me if I don’t put too much faith in their models. I’m a programmer. Saying I’m an expert in computer models is like saying a mechanic is an expert in nuts and bolts. GIGO trumps all models.
Global warming theory cannot trump GIGO (garbage in, garbage out). GIGO is a law that is higher than all others.
I’m not saying CO2 doesn’t contribute to warming or that humans don’t produce any. I’m saying that the evidence is clearly lacking to support your ideas and all you’re going on is faith.
What happens if you factor in SO2 emissions and natural ocean cycles?
E.M.Smith says @Bair Polaire:
OK, it’s still a ‘work in progress’, but I said I’d get something back today:
http://chiefio.wordpress.com/2012/12/08/broken-reasoning-and-hot-air/
Broken Reasoning And Hot Air
Great post from the Chiefio, inspired from this discussion here!
He has pieced it all together – a parade of climate science misconceptions: oversimplified models that are so reduced that they become just wrong, the misuse of temperature as a proxy for heat, the mindless averaging away of non-linear properties and effects, the ongoing neglect of (climate) history and the persistent unwillingness to think a little further than just “back radiation”.
This line should be circled widely: “What’s broken is the idea that heat “builds up”, when in reality it “travels up”…”
Thanks, everybody!
MrX says:
December 8, 2012 at 12:39 pm
“They’re using the Sherlock Holmes theory that if they eliminate all other causes, then the only thing that remains (human effects) must be the cause, no matter how unlikely it may seem.”
Of course, this is a gross logical fallacy in general. One has to stipulate first that one has all possibilities covered. Only then can process of elimination produce a conclusive result.
A better Sherlock quote appropriate to the case at hand is:
The AGW crowd are working hard at twisting the data to suit theories, but the case is still falling apart for them.
HenryP says:
December 8, 2012 at 12:34 pm
the relationship between increasing CO2 versus increasing temps (without the presence of man) has been well established.
Yes, 4-5 /°C on short term (2-3 years) to 8 ppmv/°C over (very) long term:
http://www.ferdinand-engelbeen.be/klimaat/klim_img/Vostok_trends.gif
Geological history shows much higher CO2 levels, but most of that is buried in carbonate rocks, unavailable for release back into the atmosphere. The 8 ppmv/°C is rather fixed over the past 800 kyear, but doesn’t hold anymore for the past 150 years, when humans started to emit lots of CO2.
Thus the increase of maximum 1°C since the LIA did give a maximum of 8 ppmv extra in the atmosphere. The rest of the 100+ increase since the start of the industrial revolution is from human origin. See the ice cores record:
http://www.ferdinand-engelbeen.be/klimaat/klim_img/antarctic_cores_001kyr_large.jpg
Some extra CO2 from seabed volcanoes comes into the bulk of the deep oceans. If the rates are similar to the land volcanoes, then that hardly influences the deep ocean carbon content and certainly not on short term. Further, there is no measurable temperature rise of deep ocean seawater temperature and hardly any at the surface.
“I have a screen of gases , you can hang in the atmosphere and it blocks sunlight coming in or out.”
“Really?”
“Yep. First it blocks about half the infrared from the sun, from ever getting to earth, warming it.
Then it blocks whatever makes it to earth trying to get away from earth.”
“Wow. What do you call it when it does that?”
“Heating.”
“…Wow..”
“Yeah… and then some of the gas goes from a liquid/solid state to gas if it contacts heat and wafts up to the upper atmosphere, dumps the heat into space becoming a solid again, to fall back down and do this again and again and again.”
“Wow, that’s some gas class. What do you call it when your gas does that ‘evaporating/rising/condensing/dumping heat directly into space,
atmospheric air-pressures phase-change refrigerant thing it does?
“Heating.”
“Nice.”
Yeah… we have some gases that block the high energy blue light too. That mechanism of blocking blue light from ever heating the earth has it’s own name.”
“Oh?”
“Yeah.”
“What’s it called?”
“Heating.”
HenryP says:
December 8, 2012 at 12:34 pm
I forgot to add a comment on the effect of the increase in CO2 on temperature. Here my opinion:
“In my opinion even a doubling would have little impact, as clouds are a negative feedback (while all current GCM’s include clouds as a positive feedback!), thus a doubling of CO2 would have only moderate (and thus globally positive) effects.”
~ Ferdinand Englebeen, WUWT, 11-25-10
But be carefull: even if there is a (temporarely – PDO-related?) cooling now, that doesn’t imply that CO2 has no effect at all: a small impact can be masked by a more important natural variability…
You think the Earth is going to heat up the better part of 2C based on 3000 Quads of energy consumption pa? The sun exposes the Earth to 173 PW, or 1.73e17 W. 3000 Quads/yr is 3000*1e18/365/24/3600~=1e14 W ~= 0.nothing. So a one-one thousandth increase in the amount of energy entering the Earth system is worth a 2C rise?
Yeah, no.
The rest of the piece is interesting but doesn’t actually say very much. Without any statement of the time constants of the system the fact that CO2 has increased by a third in the last 15yrs doesn’t actually mean anything. It’s really a gut feel piece.
My understanding is there is no historical evidence that CO2 ever contributed to climate changes. yet we see that CO2 rose between icing events, after the warming. Thus, CO2 is an artifact of warming.
What did I tell you
says
Yeah… we have some gases that block the high energy blue light too. That mechanism of blocking blue light from ever heating the earth has it’s own name.”
“Oh?”
“Yeah.”
“What’s it called?”
“Heating.”
Henry says
ehh, I think that is wrong?
Actually the “blocking” is back radiation <1 um (high energy that heats the oceans) from ozone and others that absorb in the 0-1 um region, that is sent back in a radius of 180 degrees in the direction where the radiation came from. If there is more F-UV and/or E-UV coming in, due to whatever reason, you get more ozone and HxOx and NxOx being produced/manufactured up there, from its original components. As a result you get more cooling……
hence we are currently cooling whilst ozone and others are increasing.
http://wattsupwiththat.com/2012/12/06/a-problem-nearly-one-third-of-co2-emissions-occured-since-1998-and-it-hasnt-warmed/#comment-1167630
henry@ferdinand meeus
if I look at these graphs it seems more or lees like 10 ppm per degree C, on average.
http://joannenova.com.au/global-warming-2/ice-core-graph/
Nevertheless, it is less that I had expected. However, since I don’t know the method and calibration procedures I remain a bit skeptical. What were the temps. in the Cambrium when we had the CO2 in the thousands?
Either way. we are cooling, currently at the highest rate,
http://blogs.24.com/henryp/2012/10/02/best-sine-wave-fit-for-the-drop-in-global-maximum-temperatures/
so the idea that CO2 has something to do with climate will be put to rest soon.
Earth energy stores are a bit empty now, so I predict that from now average temps. will drop as high as maxima are falling. That would be about ca. -0.035 degree C per annum for the next 8 years or so. Cooling will only end in ca. 2036.
Bair Polaire says:
December 7, 2012 at 4:36 am
….Can you recommend links to what exactly happens at the surface of the sea (direct evaporation, not higher temperatures? maybe both?) and to how exactly the earth is cooling by conduction, convection, evaporation and eventually radiation. Anybody? It should be easy to understand, I want to show it to a friend at the UN. Thanks a lot…..
_____________________________________
For what it is worth I use these graphs:
This is the real killer since the effect of CO2 is multiplied threefold by triggering more H2O vapor per IPCC wisdom:
Global Relative Humidity graph
NOAA: Global Atmosperic Specific Humidity
The Sun – Ocean connection
Atmospheric Transmission of incoming solar radiation
Real graph of relative radiative Energy of the Sun vs Earth
Incoming solar graph
Incoming solar vs ocean depth
Multiple graphs, Sun & Cosmic rays
Temp change during solar eclipse
Movement of Köppen Climate boundaries in US Mid West
Britannica: Köppen climate classification
This is the little goody that has been wiped off the internet thanks to Judithgate.
Sun most active in 11,000 yrs
YOu need to also read Judithgate about how the IPCC ignored the real experts on solar insolation. Comparision of lean graph vs ACRIM composite graph and Official TSI composite graph and Actual satellite results graph.
Grand maxima of solar activity
Solar activity reaches new high
Solar irradiance 1611 to 2001 ″ is by Judith Lean – from WUWT
WUWT article on NASA’s Solar Radiation & Climate Experiment (SORCE) mission.
SORCE’s Solar Spectral Surprise – UV declined, TSI constant
NASA paper: Global increase in UV irradiance during the past 30 years (1979–2008) estimated from satellite data
In other words the IPCC (and Svalgaard) keep saying the sun is constant and therefore can be disregarded but NASA scientists keep coming up with how it actually varies so the IPCC sweeps it all under the rug. Note that the highly variable part of the sun, vis-uv wavelengths, are the same wavelengths that are absorbed by the oceans.
You then need to watch Bob Tissdale’s Vids
“The Natural Warming of the Global Oceans”
Part I
Part II
AndyG55 says:
December 6, 2012 at 10:07 pm
“This chart shows the global average temperature change from a ‘normal’ 30-year range from 1950-1980. It comes from the Goddard Institute for Space Studies, led by scientist James Hansen.”
It does NOT show anything of the sort…..
______________________________________
The definition of a ‘normal’ 30-year range from 1950-1980. Is telling too.
At this point I rather trust what plants are telling us not Hansen.
If you look at the Köppen climate classification vegetation-based empirical climate classification system you find this set of graphs for the American Midwest.
On the bottom graph, a close up reveals the cold outlier is 1970 and the next coldest times are 1910, 1960 and 1950/1940. Gee fancy that, Hansen picked the three consecutive decades that had the coldest temperatures as his ‘normal’ He could have easily have picked 1920,1930 and 1940 which are in the middle of the pack and are therefore more representative of modern ‘normal’ according to plants.
theBuckWheat says:
December 7, 2012 at 4:54 am
I am still waiting for some credible statement as to what the optimum temperature should be….
>>>>>>>>>>>>>>>>>>>>>>>>>>>>>>>
Easy answer: Warmer not colder.
1. Warmer means less storms
2. Warmer means wetter (in general more evaporation)
3. Warmer means increasing the growing season so the northern land masses are more productive.
Another Köppen,-Geiger map of the world. WIKI on classification scheme (more info )
4. Warmer means less political unrest. E.M.Smith (ChiefIO) goes into detail about that. link
And last but not least the warm phases in the climate are getting less warm – NOT GOOD
Greenland Ice Core and NH Summer Energy: The Leading Indicator and the length of the Arctic Melt season has started to DECREASE while fall snow cover in the NH Increases.
The only down side to warmer is melting of glaciers and sea level rise but that isn’t happening.
graph
India – Record snowfall revives 2,000 glaciers and all seven glaciers on California’s Mount Shasta are growing.
What is the equilibrium level of CO2?
It is about 270 ppm (or at least it has been over the last 24 million years since C4 grasses evolved [between 32 Mya and 24 Mya] which increased vegetative Carbon cycling and pulled half of the CO2 out of the atmosphere – in fact, there is two distinct down-steps at these two periods).
http://s13.postimage.org/pvmtijcw7/CO2_Last_40_Mys.png
Is CO2 correlated with Temperature?
Only in the ice ages (with CO2 lagging behind temperatures by 1,000 years at a rate of 14 ppm per 1.0C temperature change which is probably about half each related to vegetation Carbon cycling and half due to Ocean uptakes/discharge).
http://s12.postimage.org/gqh2y043x/Temp_vs_CO2_Last_40_Mys.png