Guest post by Tom Fuller
The physics behind the theory of global warming are solid. CO2 is a greenhouse gas, we’re emitting industrial levels of it, with China now in the lead for emissions. A significant portion remains in the atmosphere for a fairly long time, though the residence time is widely disputed. This residence of CO2 retards the cooling of the Earth and temperatures warm as a result.
One of the few non-controversial datasets in climate change is the Keeling curve, the graph of the concentrations of CO2 in the atmosphere reproduced here:

We see concentrations rising steadily from 315 parts per million in 1960 to 395 ppm last year. It’s close to 400 ppm now.
Human emissions of CO2 caused by burning of fossil fuels and production of cement have risen similarly:

Emissions have climbed at an even higher rate than concentrations.
And the third data source to look at (for simplicity’s sake–we could actually look at dozens of data sources) is temperature changes. This chart shows the global average temperature change from a ‘normal’ 30-year range from 1950-1980. It comes from the Goddard Institute for Space Studies, led by scientist James Hansen.
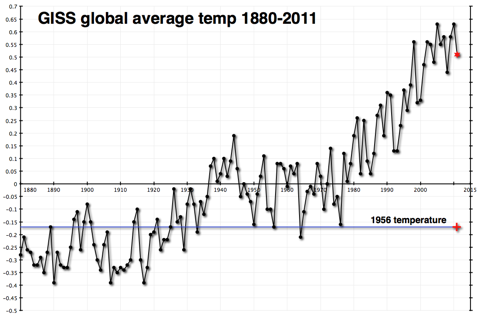
This shows a fairly constant rise in temperatures since 1978.
Once again, you don’t have to be a climate scientist to think that there seems to be a connection. The physical theory published first by Svante Arrhenius over 100 years ago and elaborated on by a century’s worth of scientists has observational evidence that tends to confirm it. I certainly believe in it.
In fact, I believe that global temperatures will probably rise by about 2 degrees Celsius over the course of this century. The difference in estimated temperature rises from different sources almost always comes from the differences in estimated atmospheric sensitivity to concentrations of CO2 in the atmosphere. Having extra CO2 in the atmosphere warms the atmosphere, which is presumed to produce more water vapor, which is also a greenhouse gas and would contribute more warming than the CO2 by itself. How much extra warming would ensue is pretty much the heart and soul of the debate over global warming.
Those who think that there isn’t much of an additional effect (that sensitivity of the atmosphere is low) have been chuckling very publicly because temperatures haven’t risen very much (if at all) since the big El Nino year of 1998. This is not hugely surprising, as the shape of the data is uneven, a sawtooth with ups and downs that can last a decade or longer. But it is happening at an inconvenient time politically for those who are worried that sensitivity is high. They are trying to get the world to prepare for warming of 4.5C or higher, without much success.
Here’s what temperatures look like more recently.

By itself, this chart doesn’t explain very much. As I said, it is not uncommon or unexpected for the temperature record to have flat or declining periods that last a decade or more.
However, I have a problem. The Carbon Dioxide Information Analysis Center (CDIAC) has estimates of how much CO2 humans have emitted since 1750. (Confusingly, they convert the CO2 to tons of carbon with a fixed formula.) That chart is the first one way up there at the top of the post. It rises dramatically
But looking at the data global.1751_2009 (3), one thing jumps out at me. CDIAC writes “Since 1751 approximately 356 billion metric tonnes of carbon have been released to the atmosphere from the consumption of fossil fuels and cement production.” And they helpfully provide an Excel spreadsheet showing their estimates by year.
And almost one-third of that number, 110 billion metric tonnes, have occurred since that time in 1998 when temperatures reached their temporary plateau.
| 1998 | 6644 |
| 1999 | 6611 |
| 2000 | 6766 |
| 2001 | 6929 |
| 2002 | 6998 |
| 2003 | 7421 |
| 2004 | 7812 |
| 2005 | 8106 |
| 2006 | 8372 |
| 2007 | 8572 |
| 2008 | 8769 |
| 2009 | 8738 |
Above: Table1, CO2 emissions by years, million metric tonnes – data CDIAC
Because heat moves somewhat sluggishly through the earth’s oceans, and because there is a lag factor in other earth systems, we do not expect a hair-trigger reaction to increases in CO2 emissions and concentrations.
But one-third of all human emissions of CO2 have occurred since 1998. And temperatures haven’t budged as a result.
This does not ‘disprove’ global warming–at all. I still believe that temperatures will climb this century, mostly as a result of the brute force effect of the 3,000 quads of energy we will burn every year starting in 2075–the reason I started this weblog.
However it makes it exceedingly difficult to use the past 15 years as evidence of a very high sensitivity of the atmosphere to CO2 concentrations. And it makes me feel more comfortable about my ‘lukewarm’ estimate of 2C temperature rises as opposed to the more alarming 4.5C rises put forward by some of those who are most active in the movement to reduce emissions drastically.
And it makes me wonder about why people don’t include relevant data when they discuss these issues. Is it really that politically incorrect to show real data, even if that data doesn’t advance your case?
Tom Fuller blogs at: 3000Quads and is co-author with Steve Mosher of the CRUTape Letters.
“assuming cheap and practical batteries”
Might as well assume unicorns and fairies.
“How many thermometers were there in the Southern Hemisphere in 1880 to calculate the global average temperature of the Earth for that year?”
If one tree is sufficient to measure the temperature of the entire world, then surely 10 to 15 thermometers should be over kill when it comes to measuing the temperature of the southern hemisphere.
****
blogagog says:
December 7, 2012 at 1:26 am
I have a greenhouse that during growing season is kept at ~1500PPM CO2. Plants love it, but it will give you a pretty bad headache if you stay in there for 2 hrs or more.
****
How is the greenhouse enriched? If it’s burner exhaust, your headaches are prb’ly CO induced, not CO2. Pretty sure 1500 ppm CO2 shouldn’t effect you…
Well. I don’t know about the “physics behind the theory of global warming”being “solid”or not. But the observations are suggesting that the theory is wrong. Completely wrong.
End of story.
OK. Can we not all concentrate on more important things? Sorry to everyone who has decided to make a career out of it but you were wrong. You probably owe us all. The least you can do is acknowledge the fact that you were wrong and then you can maybe start paying us back.
I think it’s fascinating that a “lukewarmer’s” post would have hit a sweet spot of interest and provoked such an outpouring of very well thought-out, very diverse, and well documented comments surrounding virtually every aspect of the CAGW debate, and in the process exposed the concept of “settled science” as a total joke at this point. Judy Curry has tried to create such a discussion on her site, but the debate was never as focused as this one.
JWR says:
>>
Look in figure 4 of the following link and get the results for ftot=1
http://www.tech-know-group.com/papers/IR-absorption_updated.pdf”
>>
Thanks for the link but sorry, didn’t get as far as figure4. Second line was where I stopped wasting my time:
“back-radiation of heat” is not a physical phenomenon. [1, 2, 3]
Heat flows and radiates spontaneously only from warm to cold.”
Yet another idiot who thinks he can rewrite the 2nd law and believes a photon can check where it’s going before being emitted and decide whether it’s “allowed” to go there or not.
But look to the next alinea.
Do you think that in the one-slab model the slab absorbs 2q or one q.
And if you are not sure, in the stack of 51 layers is the first slsb absorbing 100q , according to the two-stream formulation- or one q, like all other slabs according to the (correct) interpretation of Stefan-Boltzmann.
But why not looking a bit futher, to find out that the one-stream formulation gives results which are more convicing than the two-stream formulation, a violation of the 2nd Law.
DL Klitsteins says: “This is because the greenhouse gas effect of CO2 varies approximately logarhythmically with CO2 level. On a log scale, the post-1998 CO2 increase is about 23.5% of the increase above the pre-industrial estimate.”
logarithmic 😉
You are right to a point which I once reason why I suggested this article should show this data as a log plot:
http://i45.tinypic.com/2na2zd5.png
However, it’s not even that much since the CO2 concentration is now well beyond what spectroscopy calls ‘linear’ , which actually means it’s linear on a log plot of 😉 The scale of absorbance units is a log scale. CO2 in the atmosphere is pretty much saturated in the wavelengths where it is relevant. The only way it can still have an increasing effect is by the absorption bands broadening by what is called “collision broadening”.
But all this is a bit of side show if they are going to insert “parameters” into the models that multiply the result of the physics based calculation by a factor of three.
So the greatest addition of CO2 ever by mankind produces NO detectable temperature increase?
As in none? Nada? Zippo?
Gaia is messing with you, Tom. And she doesn’t suffer fools lightly.
Matt says:
December 7, 2012 at 2:50 am
Oh, H fusion works. It just isn’t affordable–like solar, wind, geothermal, algae. LENR is a more likely solution.
Sorry old chap, but Arrhenius = Erroneous.
And try comparing the heat content of the atmosphere (even it were trapped by that awful Satan gas) with that real driver of climate, the oceans. Infinitesimal by comparison.
Well done for the cherry picking on the graph of temperature increase, perhaps it would have been more useful/justifiable to look at the 100 time span to date. And then a different picture forms.
The notion that our tiny contribution to atmospheric CO2 is either significant, or long lasting is laughable.
Yes Tony you are right.
The link hereunder give you the numbers.
http://www.tech-know-group.com/papers/IR-absorption_updated.pdf
It’s an even bigger problem than Mr. Fuller will admit. It is yet further evidence, the icing on the cake, if you will, showing that the GCMs are pure unadulterated bunkum. Belief systems, even those which are “more moderate” are difficult to set aside, I guess. Ya just gotta love the “brute force effect” of man’s C02. You can’t see it, can’t measure it, but you just KNOW it’s there.
If CO2 slows down the cooling of the Earth’s surface, then does it not, by that exact same process and to the exact same degree, slow down the warming of the Earth’s surface — by absorbing IR coming in from the Sun and isotropically re-radiating ~half of that back out? After all, about half the incoming solar radiance is IR.
Is there some reason CO2 works on outbound IR and not on incoming?
What strikes me about the trend of the CO2 graph is that it is linear and not logarithmic. I would have expected that since the 1960’s that fossil fuel use, number of cars, businesses, expansion of developing countries, population increases that the graph SHOULD be more of a log growth than linear. I get that the fluctuations are due to seasonal changes, but everything looks just too constant, trend-wise, for me to definitively say that this is all due (or even mostly due) to humans. The recessions and expansions that have affected global economies should have made more blips and bumps in the graph, no? Can anyone help me out with what I’m missing here?
Another thought for the pool: part of the implicit premise of the article is flawed. Though carbon emissions are going up dramatically, the quantity of carbon in the atmosphere isn’t going up as fast. You can check this out by comparing the rise in PPMV with emissions. By my estimates, only about 50% of the carbon ends up in the atmosphere, and that proportion has been going down for about 10 years. Even if it were constant, the “third of emissions since 1998” doesn’t mean “third of increase in CO2 since 1998”.
FWIW, I’m with the author. The current rate of CO2 growth coupled with historic correlation /sensitivity of temperature to CO2 means that AGW really doesn’t matter. That’s even leaving aside the real possibility that the rise in temperature is an unrelated natural phenomenon, or that feedbacks might be (or even become) negative. You have to believe computer models which say that things are going to get much worse in order to be in the worried camp.
Thinking Out Loud sez: “To account for thermal lag you can repeat but offset the d(temp) from the d(C02) by one year, two years etc, but you still get fundamentally the same picture. What that says to me is that the influence on temperature from C02 is small compared to something else.”
In a linear/monotonic analysis, the time lag does not make a difference. Pearson r would be the same. Linear regression weight would be the same, although intercept would be different. In the natural world, most linear relations are linear for some limited range, and the relation curves one way or the other at the ends. Here, at the most you would have a couple data points at either end weakening the calculation of the strength of the monotonic relation.
mellyrn says:
December 7, 2012 at 9:33 am
NO, because the solar radiation comes in at different wavelengths to the outgoing earth radiation. See…
http://www.ghgphys.com/userimages/sunearth2.png
The carbon dioxide band relevant to global warming is between 14 and 16 micron. Notice that this coincides with the outgoing radiation, but doesn’t block the incoming insolation.
Easy – yes! Try to get up to speed.
Tom Fuller says
The physics behind the theory of global warming are solid. CO2 is a greenhouse gas, we’re emitting industrial levels of it, with China now in the lead for emissions. A significant portion remains in the atmosphere for a fairly long time, though the residence time is widely disputed.
This residence of CO2 retards the cooling of the Earth and temperatures warm as a result.
Henry says
this is all rubbish and we have been discussing this at length here for I don’t know how many times/
i.e.
the truth is that the physics is not solid and we do not know if the net effect of more CO2 in the atmosphere is that of warming.
Namely, in the case of CO2,
there is also radiative cooling, due to absorption of the molecule in the UV (which is why we can identify it on other planets!), in 1-2 um, and 4-5 um bands. I am saying that the cooling due to back radiation in these regions of the molecule that goes on 12 hours per day might be just as much as the warming (or:delay in cooling) due to the back radiation coming from earth 14-16 um, that goes on 24/7. So WHERE is Tom’s balance sheet that would show us that the physics is solid? What the IPCC did is evaluating warming against CO2/ GHG increase.
They forgot that more heat (natural) + HCO3- (gigatons in the oceans) => produces CO2 + OH-
(the first smoke of a kettle that has been turned on)
On top of that we have an increase in vegetation over the past 50 years which has been considerable.
Plants and trees need both warmth and CO2 to grow. Or did you ever see a tree grow where it is very cold? So how much biological cooling was caused by the CO2 due to the increase in vegetation over the past 50 years?
.
You see what the problem is? You cannot say: if there is an increase in CO2 it must be getting warmer (even though that increase in warming might be very small) until you have first proven it by doing some physical testing. The closed box experiments do not tell you how much radiative cooling and how much radiative warming is caused by the increase in CO2.
You cannot “calculate” that which has never been measured. (which is what they have been doing by applying as correct the inverse relationship which might not be causal. i.e. smoking causes cancer but cancer does not cause smoking.
For a better understanding of the physics, I advise you all to read this:
http://blogs.24.com/henryp/2011/08/11/the-greenhouse-effect-and-the-principle-of-re-radiation-11-aug-2011/
“…you don’t have to be a climate scientist to think that there seems to be a connection.”
I agree. In fact I’d go as far as to say it probably helps if one is scientifically illiterate in order to think that there “seems to be a connection.” We know we’ve been pumping out CO2 throughout the industrial age. That doesn’t mean you can then pick any other trend, e.g. temperature change, and conclude that there is a “connection” at all, let alone a cause-and-effect relationship. It could be an accidental coincidence. The fact that historically CO2 has never caused run-away warming in the past (natural CO2 changes have always followed temperature changes, not vice versa) gives support to this theory.
The empirical evidence is clear: CO2 does not significantly affect temperature. Temperature determines CO2.
blogagog says:
December 7, 2012 at 1:26 am
Holy crap. I’m not even slightly worried about the effect of CO2 on temps, but are you saying that CO2 concentrations in the atmosphere are increasing 33% per 14 years (23.5% per decade)? That actually IS a problem.
I have a greenhouse that during growing season is kept at ~1500PPM CO2. Plants love it, but it will give you a pretty bad headache if you stay in there for 2 hrs or more. Don’t know why, but it’s well documented. It’s like the splitting headache you get if you stop drinking coffee for a few days.
I’ve been told but can’t confirm that this happens to humans when CO2 levels reach 1000ppm. If true, everyone’s going to have a constant, splitting headache starting in the year 2052. If it takes 1500 ppm, then the year will be 2069.
I hate headaches. That’s worrisome information.
The headache is caused by acidosis. You are not clearing CO2 from your system as efficiently as you would under lower concentrations. The increase in CO2 results in a systemic shift toward a lower (more acidic) pH. Your doctor could probably offer some easy cures. Acidosis is essentially the same chemical effect that the “ocean acidification” bunch are worrying about. Unlike the ocean, while your system IS buffered to maintain an average pH state, because of the difference in mass, your system’s homeostatic mechanisms are more easily overloaded.
”
A trick question? TSI is overrated. Try considering energies at specific wavelengths and then answering your own question.”
TSI is overrated. Total solar is over rated? really? Is that settled science?
I’ll ask the question again. using whatever wavelengths you want, please show the difference between the sun in the LIA and the sun today?
use watts. it will help folks understand.
P. Solar,
Here is another idiot. When a utility boiler is down, the steam pipes are cold, ambient. When you light the boiler, the gas or coal or oil burns around 4000 F. Very quickly the pipes begin warming, and end up at around 1000-1200 F, of course flled with soon-to-boil water unless it is a supercritical boiler which most of them are now. Now the inside of the boiler is completely lined with steam pipes, as many as can be crammed in. Ges what happens to the burning fuel? Yup, that’s right, still at 4000 F. Looking inside one you get an idea what Hell might be like.
Compare and contrast to your statement. If you could contradict me I would sincerely appreciate it, as this is counter-intuitive, but happens just every darn time. If it didn’t soon the fuel could be turned off, free ride like an MG Midget behind an 18-wheeler!
Yesterday I spent some Google time drilling for the duration of re-radiation. I got everything from microseconds to picoseconds. It makes a huge difference, as the slower it happens, the less likely it is to happen, as the CO2 molecule will bounce off many neighbors, just heating them up. The most believable writer in fact stated that one in 10,000 events results in re-radiation. Apparently Einstein himself was involved in calculating this.
Is it possible that, in this day and age, the phenomenon is not well-described?
Susan S., every year Mother Nature puts in, and takes back out, 97% of the CO2, and we put in 3% rising. The total in the atmosphere is about 5 years worth of this, so my money is on a 5-year residence time. Crops and forests worldwide are lush these days from the extra CO2, so what will happen in the coming years? Beats me…
“Guess,” sorry sorry
Man made global warming theory depends more on the H2O molecule than CO2, the idea is that CO2 triggers a slight increase in global temps, which then places more water vapor into our atmosphere. This increases global temps. So how has atm H2O levels changed since the 1940’s ? Recent studies indicate a slight downward conc. which is opposite of prediction AGW. Perhaps the wrong atm gas is being studied.
Thanks both to E.M Smith and to sunsettommy. I appreciate the help. So do these graphs show that those natural and man made emissions from 10 years ago, have they then been removed from the graph? Should they not show more of an up down cycle than just a regular climb such as this graph shows?