Guest post by Tom Fuller
The physics behind the theory of global warming are solid. CO2 is a greenhouse gas, we’re emitting industrial levels of it, with China now in the lead for emissions. A significant portion remains in the atmosphere for a fairly long time, though the residence time is widely disputed. This residence of CO2 retards the cooling of the Earth and temperatures warm as a result.
One of the few non-controversial datasets in climate change is the Keeling curve, the graph of the concentrations of CO2 in the atmosphere reproduced here:

We see concentrations rising steadily from 315 parts per million in 1960 to 395 ppm last year. It’s close to 400 ppm now.
Human emissions of CO2 caused by burning of fossil fuels and production of cement have risen similarly:

Emissions have climbed at an even higher rate than concentrations.
And the third data source to look at (for simplicity’s sake–we could actually look at dozens of data sources) is temperature changes. This chart shows the global average temperature change from a ‘normal’ 30-year range from 1950-1980. It comes from the Goddard Institute for Space Studies, led by scientist James Hansen.
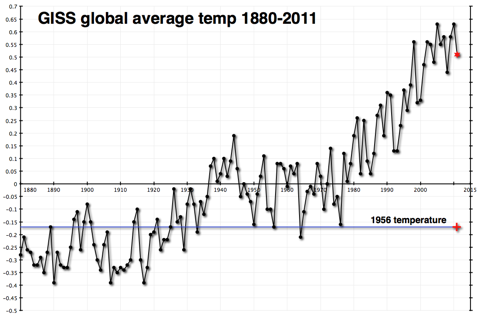
This shows a fairly constant rise in temperatures since 1978.
Once again, you don’t have to be a climate scientist to think that there seems to be a connection. The physical theory published first by Svante Arrhenius over 100 years ago and elaborated on by a century’s worth of scientists has observational evidence that tends to confirm it. I certainly believe in it.
In fact, I believe that global temperatures will probably rise by about 2 degrees Celsius over the course of this century. The difference in estimated temperature rises from different sources almost always comes from the differences in estimated atmospheric sensitivity to concentrations of CO2 in the atmosphere. Having extra CO2 in the atmosphere warms the atmosphere, which is presumed to produce more water vapor, which is also a greenhouse gas and would contribute more warming than the CO2 by itself. How much extra warming would ensue is pretty much the heart and soul of the debate over global warming.
Those who think that there isn’t much of an additional effect (that sensitivity of the atmosphere is low) have been chuckling very publicly because temperatures haven’t risen very much (if at all) since the big El Nino year of 1998. This is not hugely surprising, as the shape of the data is uneven, a sawtooth with ups and downs that can last a decade or longer. But it is happening at an inconvenient time politically for those who are worried that sensitivity is high. They are trying to get the world to prepare for warming of 4.5C or higher, without much success.
Here’s what temperatures look like more recently.

By itself, this chart doesn’t explain very much. As I said, it is not uncommon or unexpected for the temperature record to have flat or declining periods that last a decade or more.
However, I have a problem. The Carbon Dioxide Information Analysis Center (CDIAC) has estimates of how much CO2 humans have emitted since 1750. (Confusingly, they convert the CO2 to tons of carbon with a fixed formula.) That chart is the first one way up there at the top of the post. It rises dramatically
But looking at the data global.1751_2009 (3), one thing jumps out at me. CDIAC writes “Since 1751 approximately 356 billion metric tonnes of carbon have been released to the atmosphere from the consumption of fossil fuels and cement production.” And they helpfully provide an Excel spreadsheet showing their estimates by year.
And almost one-third of that number, 110 billion metric tonnes, have occurred since that time in 1998 when temperatures reached their temporary plateau.
| 1998 | 6644 |
| 1999 | 6611 |
| 2000 | 6766 |
| 2001 | 6929 |
| 2002 | 6998 |
| 2003 | 7421 |
| 2004 | 7812 |
| 2005 | 8106 |
| 2006 | 8372 |
| 2007 | 8572 |
| 2008 | 8769 |
| 2009 | 8738 |
Above: Table1, CO2 emissions by years, million metric tonnes – data CDIAC
Because heat moves somewhat sluggishly through the earth’s oceans, and because there is a lag factor in other earth systems, we do not expect a hair-trigger reaction to increases in CO2 emissions and concentrations.
But one-third of all human emissions of CO2 have occurred since 1998. And temperatures haven’t budged as a result.
This does not ‘disprove’ global warming–at all. I still believe that temperatures will climb this century, mostly as a result of the brute force effect of the 3,000 quads of energy we will burn every year starting in 2075–the reason I started this weblog.
However it makes it exceedingly difficult to use the past 15 years as evidence of a very high sensitivity of the atmosphere to CO2 concentrations. And it makes me feel more comfortable about my ‘lukewarm’ estimate of 2C temperature rises as opposed to the more alarming 4.5C rises put forward by some of those who are most active in the movement to reduce emissions drastically.
And it makes me wonder about why people don’t include relevant data when they discuss these issues. Is it really that politically incorrect to show real data, even if that data doesn’t advance your case?
Tom Fuller blogs at: 3000Quads and is co-author with Steve Mosher of the CRUTape Letters.
Holy crap. I’m not even slightly worried about the effect of CO2 on temps, but are you saying that CO2 concentrations in the atmosphere are increasing 33% per 14 years (23.5% per decade)? That actually IS a problem.
I have a greenhouse that during growing season is kept at ~1500PPM CO2. Plants love it, but it will give you a pretty bad headache if you stay in there for 2 hrs or more. Don’t know why, but it’s well documented. It’s like the splitting headache you get if you stop drinking coffee for a few days.
I’ve been told but can’t confirm that this happens to humans when CO2 levels reach 1000ppm. If true, everyone’s going to have a constant, splitting headache starting in the year 2052. If it takes 1500 ppm, then the year will be 2069.
I hate headaches. That’s worrisome information.
I suggest the way forward for surface transport is indeed electricity by hydrogen powered fuel cells. The electricity being produced by new generation nuclear e.g. Thorium based or eventually nuclear fusion.
You post ignores technological advances in energy production.
There was great worry in London at the end of the 19th century regarding horse manure. Future generations were going to be overwhelmed in horse manure if we did not act now. 😉
Shale gas, nuclear fusion, nuclear fission, energy efficient materials and the unknown.
http://www.iter.org/
blogagog says:
December 7, 2012 at 1:26 am
Well you wouldn’t want to be a submariner where CO2 levels are around the 4000 to 5000 PPM mark.
blogagog; the 33% increase is for human emissions, which are a very low proportion of the total including natural.
Thanks for the post and all the comments. Good to see data and physics discussed.
One question: Why do we still use global average temperature as a proxy for heat content and radiation?
First: Near surface air temperature does does not say much about heat content and radiation of that area without accompanying data on air humidity.
Second: Average global temperature says nothing about wether the earth is warming or not because a reduction in temperature swings alone would result in higher average temperatures without any change in overall radiation.
Third: Average global temperatures are influenced by cloud cover. Cloud cover has increased in those years and may have counteracted any additional radiative forcing of CO2.
To sum it up: We don’t know if this one third of human CO2 emissions since 1998 has had any effect on “global warming”. It can certainly not be judged by looking at global average temperature alone.
You show a grapgh or rising CO2 and a graph of rising temperature and state “Once again, you don’t have to be a climate scientist to think that there seems to be a connection.” If you substituted a graph of rising incidence of say, asthma, does that mean rising Co2 causes rising asthma?
Correlation is not causation.
eco-geek: ‘what is the physics behind global warming’. There isn’t any! Firstly the earth and the ~100m adjacent atmosphere are at near the same temperature. Therefore the radiative equilibrium is set by the thermal emission of the atmosphere reducing the equivalent wavelength vectors from the surface. Because the GHG part of the thermal spectrum is near black body, this means there are just a few water vapour side-bands [23 W/m^2] net IR. Most of the IR is lost via the atmospheric window,
Secondly, No IR absorbed by the atmosphere can be directly thermalised: there is no experimental proof of any direct thermalisation.
it’s a big confidence trick based on claiming imaginary polluted cloud cooling hides imaginary CO2-AGW.
I don’t think you will get headaches anytime soon.
Co2 levels of concern might become just a thing of the past by 2052. Look at the USA co2 output curve. Also look at China’s heavy investment in nuclear and hydro. Things are changing but not in the way Warmists want. I doubt headaches will be a concern to people living in 2052.
Here is the MNDOLI link:
http://www.health.state.mn.us/divs/eh/indoorair/co2/index.html
@JMT:
It’s worse than we thought. CO2 is causing Solar Storms!
http://chiefio.wordpress.com/2012/04/20/co2-causes-solar-storms/
We’ve had rising levels of solar storms right in sync with CO2 for DECADES. Clearly it’s a problem. And as there’s nothing else the Magic Gas can’t cause, I see no reason to ignore this one.
😉
But Wait! There’s MORE!!
http://motls.blogspot.com/2006/05/global-warming-on-jupiter.html
That nasty ol’ CO2 is even making the OTHER planets warm up! Right in sync with CO2, they ALL get warmer!!!
Clearly CO2 is causing all of this. After all, the lines both go up together!!
😉
Sensitivity to CO2 is zero, maybe slightly negative, if anything. Climate shifts from warming to cooling at the highest CO2 concentrations, and from cooling to warming at the lowest concentrations. This has never failed and it’s happening now again, for the milionth time.
On the face of the Earth’s energy budget, the radiatively active gases radiate to space and cool, while the non-active gases (the bulk, N2, O2) cannot radiate and therefore insulate. They’re the real GHGs.
http://science-edu.larc.nasa.gov/EDDOCS/images/Erb/components2.gif
Tom Fuller said;
‘One of the few non-controversial datasets in climate change is the Keeling curve, the graph of the concentrations of CO2 in the atmosphere reproduced here.’
Non controversial??!! Just see how fast Ferdinand would get here if I posted an extended excerpt from Becks work.The CO2 records available from 1830 need independent auditing as they show a different picture to Keeling (who was greatly influenced by G S Callendar and somehow miraculously got the concentrations right first time-something that had apparently eluded generations of scientists before him )
In using as evidence material from Giss from 1880 you are ignoring the reality that temperatures have been rising-in fits and starts-since the 1600’s;
http://wattsupwiththat.com/2012/08/14/little-ice-age-thermometers-historic-variations-in-temperatures-part-3-best-confirms-extended-period-of-warming/
In this context Hansens record from 1880 (largely copied from the stations used by Callendar who was called an amateur by the Royal Met Society) can be seen as no more than a staging post of already rising temperatures and not the starting post.
Arrheniius substantially changed his estimates in 1907 in a paper that seems to get quoted a lot less than his estimates from a deade earlier.
My increasing belief is that man is a low noise within the climate system (a sometimes loud noise locally but relatively quiet in a global context) through its activties primarily involved with Forestry and agriculture, but that co2 itself is a minor and muted noise within the overall song of humanity..
Nice to see you writing here again. Look forward to more pieces.
tonyb
eco-geek says: December 7, 2012 at 1:15 am
OK, most of the energy from the Earth’s surface is actually lost by radiation. But no matter how the atmosphere is heated, whether by conduction, convection, evaporation or radiation, it can only radiate back to Earth due to the prescence of greenhouse gases. The major constituents of the atmosphere, oxygen and nitrogen, do NOT radiate in the thermal IR region. So, without greenhouse gases, there would be no back-radiation.
*The physics behind the theory of global warming are solid.*
It is obviously not, since the “science” must be helped by skewed paleoclimatic hockey sticks, artificially adjusted temperature data. It is as solid as leftist’s idea, that raising taxes or eliminating the rich class will yield more revenue. Usually it does not.
*CO2 is a greenhouse gas.*
Name-calling.
*This chart shows the global average temperature change from a ‘normal’ 30-year range from 1950-1980.*
Friends do not let friends use GISTEMP.
*The physical theory … has observational evidence that tends to confirm it. I certainly believe in it. I believe that global temperatures will probably rise by about 2 degrees Celsius over the course of this century.*
Science is not about believing. In God we trust; all other show data.
*Having extra CO2 in the atmosphere warms the atmosphere, which is presumed to produce more water vapor*
Never observed so far.
*As I said, it is not uncommon or unexpected for the temperature record to have flat or declining periods that last a decade or more.*
Models have not predicted such a flat period.
http://blog.sme.sk/blog/560/310249/global2001.jpg
There was substantial cooling between 1945-1980.
http://data.giss.nasa.gov/cgi-bin/gistemp/gistemp_station.py?id=431043600000&data_set=14&num_neighbors=1
These kind of lukewarm posts should be endorced in WUWT. This shows that the author has an open mind and the courage to discuss the shortcomings of the typical models. The only way to advance specticism is to debate in a way that does not put the other side in an akward position. If they feel that they discovered the truth themselfs, they are much more likely to change their views.
I’m certain that if the warming plateau continues majority of the lukewarmers will shift their opinions accordingly. Anayways this article is a great tool. Now I can ask “Why hasn’t there been any global warming for 15 years, when 1/3 of all the human released CO2 has been released to the atmoshpere?”.
“This does not ‘disprove’ global warming–at all. I still believe that temperatures will climb this century, mostly as a result of the brute force effect of the 3,000 quads of energy we will burn every year starting in 2075–the reason I started this weblog.”
And science does not “disprove” the existence of God – the scientific method is to put forward a hypothesis and set about proving that it is valid, rather than get people to disprove it – such an approach is for people of faith. “I still believe” is a sign of faith and not a statement of science.
Is the figure of 110 billion metric tonnes derived from data extrapolated/extended to 2011? The data from 1998 to 2009 in your table seems to sum to only 91.7 billion.
MikeB: ‘back radiation’ does not exist except as the artefact of the shielding of the detector in a pyrometer.
Its purpose along with the ‘forward radiation’ field from the Earth’s surface is to combine vectorially to produce net energy flow, the only bit that can do thermodynamic work.
The two-stream approximation vastly exaggerates heating so it’s all a big scare story constructed by the physics’ amateur Trenberth, who being a meteorologist was taught incorrect physics.
It”s a bog cock up.
“Arthur, I strongly agree with your point that it is foolish to assume technology is stagnent and our energy sources will be the same in 2075 as today.”
It is very reasonable to assume that the power stations we build today, and have built in the recent past, will still be operating in 2075. E.g. the Chinese happily bring a coal-fired station on line every week – the size of the largest US power station. These things are here to stay for a while…
It should be clear that we fight for strategically securing rescources for a reason: We intend to burn all the stuff that is still in the ground either way, right?
I hope I will still see H fusion succeed in my lifetime.
@AlecM
You are right two-stream heat flow gives spurious absorption.
In the following link are given qualitative results for a one-stream formulation of heat flow.
No back-radiation and absorption by the atmosphere an order of magnitude lower.
The mechanism of heat evacuation is convection.
http://www.tech-know-group.com/papers/IR-absorption_updated.pdf
The AGW is hypothesis has a central constant, something called Hansen delay of 15 years
Hansen was, and is wrong to attribute 15 year lag to the CO2 warming factor!
Why is that?
The 15 years lag is nothing to do with CO2, it is exactly the delay between geomagnetic signal (derived from the combined sun-Earth magnetic field changes and the AMO:
http://www.vukcevic.talktalk.net//GSOc.htm
15 year lag is well known natural effect
It is delay between the changes in the angular momentum of the Earth’s outer core (where magnetic field is generated) and the LOD (length of the day)
NASA & Oxford University: Torsional oscillations of the Earth’s core
http://trs-new.jpl.nasa.gov/dspace/bitstream/2014/13763/1/00-0133.pdf
The total CAM (core angular momentum) exhibits a principal maximum at a 15-year lead with respect to LOD page 6/10
I’m still hoping to raise tomatoes year round. Doesn’t look like I’ll live to see it. Oh, which reminds me, anyone interested in my Y10K software insurance policy? It’s cheap right now. Guaranteed. One hundred percent refundable if not used.
AlecM: Secondly, No IR absorbed by the atmosphere can be directly thermalised: there is no experimental proof of any direct thermalisation.
This has been discussed here at length. Of course back radiation can not increase the temperature of the earth (direct thermalisation), but back radiation can and does slow the cooling of the surface.
Tom Fuller’s statement above therefore is misleading: “Having extra CO2 in the atmosphere warms the atmosphere…”
No it doesn’t. CO2 does not “warm” the atmosphere, never ever. The sun does. CO2 just slows cooling, at least theoretically, resulting in an increase of average temperature readings. Which is pretty irrelevant to the question as temperatures alone tell us nothing about heat content and radiation budgets of a real planet (see post above…). On top of that: Even if CO2 slows the cooling of the earth, we simply don’t know exactly what other effects kick in (clouds? change in weather patterns?) to counter that reduced rate of heat loss and might even temporarily overcompensate, thus resulting in global cooling.
Bair Polaire; Sorry, but I disagree. Back radiation is simply thermal GHG emission. it has nothing to do with CO2 band IR emission from the Earth’s surface because that is annihilated at source.
Sorry, don’t mean to be personal, but this is one of this is one of the most amazing mass delusions in scientific history, a bit like the Earth centric view of the Catholic Church.
There is no significant absorption of IR from the Earth’s surface by GHGs. The GHE is an entirely different phenomenon – the surface temperature rises and that heats the adjacent gas above lapse rate warming, pushing the tropopause a bit higher.
No process engineer who has like me done real measurements of GHG heat emission and absorption considers the ‘consensus’ has the remotest connection with reality. it’s a con.